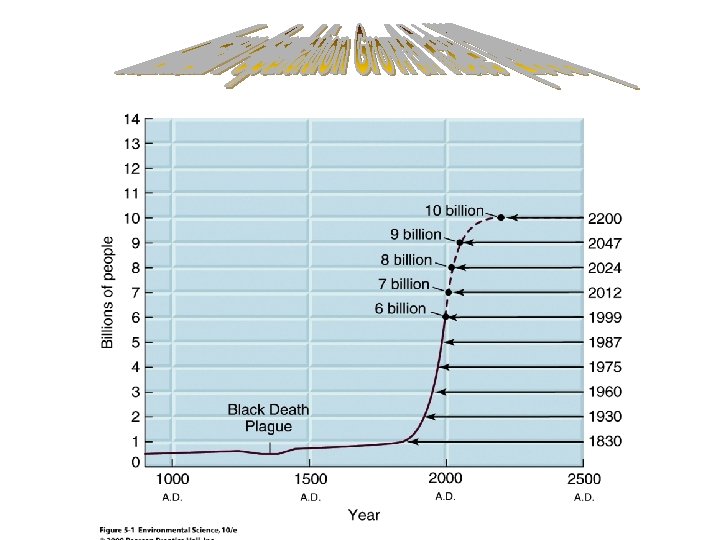
HUMAN POPULATION Growth Demography Carrying Capacity Population Growth

 = birth rate (br) – death rate (dr)")


 – estimate of the average number of")


 100 Co ns")

 100 Co ns")

 100 Co ns")


 294 million 179 million 137 million Brazil (moderately developed) Nigeria (less developed)")


 Bangkok is")

 – cut birth rate, TFR & population")
 35 30 25 20 15 10 5 0 1950 1970")


 89% 86% Diaphragm plus")
 Rhythm method (daily temperature readings) 75% 74% Withdrawal")


 • Harsh living conditions lead to a high birth rate")
 • Industrialization begins which leads to an increase in food")
 • Industrialization is widespread and birth rate begins to drop.")
 • Birth rate decreases even further and equals death rate")


- Slides: 59
HUMAN POPULATION Growth, Demography, Carrying Capacity
Population Growth • Natural Rate (NR) = birth rate (br) – death rate (dr) • Population. Change = (br/1000 + Immigration) – (dr/1000 + emigration) Natural rate of population change = br-dr/1000 x 100 OR br-dr/10 Crude birth rate = number of live births per 1, 000 people in a population in a given year. Crude death rate – number of deaths per 1, 000 people in a population in a given year.
Average crude birth rate Average crude death rate World 21 9 All developed countries 11 10 All developing countries 24 8 Developing countries (w/o China) © 2004 Brooks/Cole – Thomson Learning 27 9
© 2004 Brooks/Cole – Thomson Learning Africa 38 14 Latin America 22 6 Asia 20 7 Oceania 18 7 United States 14 8 North America 14 8 Europe 10 12
Population Growth • Total Fertility Rate (TFR) – estimate of the average number of children a female will have during reproductive years (15 -45). • Global TFR in 2004 = 2. 8 children per woman. • Developing Countries TFR = 3. 1, some African countries have a TFR of 6! • Developed Nations are steady with a TFR of 1. 6 • Not until Developing Nations reach a TFR of 2. 1 will world populations stabilize! • GOAL = Replacement Level Fertility (RLF)
Global Total Fertility Rates
© 2004 Brooks/Cole – Thomson Learning World 5 children per woman 2. 8 Developed countries 2. 5 1. 6 Developing countries 6. 5 3. 1 Africa 6. 6 5. 1 Latin America 5. 9 2. 6 Asia 5. 9 2. 6 Oceania 3. 8 2. 1 North America 3. 5 2. 0 Europe 2. 6 1. 4 1950 2004
Why Are TFR’s So High In Africa? • • • No government supported family planning. Low literacy rate among woman. Few economic roles for woman. Woman’s rights…are there any? Poor health care for mothers/mothers-to-be. AIDS rampant. Need many children for labor. High infant mortality due to poor quality of life. Abortions, legal or safe?
Growing Cities
How Have Fertility Rates Changed in the USA? • • Population in 1900 – 76 million Population in 2004 = 294 million 1957 (peak baby boom) – TFR = 3. 7 Since 1972 – USA at or below replacement level fertility (RLF) • USA population is growing faster than any other developed nation, why?
Baby Boom Years 4. 0 Births per woman 3. 5 3. 0 2. 5 2. 1 2. 0 1. 5 Baby boom (1946 -64) 1. 0 Replacement level 0. 5 0 1920 1930 1940 1950 1960 1970 Year 1980 1990 2000 2010
Population Increase in the USA • Br>dr because standard of living is high. • Baby-boomers now finally approaching postreproductive age! • Increase in unwed mothers (teenagers mostly, many in inner-city areas). • Inadequate family planning. • Ethnic group increases from immigration from developing nations who believe in the large family unit. • Immigration (legal and illegal) = 71% of the population increase in the USA!
Male Female Male Rapid Growth Guatemala Nigeria Saudi Arabia Ages 0 -14 Pre-reproductive © 2004 Brooks/Cole – Thomson Learning Female Slow Growth United States Australia Canada Ages 15 -44 Reproductive Ages 45 -85+ Post-reproductive
Factors That Affect Birth/Fertility Rates • • Average level of education and affluence; Importance of children in the labor force; Cost of raising and educating children; Education and employment opportunities for woman; • Infant mortality rates related to access to health care and medicine; • Availability of legal abortions. • Access to contraceptives and family planning education.
Factors That Lower Death Rates • • Increased distribution and supply of food resources; Higher living standards; Better nutrition (food/vitamins); Improvements in medical and public health technology; Improvements in sanitation and personal hygiene; Safer water supplies. NOTE: Infant mortality rate (IMR) is a good indicator of quality of life because it reflects the general level of nutrition and health care for a geographic region.
Global Infant Mortality Rates
Why Are TFR’s Higher In Developing Countries? • Infant mortality rate is high; • Need a few children to help farm, earn an income, take care of parents as they age; • Ignorance regarding sexual education (also accounts for high incidence of AIDS especially in African Nations); • No access to contraceptives or other birth control; • Socially acceptable to have many children and multiple sexual partners at an early age(12 -15). • NOTE: Average for marriage in a developing nation is 15! • Average for marriage in a developed country is 25!
“Young Mothers”
Survivorship Curves • Survivorship curves indicate life expectancies for organisms. This is a way to represent the age structure of the population. • The curve represents the number of survivors of each age group for a particular species.
Late Loss Curves • Late loss curves are common to kstrategists. They produce few young and care for them. This reduces infant and juvenile mortality. • Examples = humans, elephants, gorilla, etc. .
Figure 9 -11 Page 171 Late loss Percentage surviving (log scale) 100 Co ns t 10 an tl os s 1 0 Early loss Age
Early Loss Curve • Early loss curves are common to rstrategists. They produce many young who receive no parental care. This allows compensates for high infant/juvenile mortality. • Once the young reach a critical age, there is high survivorship. • Examples = annual plants, bony fish, amphibians, etc…
Figure 9 -11 Page 171 Late loss Percentage surviving (log scale) 100 Co ns t 10 an tl os s 1 0 Early loss Age
Constant Loss Curve • An intermediate number of young with limited parental care common to constant loss curves. • They experience a fairly constant rate of mortality in ALL age classes, so there is a steady decline in survivors. • Examples = lizards, songbirds, and small mammals.
Figure 9 -11 Page 171 Late loss Percentage surviving (log scale) 100 Co ns t 10 an tl os s 1 0 Early loss Age
Age Structure Diagrams Rapid Growth Guatemala Nigeria Saudi Arabia Slow Growth United States Australia Canada Ages 0 -14 Ages 15 -44 Ages 45 -85+
Male Female Male Zero Growth Spain Austria Greece Ages 0 -14 © 2004 Brooks/Cole – Thomson Learning Female Negative Growth Germany Bulgaria Sweden Ages 15 -44 Ages 45 -85+
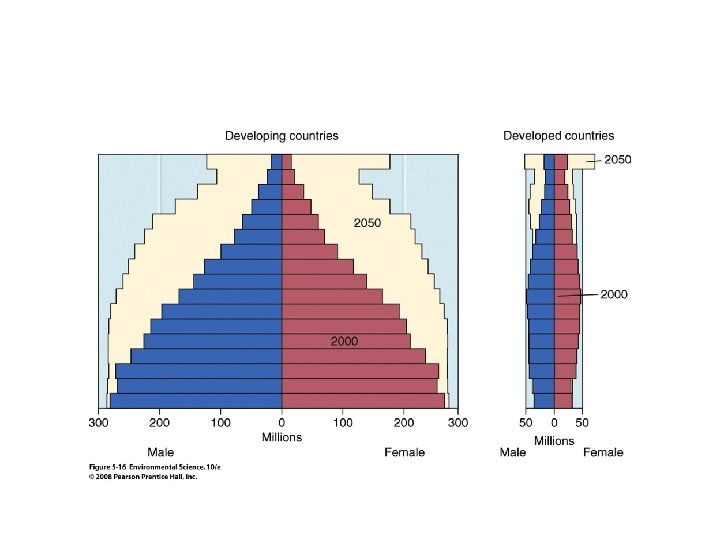
Population (2004) 294 million 179 million 137 million Brazil (moderately developed) Nigeria (less developed) Population projected (2025) Infant mortality rate 349 million 211 million 206 million 6. 7 33 100 Life expectancy 77 years 71 years 52 years Fertility rate (TFR) 2. 0 2. 2 5. 7 %Population under age 15 % Population over age 65 United States (highly developed) 21% 30% 44% POPULATION MOMENTUM Is greatest in developing nations because the prereproductive and reproductive population make up the largest portion of the total population = POPULATION GROWTH 12% 6% 3% Per capita GNI PPP $36, 110 $7, 450 $800 © 2004 Brooks/Cole – Thomson Learning Population Momentum is dictated by quality of life indicators and Per capita income.
India China Percentage of world population 17% 20% Population 1. 1 billion 1. 3 billion Population (2025) (estimated) 1. 4 billion Illiteracy (%of adults) 47% 17% Population under age 15(%) 36% 22% Population growth rate (%) Total fertility rate 1. 7% 0. 6% 3. 1 children per woman (down from 5. 3 in 1970) 1. 7 children per woman (down from 5. 7 in 1972) Infant mortality rate 64 32 Life expectancy GDP PPP per capita 62 years 71 years $2, 650 $4, 520
Thailand • 1971 – Thailand adopted a National Policy to reduce its population growth. • The population was growing at a rate of 3. 2%/year. • TFR was 6. 4 • 1986 – population decreased to 1. 6% • 1988 – population decreased to 1. 1% • 2000 – population decreased to 1% (TFR = 1. 9)
Population Growth Rate • If Thailand’s population growth rate is was 1% in 2000, when will it’s population double? • Use the “Rule of 70” • 70/growth rate = doubling time • 70/1. 0 = 70 years • Therefore, Thailand’s population is expected to double in the year 2070.
How Did Thailand Accomplish Such a Dramatic Decrease in Population Growth Rate? • • • a. b. c. d. e. f. 1. Government –supported family planning program Mechai Viravidaiya created the Population and Community Development Association in 1974. It’s goal was to make family planning a national goal. PCDA Workers: Handed out condoms at festivals, movie theaters, traffic jams. Wrote humorous songs about condom use and why you shouldn’t have more than 2 children (Replacement Fertility) Traffic police handed out condoms on New Year’s Eve, now known as “Cops & Rubbers Day!” Carts to dispense birth control pills and spermicidal foams at bus stations and public events. Open vasectomy clinics (sterilization is the #1 form of birth control in Thailand) On the King’s Birthday, PCDA offers free vasectomies!
Thailand’s Decrease in Population Rate • • • 2. High literacy rate among woman (90%) 3. Economic roles for woman 4. Advances in woman’s rights 5. Better health care for mothers and children 6. Openness of Thailander’s to new ideas 7. Support of family planning by religious leaders (95% Budhist) • 8. Government financial support – economic incentives – family planners can apply for low interest loans to install toilets, drinking water systems, and farmers can install irrigation systems.
Thailand Village
Problems Still Facing Thailander’s • Pollution (increase in resource use per capita) Bangkok is one of the most polluted and congested cities in the world. • High levels of traffic congestions (NOx = photochemical smog & acid deposition), CO 2 & H 2 O (greenhouse gases) • Increased environmental degradation. • Public Health (respiratory problems on the rise, AIDS and other sexually transmitted diseases are rampant (prostitution is legal).
King: PHUMIPHON Adunyadet
Japan • 1949 -1956 (Post - WWII) – cut birth rate, TFR & population growth rates by 50%! • TFR in 1949 was 4. 5, in 1998 was 1. 8 and it is on the decline still. • How? Family Planning Services and Stressed Resources (Japan has no natural resources, they import all necessary raw materials and process it in Japan). • Zero immigration rate = “pure population of Japanese” Population = 99% Japanese! • Economic burden of caring for elderly. • Declining workforce = lead the world in automated technology. • Japan has reached Zero Population Increase…now the world watches to see how they handle these issues in the future.
40 Age Distribution (%) 35 30 25 20 15 10 5 0 1950 1970 1990 2010 2030 2050 2070 2090 2110 2130 2150 Year Under age 15 Age 60 or over Age 80 or over
Access to Family Planning Education and Contraception • Family Planning – Rhythm Method
CONTRACEPTIVE METHODS Extremely Effective Total abstinence Sterilization Vaginal ring 100% 99. 6% 98 -99% Highly Effective IUD with slow-release hormones IUD plus spermicide Vaginal pouch (“female condom”) IUD Condom (good brand) plus spermicide Oral contraceptive 98% 97% 95% 93%
LESS EFFECTIVE CONTRACEPTIVE METHODS Effective Cervical cap Condom (good brand) 89% 86% Diaphragm plus spermicide 84% Rhythm method (Billings, Sympto-Thermal) 84% Vaginal sponge impregnated with spermicide 83% Spermicide (foam) 82%
Moderately Effective Spermicide (creams, jellies, suppositories) Rhythm method (daily temperature readings) 75% 74% Withdrawal 74% Condom (cheap brand) 70% Unreliable Douche 40% Chance (no method) 10%
Contraception in the USA • 60 million US woman are in the reproductive age range(15 -44). • 9/10 are practicing contraception. • There are 3 million unintended pregnancies each year resulting from incorrect or inconsistent use of contraceptives. • Most unintended pregnancies occur in teens! • Is abortion being used in the USA as a form of contraception by teens?
Life Tables • Life tables show projected life expectancy and probability of death for individuals at each age. • Insurance companies use these tables to determine policy costs for their customers. • Woman in the USA survive on average 7 years longer than men. • Therefore, a 65 year old male will pay more $ for life insurance than a 65 year old woman.
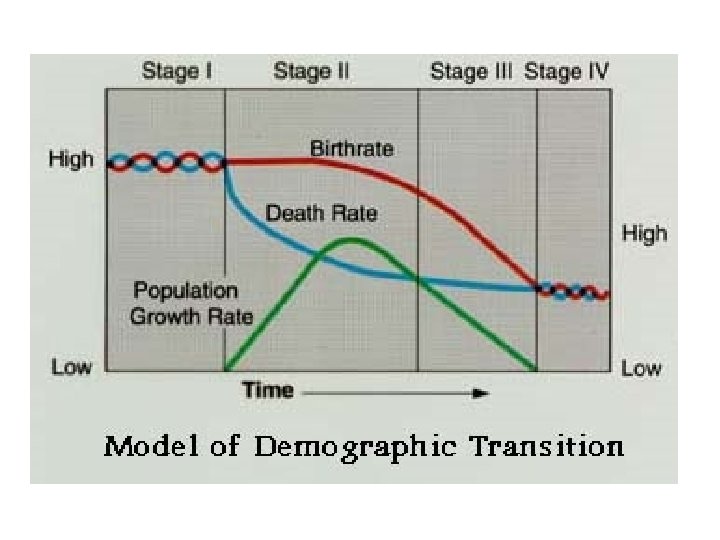
How Does Population Relate to the Economics of a Country? • Demographic Transition – A hypothesis of population change that states as countries become industrialized, first their death rates decrease followed by declines in birth rates. • There are four stages: Pre-industrial, Transitional, Industrial, Post-industrial.
Pre-Industrial Stage (Stage 1) • Harsh living conditions lead to a high birth rate (to compensate for high infant mortality rate) and a high death rate. African Nations
Transitional Stage (Stage 2) • Industrialization begins which leads to an increase in food production and better access to health care and nutrition. India, China, South & Central America, Middle East, Thailand
Industrial Stage (Stage 3) • Industrialization is widespread and birth rate begins to drop. Eventually birth rate will approach death rate. There is better access to birth control and family planning, decreased infant mortality, increase in jobs, and increased opportunities for woman. Most Developed Countries
Post-Industrial Stage (Stage 4) • Birth rate decreases even further and equals death rate = ZERO POPULATION GROWTH (ZPG). • THEN… birth rate drops below death rate and population begins to decline slowly. • *** Shift from unsustainable to sustainable forms of economics!!! • 37 Western European Countries and Japan have reached this stage (12% world population).
Conclusion • Over the next several decades, Developing countries now in the Transitional Stage can make the jump to the Industrialized Stage. As they make this jump, their quality of life improves…so does their per capita resource consumption. What happens next? Keep a close watch on China! • Demographic Trap – A poor country with a population growth of 2. 5%/year needs an economic growth rate of 5% per year to make the transition. (Unlikely).
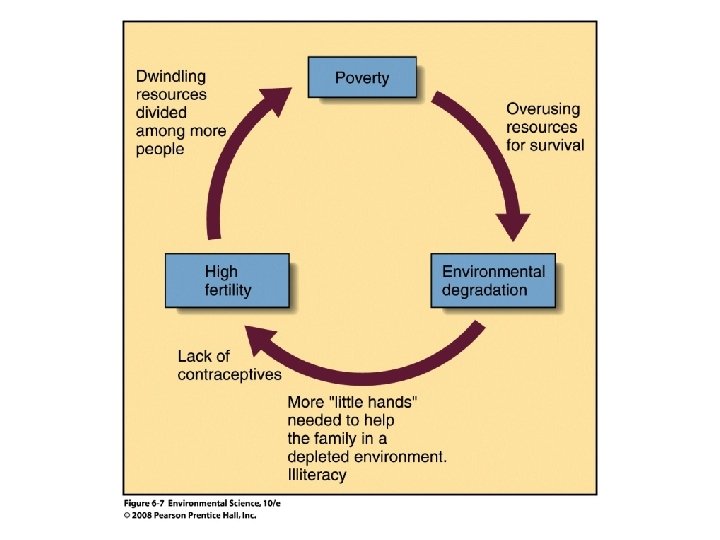
Rapid Population Growth Leads to… ü Rapid and wasteful use of resources with too little emphasis on pollution prevention and waste reduction. ü Degradation to Earth’s life-support systems. ü Poverty which can drive poor people to use potentially renewable resources unsustainably for short-term survival. ü Failure of economic and political systems to encourage sustainable economic development. ü Our urge to dominate and manage nature for our use with far too little knowledge about how nature works. ü Major Connection: Population x Affluence x Technology = Environmental Degradation Px. Ax. T=ED
How Do We Slow Population Growth? • • Promote Family Planning Education Reduce Poverty Empower Woman Improve health care for infants, children, and pregnant woman. Increase access to education especially for girls. Increase the involvement of men in child rearing responsibilities. Reduce and eliminate unsustainable patterns of economic production and consumption. Promote free trade, private investment, and assitance to countries that need help.