Human Population Growth a time number of minutes

Human Population Growth
 time number of (minutes) bacteria 0 1 20 2 40 4 60 8")
(a) time number of (minutes) bacteria 0 1 20 2 40 4 60 8 80 16 100 32 120 64 140 128 160 256 180 512 200 1024 220 2048
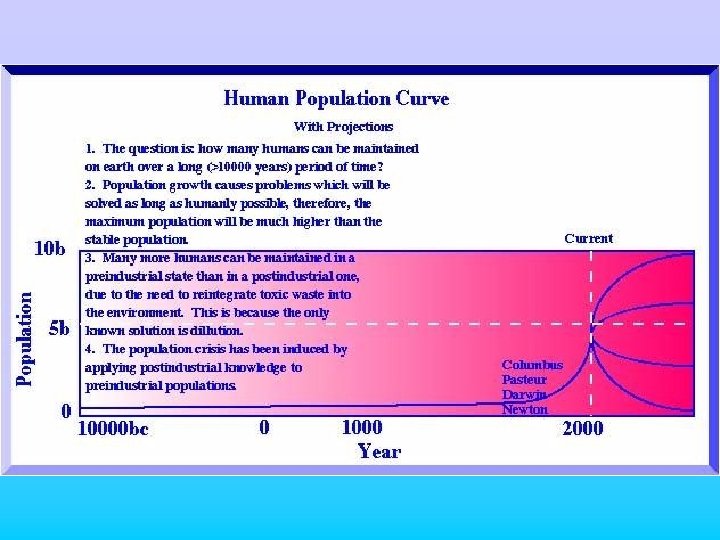
 carrying capacity equilibrium (biotic potential) rapid growth")
(environmental resistance) carrying capacity equilibrium (biotic potential) rapid growth
")
Demography • includes details of: – natality- birth rate (new births per unit time) – mortality- death rate (deaths per unit time) – age structure • natality related to fertility rate and age structure of population • mortality related to age-specific survivorship and age structure of population • studied with respect to geography

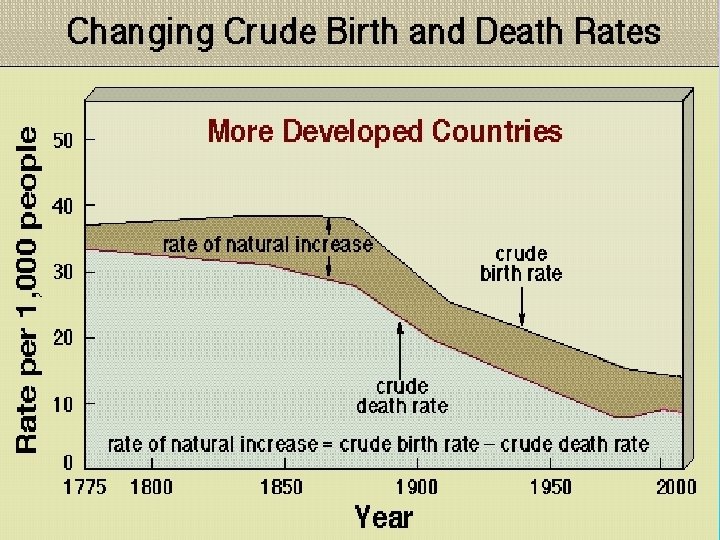
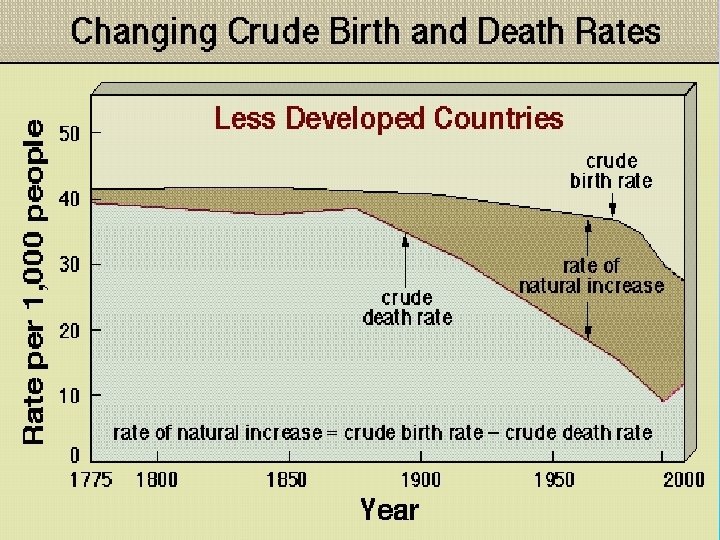
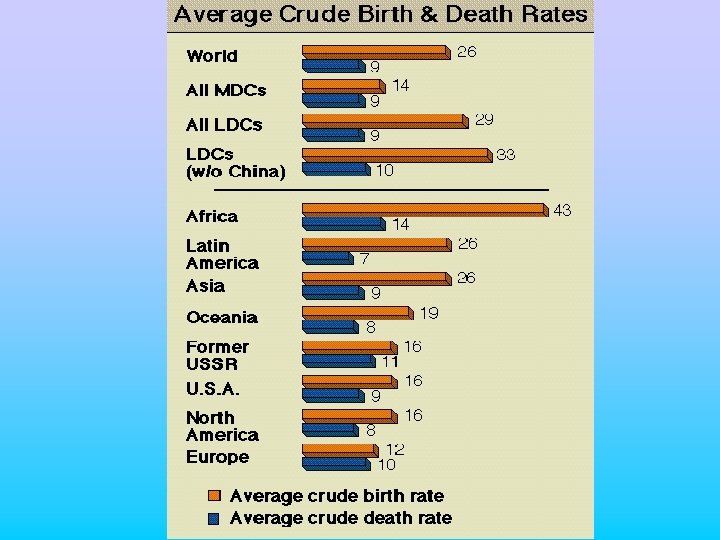
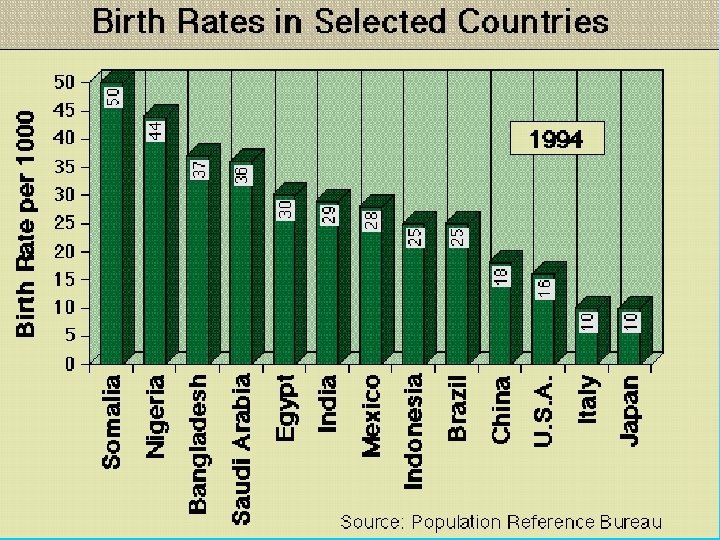
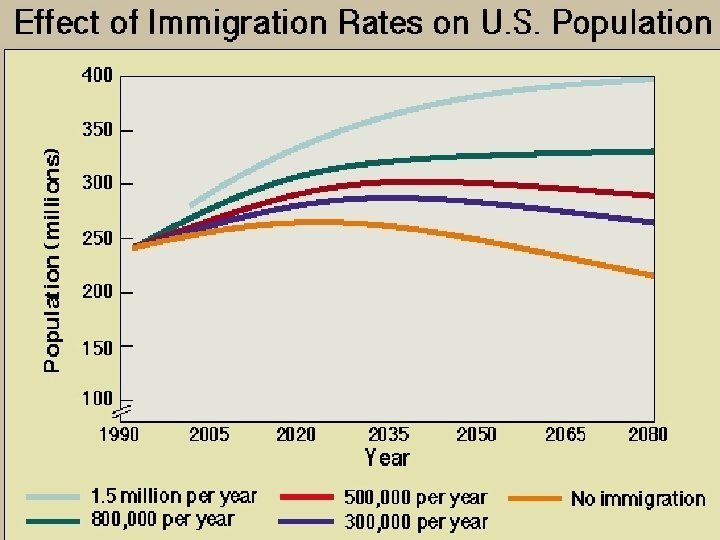
• crude birth rate = # births/1000 people/yr • crude death rate = # deaths/1000 people/yr • Natural increase of a population = (crude birth rate - crude death rate) (x 100) • Zero Population Growth Rate crude birth rate = crude death rate • Total Growth Rate includes immigration and emigration

Doubling Time • = number of years it takes a population to double • calculate approximately by: 70 / annual growth as percentage • Examples: 70/35% growth rate=2 year doubling time 70/4% growth rate=17. 5 year doubling time

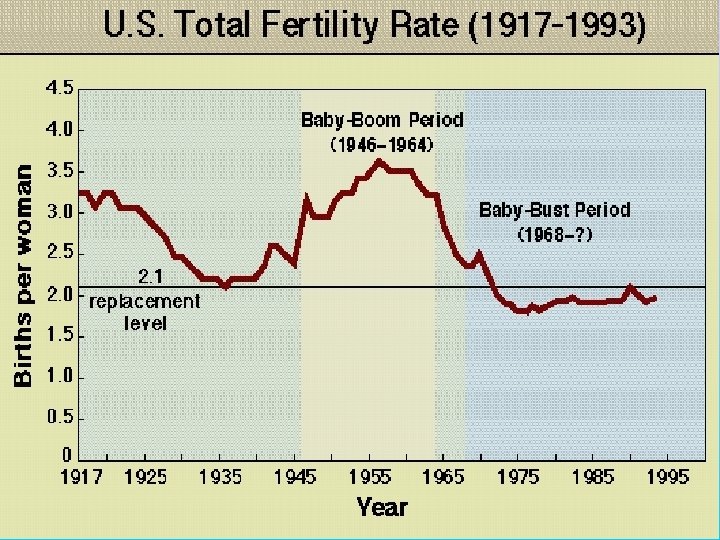
Fertility Rates • Total Fertility Rate = average number of children a woman will have during her entire reproductive life (based on current statistics) • Replacement-level Fertility rates = average number of children a woman would have for replacement – varies between 2. 1 and 2. 5

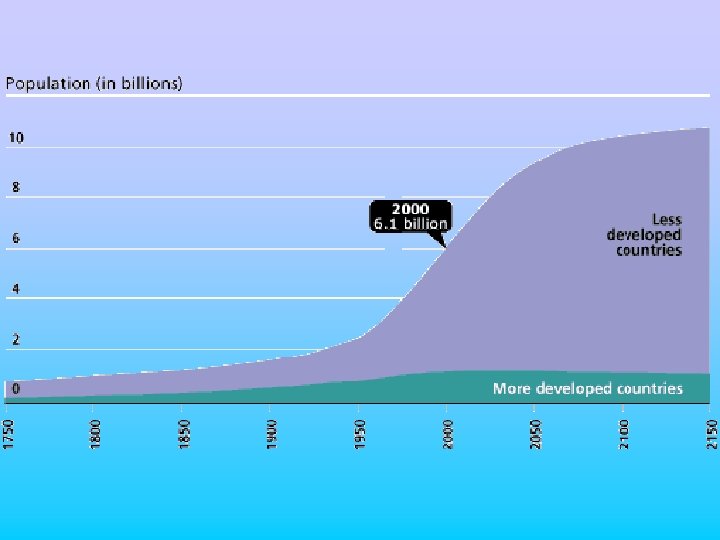
Current Human Population • World population size > 6 billion people • World Natural rate of increase ~ 1. 55 % • In one year, (6 billion)(1. 55%)=89. 9 million added • World population doubling time = 70/1. 55 = 45. 16 years • World Average Total Fertility Rate=3. 0 children per woman

1999 1987 1975 1960 1930 1830 Cultural advances Agricultural advances Industrial and medical advances

Is human population growth an environmental problem? • Consider the following: • What are our “necessary” resources and do they have unlimited availability? • Does earth have a carrying capacity for humans? • How do we value the rights of other organisms? • environmental impact = (#people)(# units of resources person)(impact per resource unit)

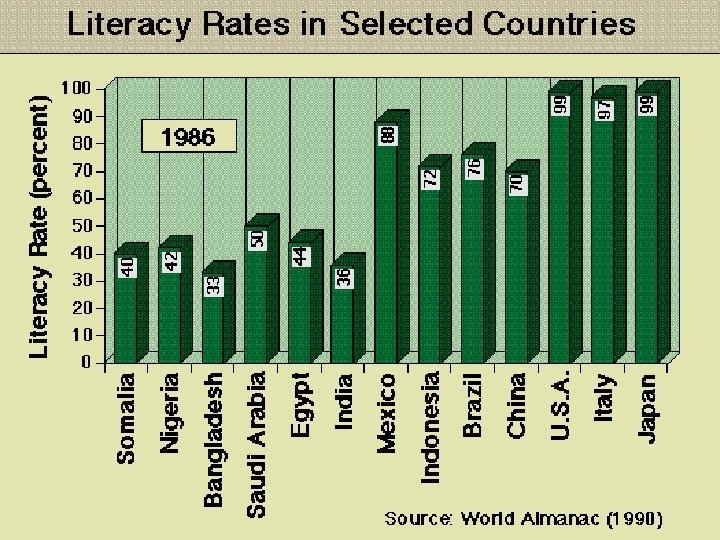
• “developed country”, “more-developed country”, “MDC” – highly industrialized and high per capita GNP – examples: United States, Canada and Western Europe, Japan, Australia, New Zealand • “developing country”, “less-developed country”, “LDC” – low-to-moderate industrialization and low-tomoderate per capita GNP – examples: most countries in Africa (e. g. , Kenya, Nigeria), Asia (e. g. , India, Bangladesh, China), Latin America (e. g. , Bolivia, Guatemala), former Soviet Union
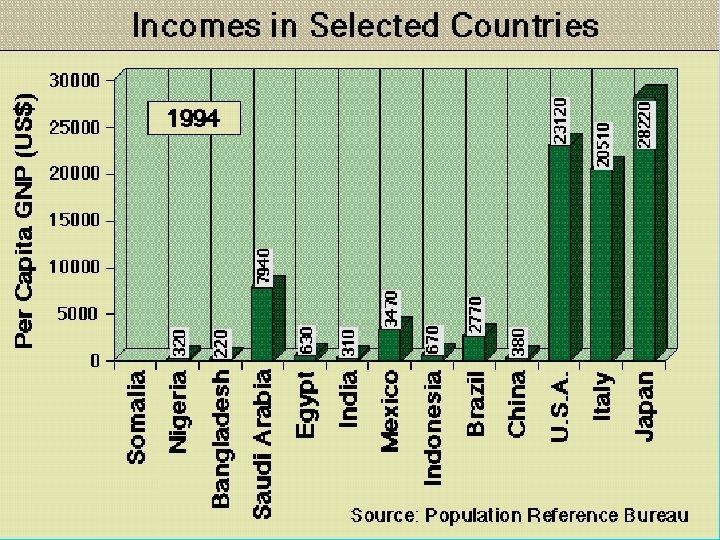
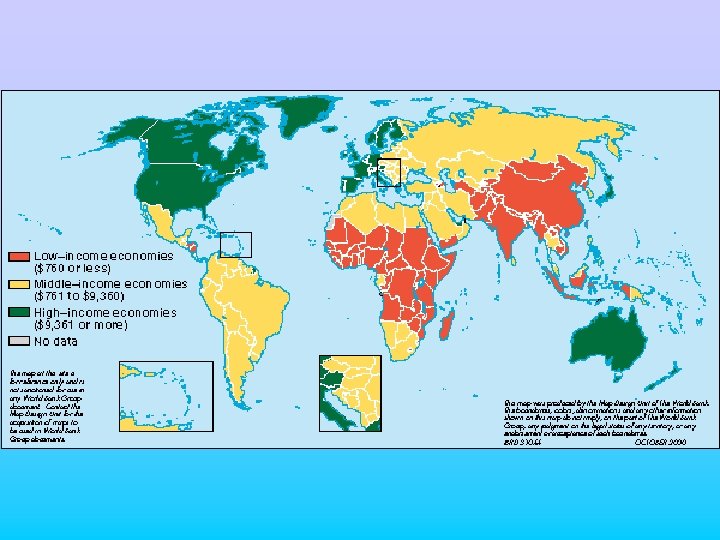

Disparity between rich and poor • developed nations have 21% of population but 80% of wealth • developing countries have 79% of population but 20% of wealth • 10 -15% of people in developed countries are “poor” • 90% in developing countries are “poor”
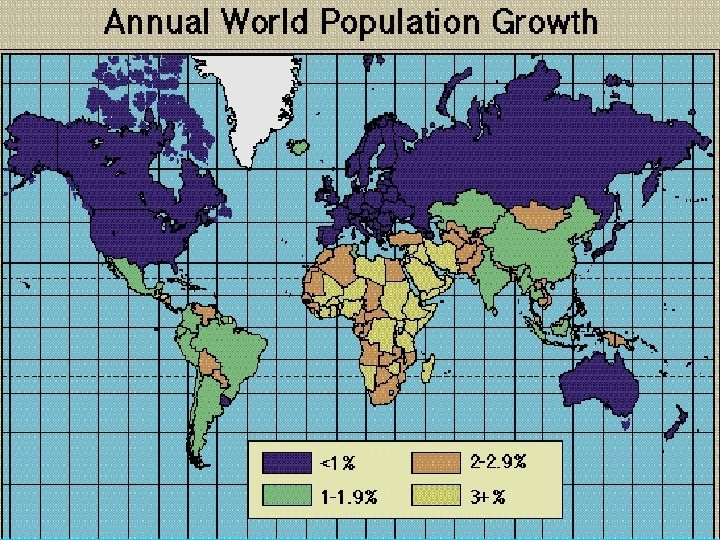

World average 1. 4% Developed countries 0. 1% Developing countries 1. 7% Africa 2. 4% Latin America/Caribbean 1. 8% Asia (excluding China) 1. 7% China 0. 9% N. America 0. 6% Europe – 0. 1%
 (1790 -2000)")
U. S. population (in millions) (1790 -2000)

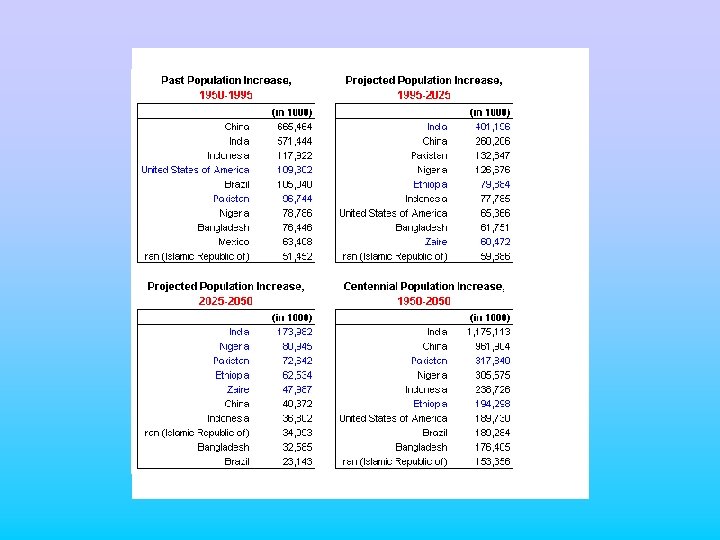
In general: • fertility rates have declined • mortality rates have declined • population growth continues because fertility rates still higher than replacement rates (which includes mortality) • LDC’s tend to have higher fertility rates than MDC’s and higher population growth

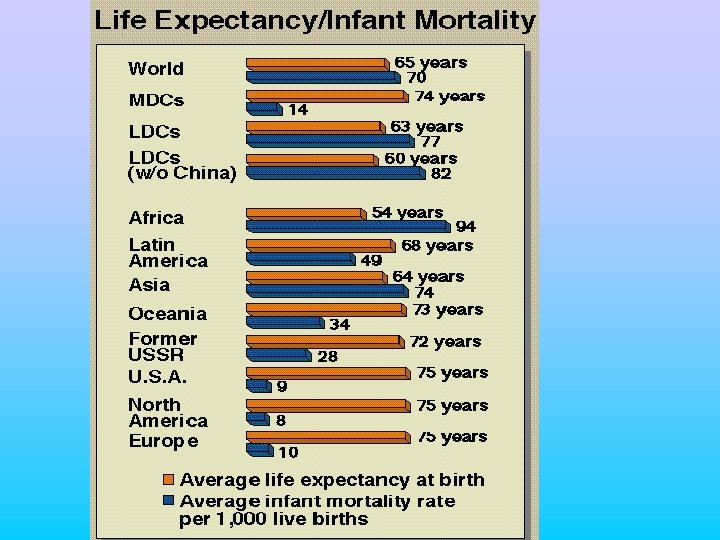
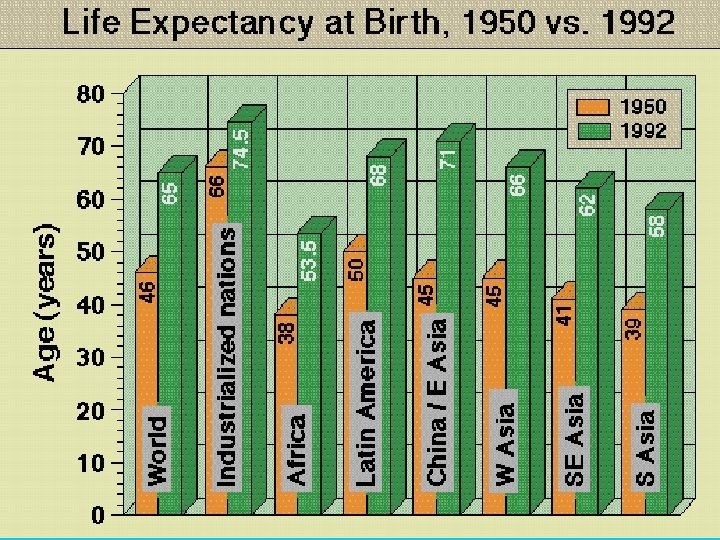
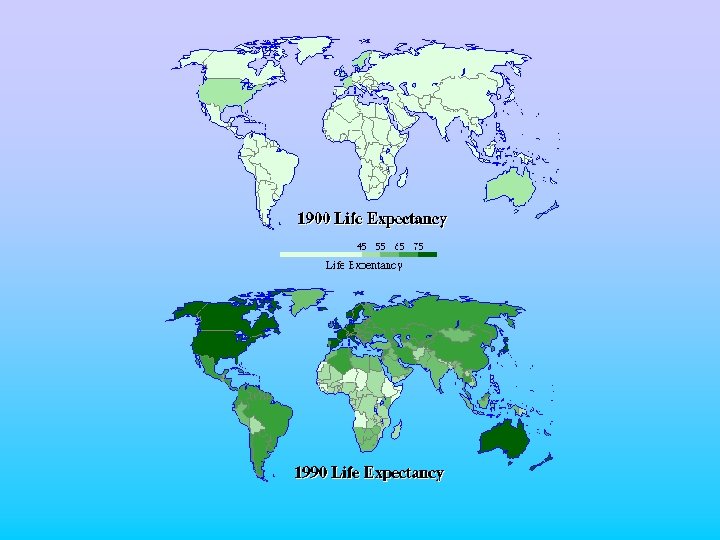
• life expectancy = probable number of years of survival for an individual of a given age

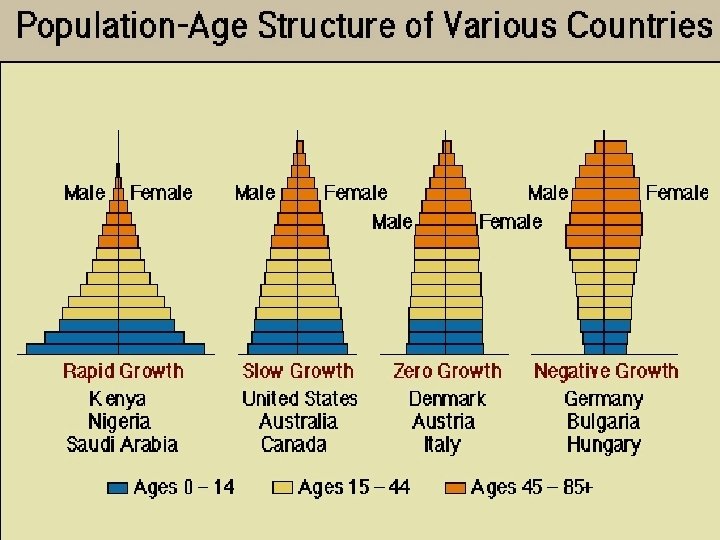
Population Age Structure • age structure diagrams are snapshots of populations at particular moment • expanding population- lots of new births • stable population- few births • diminishing population- natality<replacement
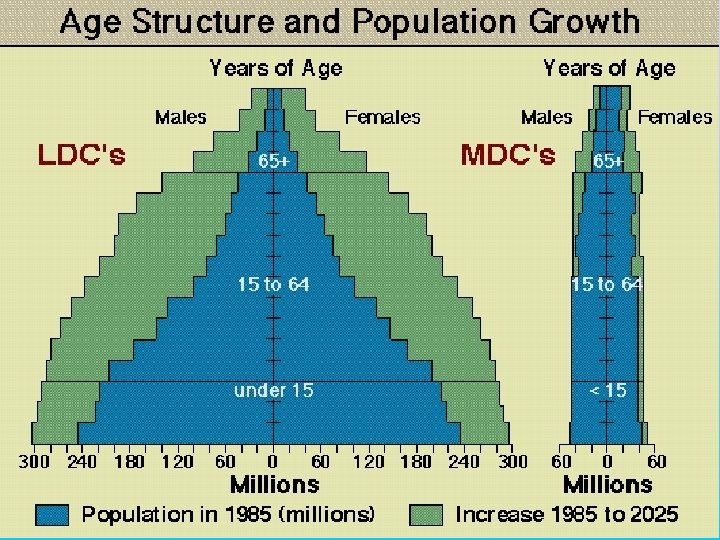
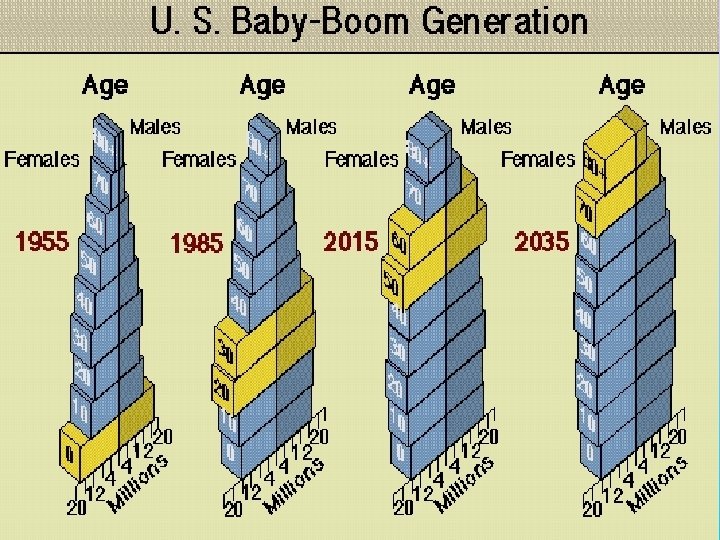

Population Momentum • even once replacement level reached, population will continue to grow 50 -60 years • pyramid shaped age structure means that few move into upper age classes and many moving into reproductive age classes

Demographic Transition High Birth Rates High Death Rates Low Birth Rates Low Death Rates

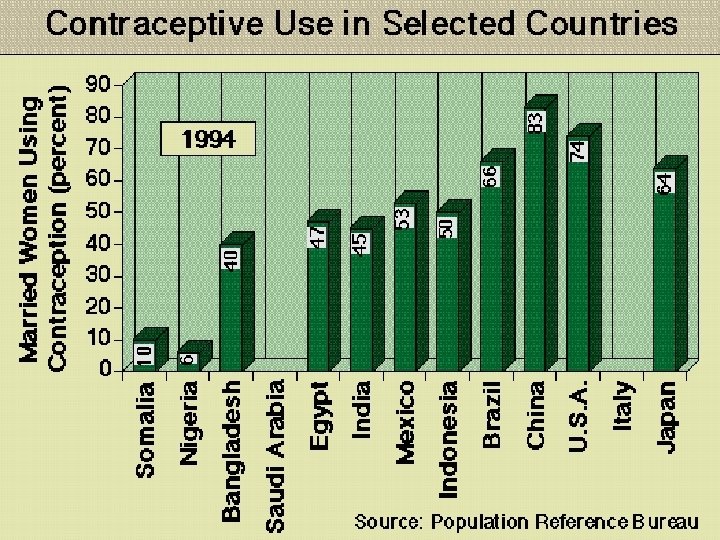
Factors influencing family size • • • security in one’s old age infant and child mortality (overcompensate) economic assets of having children importance of education status of women: education and jobs availability of contraceptives

Birth Reduction Measures • decrease poverty • increase access to health care for infants, children, women • increase access to family planning services • improve status of women – education – job opportunities – increase involvement of men in family-planning and child-rearing
- Slides: 42