
Human population growth 5 POPULATION Why should we
- Slides: 56
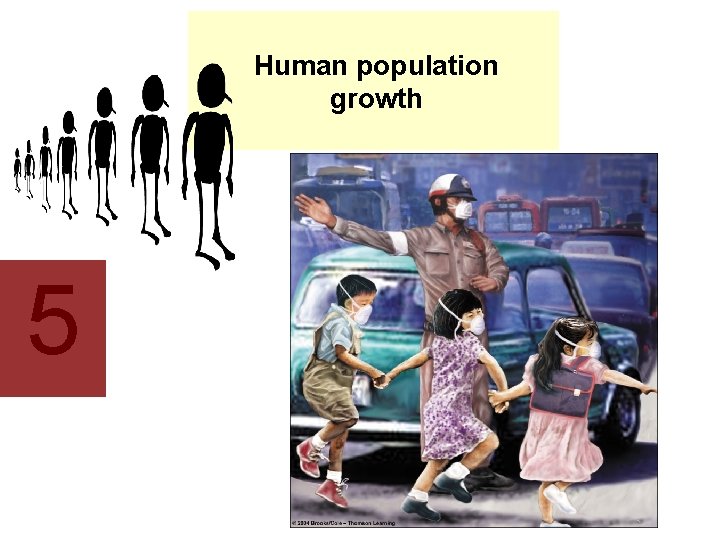
Human population growth 5
POPULATION • Why should we care about population? • Lets do the math. • Who will decide who gets food, water, land, shelter? • What are push & pull factors?
The Demographic Transition Model • • • Scientists in the field of demography, the study of populations, use statistics to learn about population growth. The birthrate is the number of births per year for every 1, 000 people. The death rate is the number of deaths per year for every 1, 000 people. Natural increase, or the growth rate of a population, is the difference between an area’s birthrate and its death rate. Migration, or the movement of people from place to place, must also be considered when examining population changes.
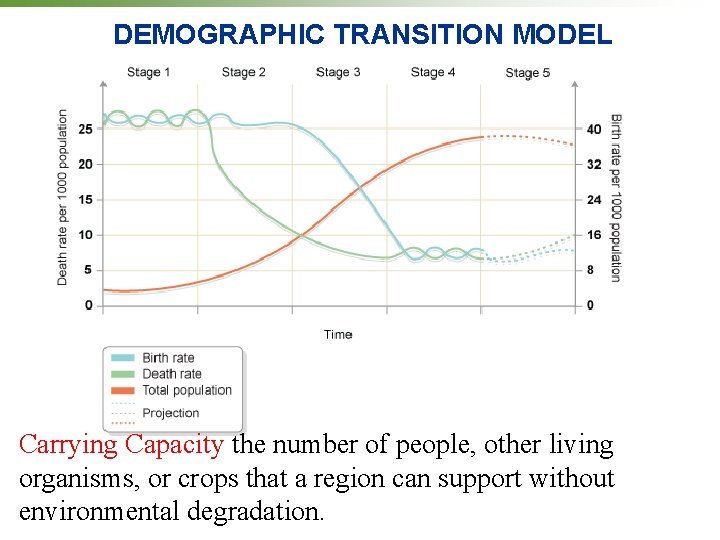
DEMOGRAPHIC TRANSITION MODEL Carrying Capacity the number of people, other living organisms, or crops that a region can support without environmental degradation.
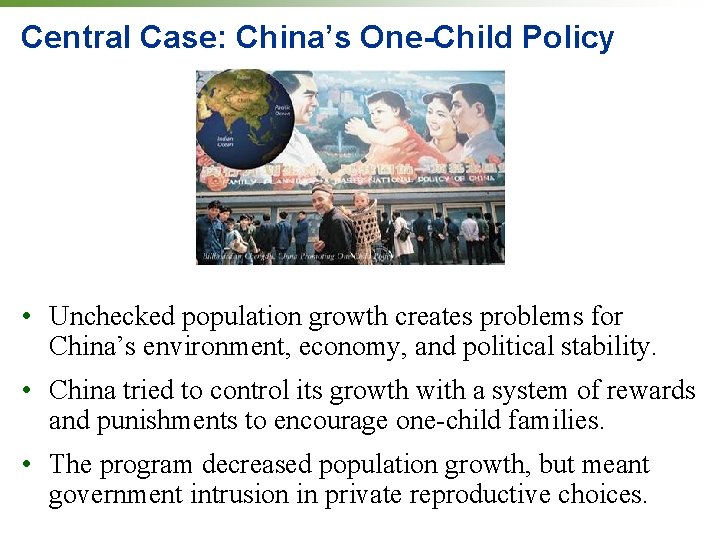
Central Case: China’s One-Child Policy • Unchecked population growth creates problems for China’s environment, economy, and political stability. • China tried to control its growth with a system of rewards and punishments to encourage one-child families. • The program decreased population growth, but meant government intrusion in private reproductive choices.
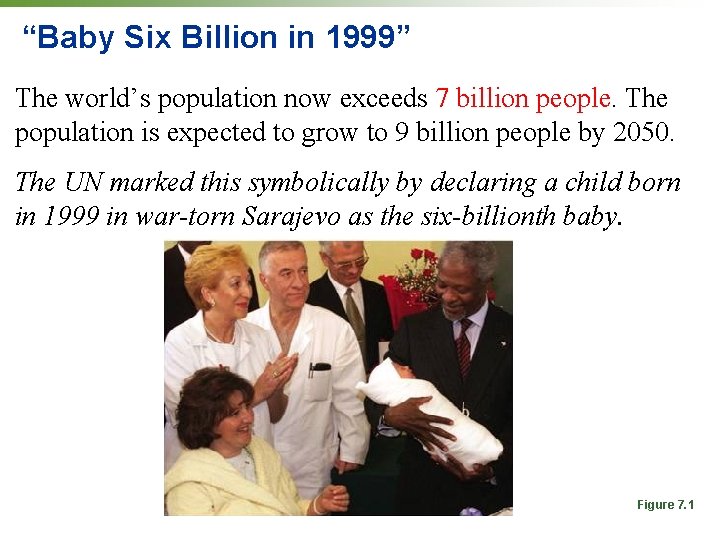
“Baby Six Billion in 1999” The world’s population now exceeds 7 billion people. The population is expected to grow to 9 billion people by 2050. The UN marked this symbolically by declaring a child born in 1999 in war-torn Sarajevo as the six-billionth baby. Figure 7. 1
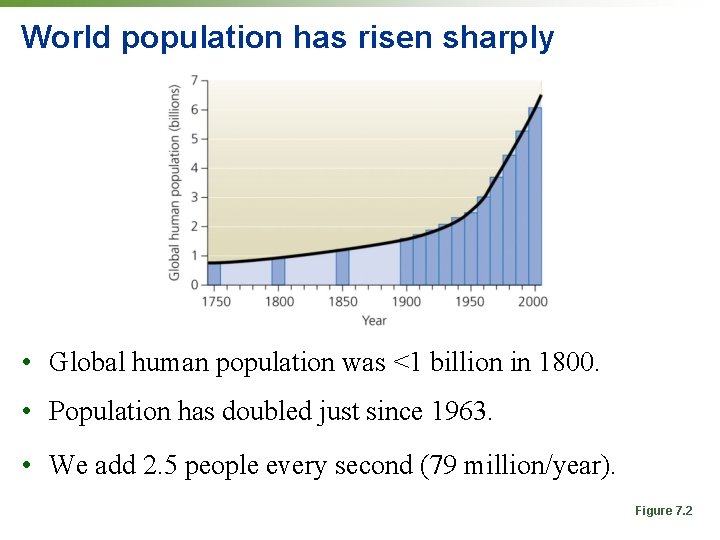
World population has risen sharply • Global human population was <1 billion in 1800. • Population has doubled just since 1963. • We add 2. 5 people every second (79 million/year). Figure 7. 2
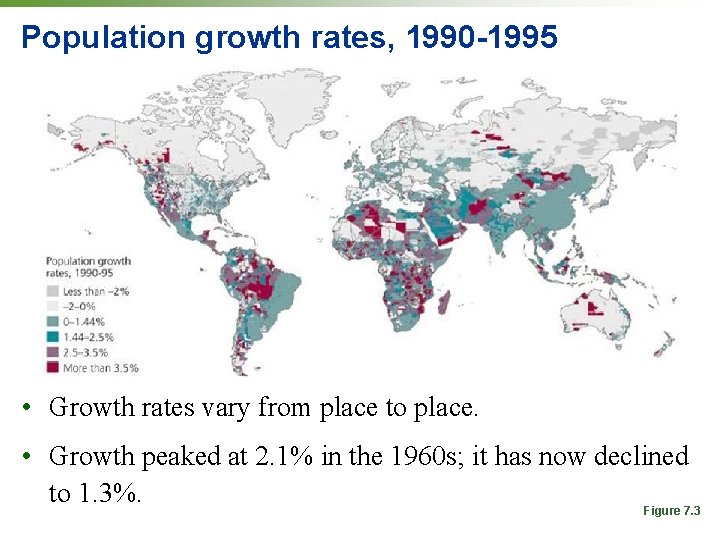
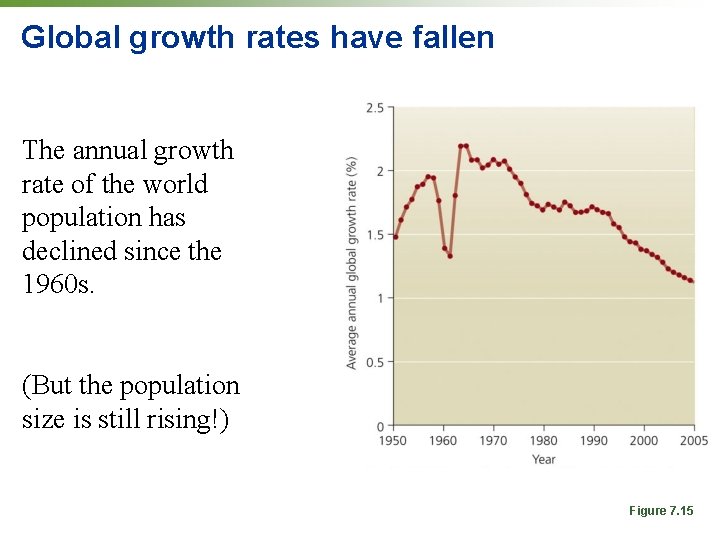
Population growth rates, 1990 -1995 • Growth rates vary from place to place. • Growth peaked at 2. 1% in the 1960 s; it has now declined to 1. 3%. Figure 7. 3
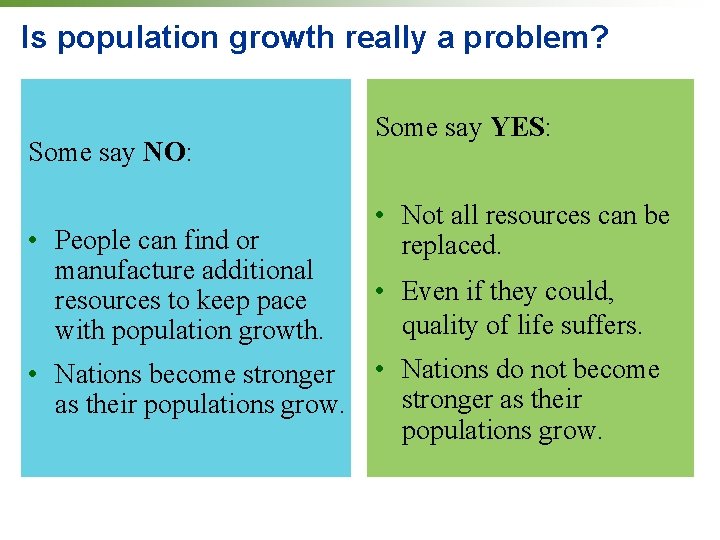
Is population growth really a problem? Some say NO: • People can find or manufacture additional resources to keep pace with population growth. • Nations become stronger as their populations grow. Some say YES: • Not all resources can be replaced. • Even if they could, quality of life suffers. • Nations do not become stronger as their populations grow.
Key Words age pyramid age structure AIDS epidemic demographic transition demography doubling time ecological footprint family planning greater-than-exponential growth rate human immunodeficiency virus/acquired immunodeficiency syndrome (HIV/AIDS) industrial stage IPAT model life expectancy population density population distribution population size post-industrial stage pre-industrial stage replacement fertility sex ratio total fertility rate (TFR) transitional stage
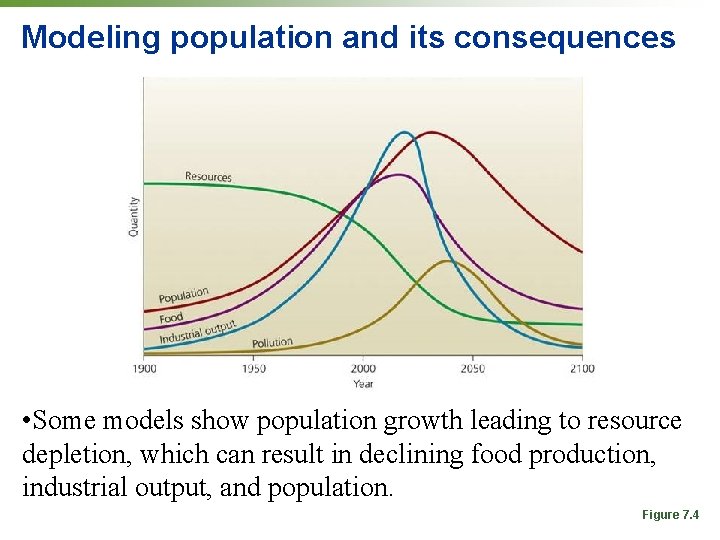
Modeling population and its consequences • Some models show population growth leading to resource depletion, which can result in declining food production, industrial output, and population. Figure 7. 4
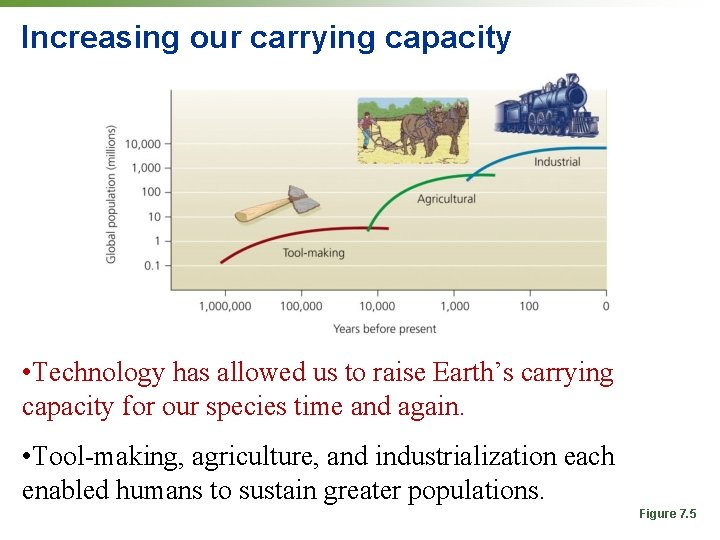
Increasing our carrying capacity • Technology has allowed us to raise Earth’s carrying capacity for our species time and again. • Tool-making, agriculture, and industrialization each enabled humans to sustain greater populations. Figure 7. 5
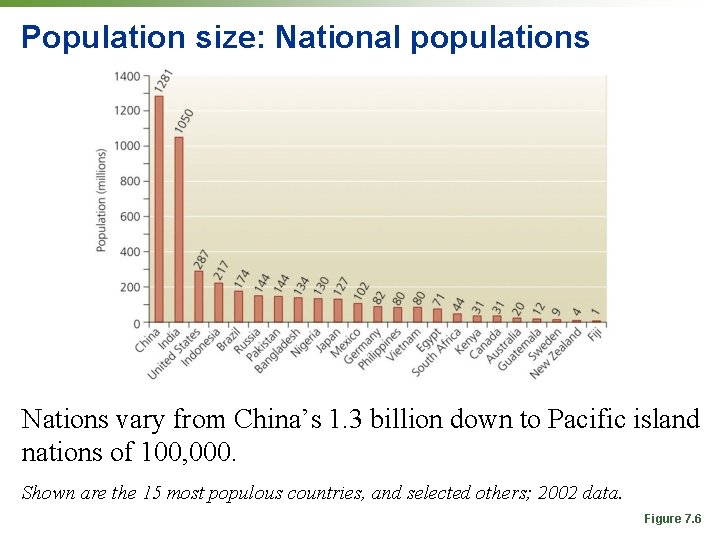
Population size: National populations Nations vary from China’s 1. 3 billion down to Pacific island nations of 100, 000. Shown are the 15 most populous countries, and selected others; 2002 data. Figure 7. 6
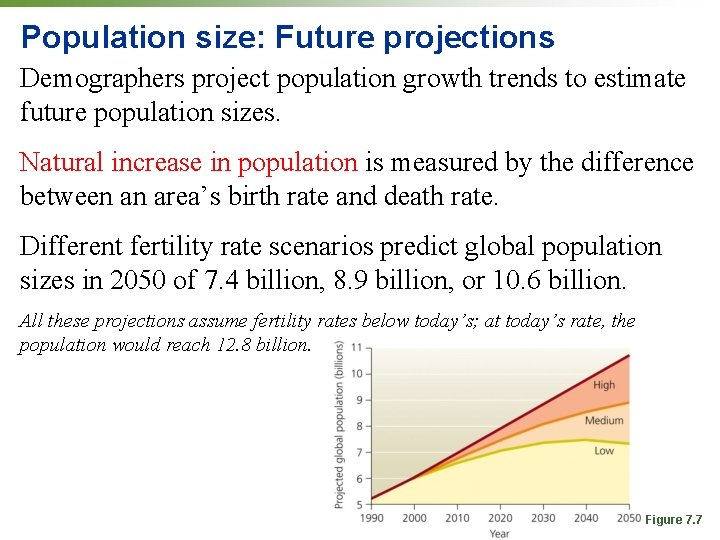
Population size: Future projections Demographers project population growth trends to estimate future population sizes. Natural increase in population is measured by the difference between an area’s birth rate and death rate. Different fertility rate scenarios predict global population sizes in 2050 of 7. 4 billion, 8. 9 billion, or 10. 6 billion. All these projections assume fertility rates below today’s; at today’s rate, the population would reach 12. 8 billion. Figure 7. 7
Population density and distribution Population density is the average number of people living on a square mile or square kilometer of land. Population distribution the variations in population that occur across a country, a continent, or the world.
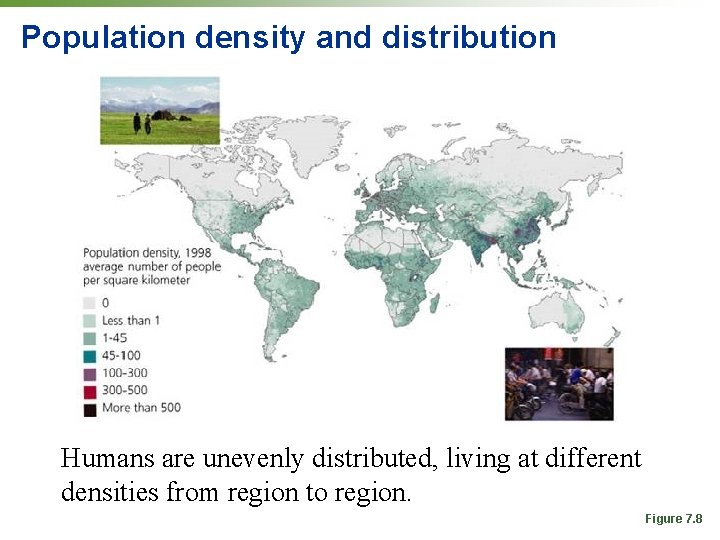
Population density and distribution Humans are unevenly distributed, living at different densities from region to region. Figure 7. 8
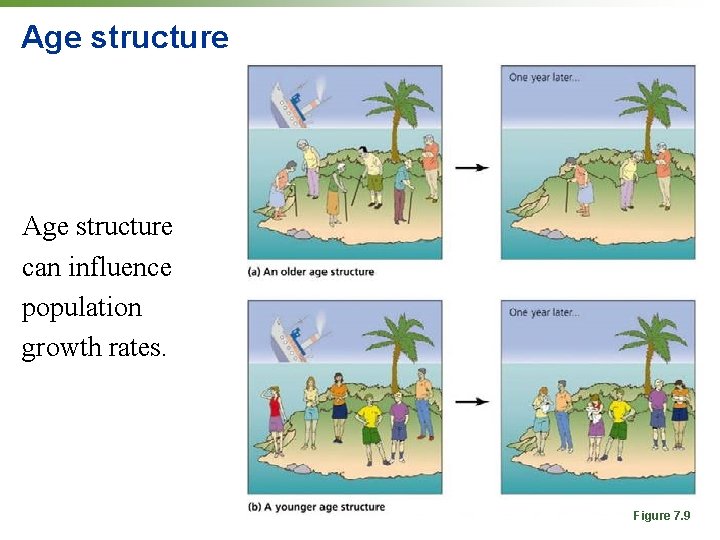
Age structure can influence population growth rates. Figure 7. 9
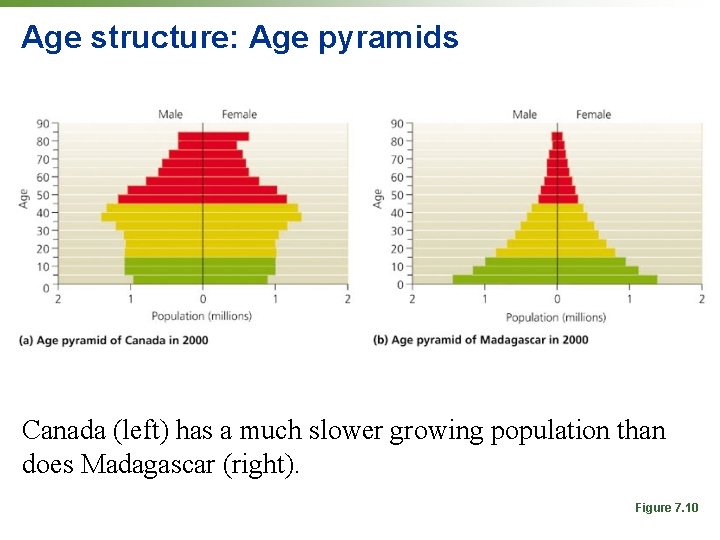
Age structure: Age pyramids Canada (left) has a much slower growing population than does Madagascar (right). Figure 7. 10
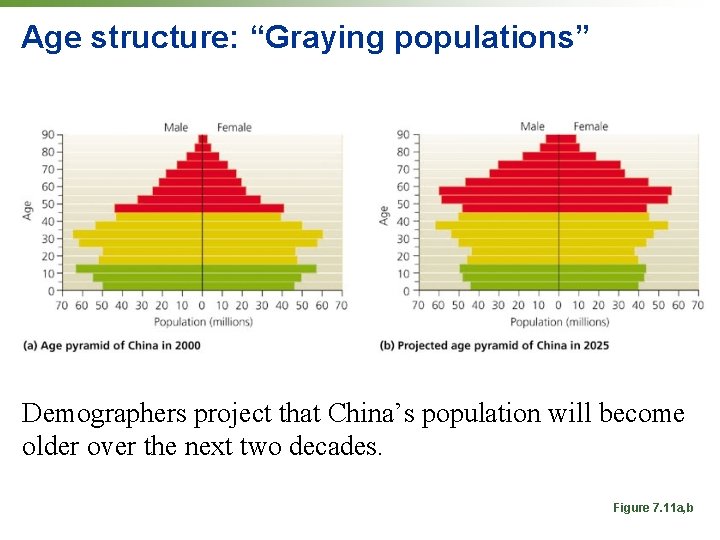
Age structure: “Graying populations” Demographers project that China’s population will become older over the next two decades. Figure 7. 11 a, b
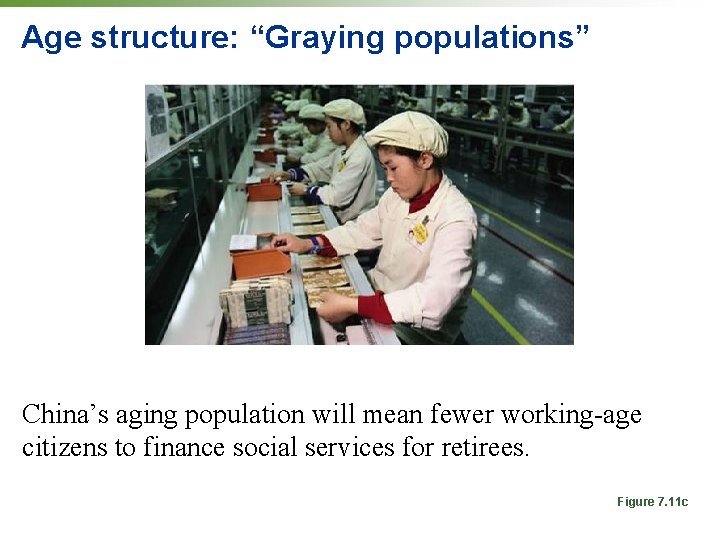
Age structure: “Graying populations” China’s aging population will mean fewer working-age citizens to finance social services for retirees. Figure 7. 11 c
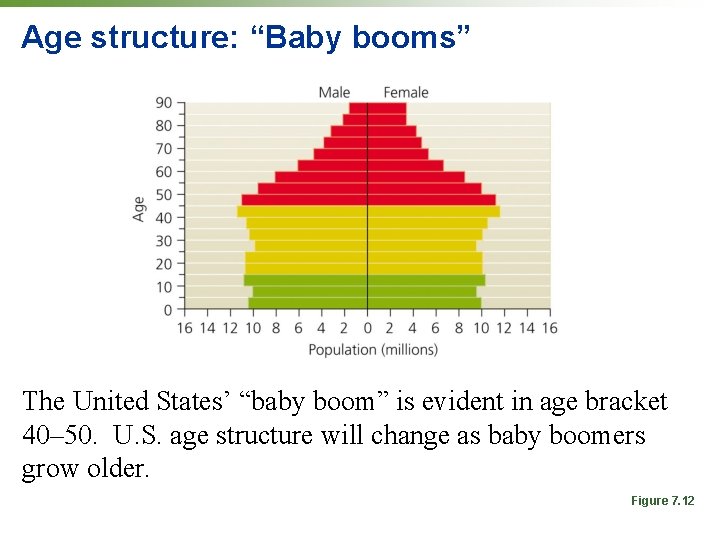
Age structure: “Baby booms” The United States’ “baby boom” is evident in age bracket 40– 50. U. S. age structure will change as baby boomers grow older. Figure 7. 12
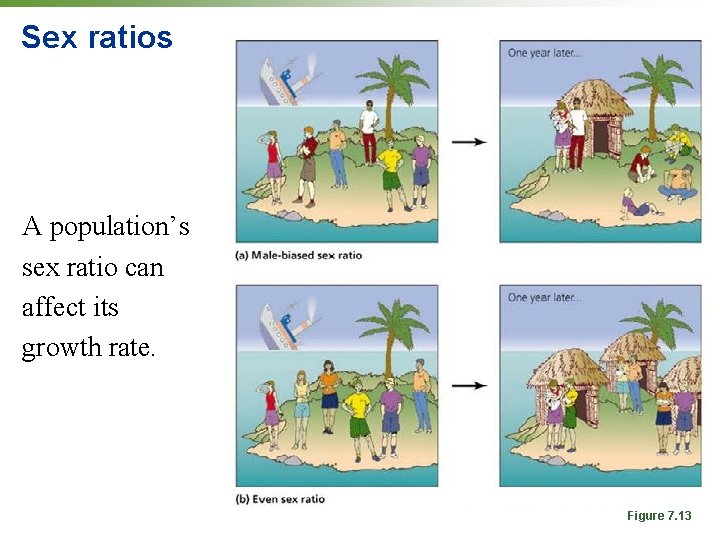
Sex ratios A population’s sex ratio can affect its growth rate. Figure 7. 13
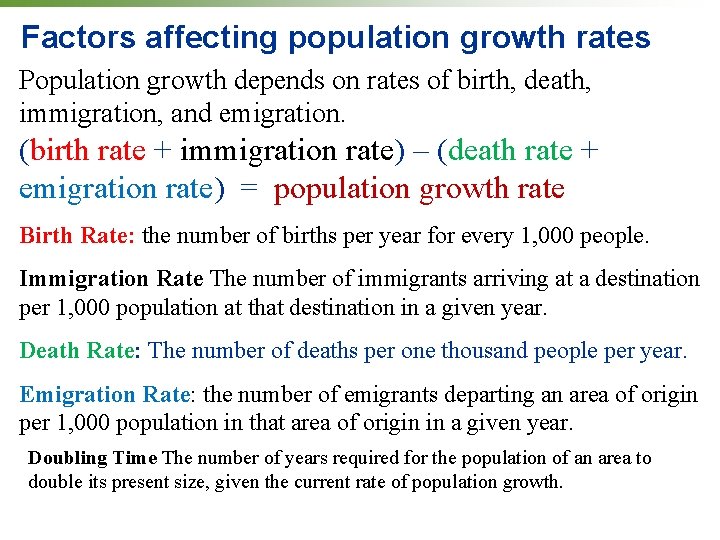
Factors affecting population growth rates Population growth depends on rates of birth, death, immigration, and emigration. (birth rate + immigration rate) – (death rate + emigration rate) = population growth rate Birth Rate: the number of births per year for every 1, 000 people. Immigration Rate The number of immigrants arriving at a destination per 1, 000 population at that destination in a given year. Death Rate: The number of deaths per one thousand people per year. Emigration Rate: the number of emigrants departing an area of origin per 1, 000 population in that area of origin in a given year. Doubling Time The number of years required for the population of an area to double its present size, given the current rate of population growth.
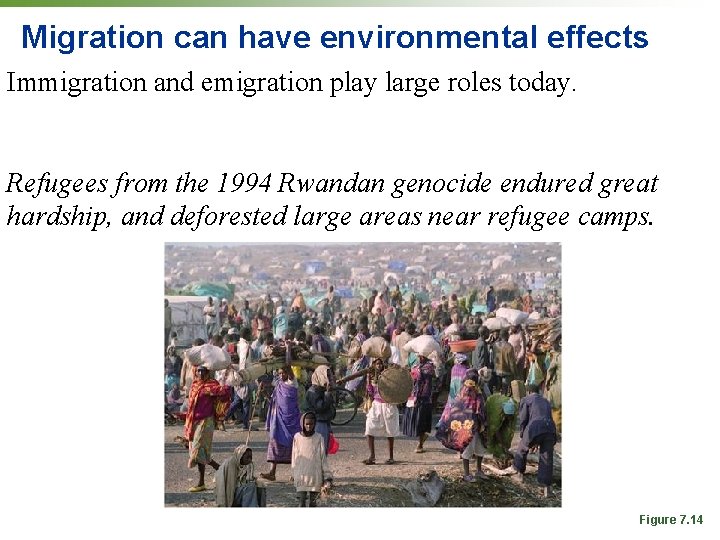
Migration can have environmental effects Immigration and emigration play large roles today. Refugees from the 1994 Rwandan genocide endured great hardship, and deforested large areas near refugee camps. Figure 7. 14
Natural rate of population change Change due to birth and death rates alone, excluding migration. Is often expressed in % per year Natural Increase (or Decrease) The surplus (or deficit) of births over deaths in a population in a given time period.
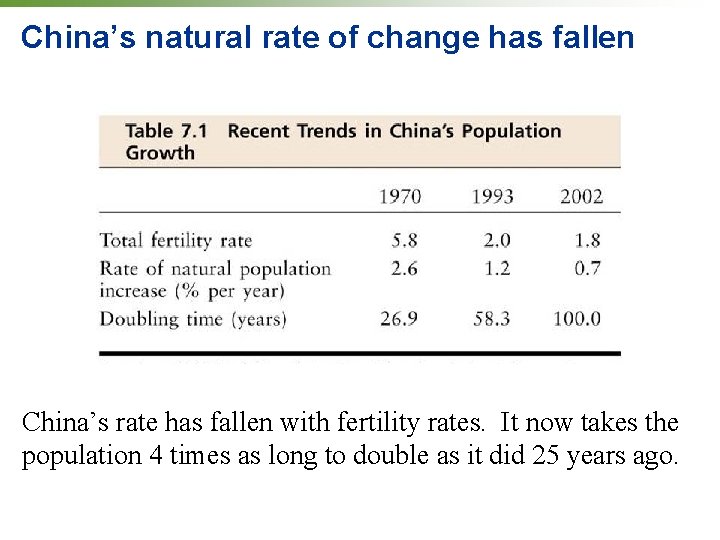
China’s natural rate of change has fallen China’s rate has fallen with fertility rates. It now takes the population 4 times as long to double as it did 25 years ago.
Global growth rates have fallen The annual growth rate of the world population has declined since the 1960 s. (But the population size is still rising!) Figure 7. 15
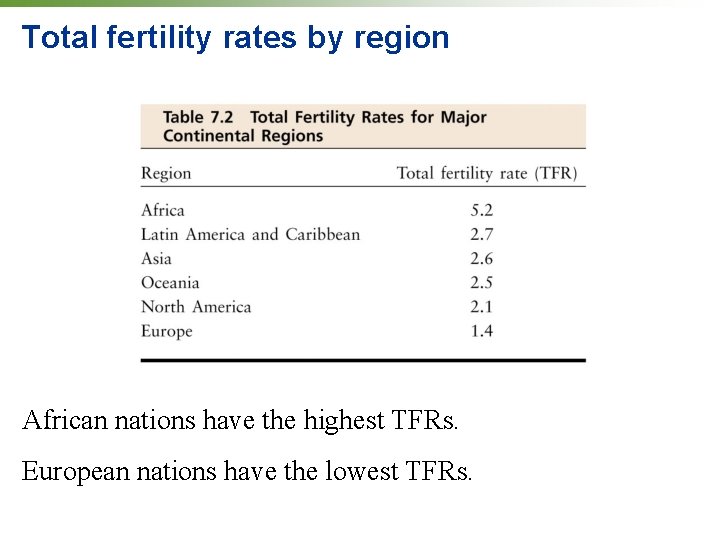
Fertility rates affect population growth rates Total fertility rate (TFR) = average number of children born per woman during her lifetime Replacement fertility = the TFR that keeps population size stable For humans, replacement fertility is about 2. 1.
Total fertility rates by region African nations have the highest TFRs. European nations have the lowest TFRs.
Demographic transition theory Demographic transition = model of economic and cultural change to explain declining death rates, declining birth rates, and rising life expectancies in Western nations as they became industrialized Proposed by F. Notestein in the 1940 s-1950 s
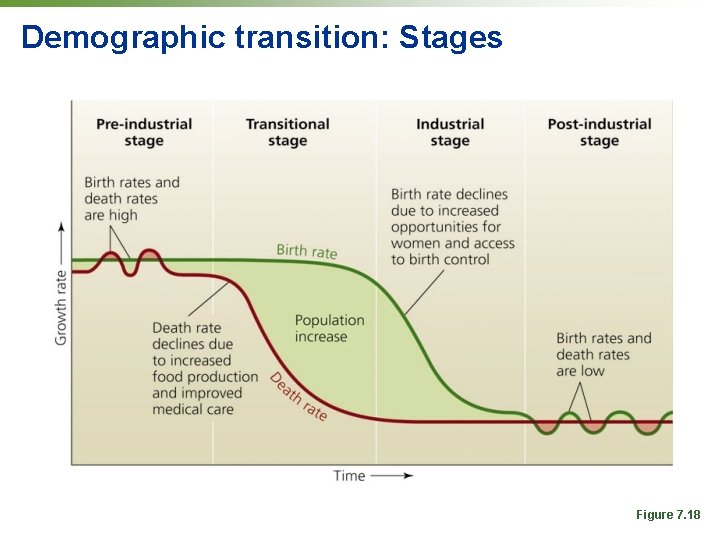
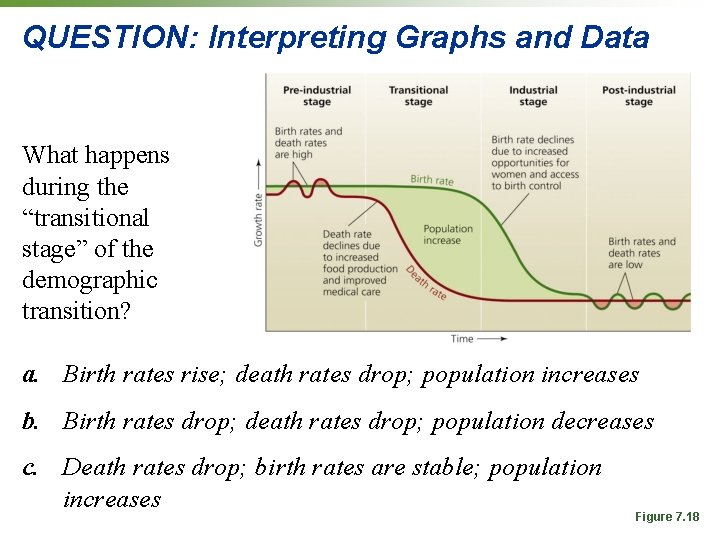
Demographic transition: Stages Figure 7. 18
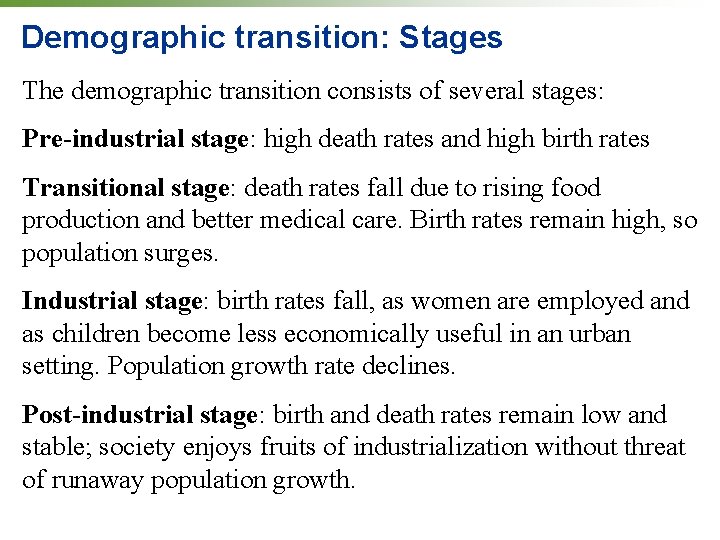
Demographic transition: Stages The demographic transition consists of several stages: Pre-industrial stage: high death rates and high birth rates Transitional stage: death rates fall due to rising food production and better medical care. Birth rates remain high, so population surges. Industrial stage: birth rates fall, as women are employed and as children become less economically useful in an urban setting. Population growth rate declines. Post-industrial stage: birth and death rates remain low and stable; society enjoys fruits of industrialization without threat of runaway population growth.
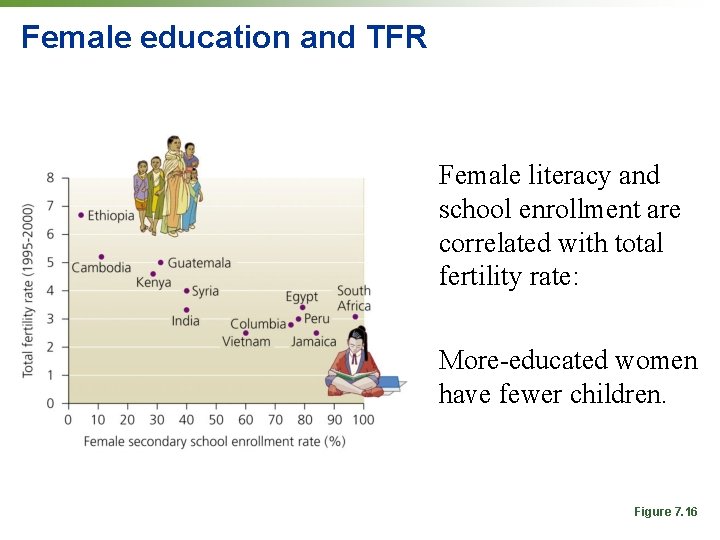
Female education and TFR Female literacy and school enrollment are correlated with total fertility rate: More-educated women have fewer children. Figure 7. 16
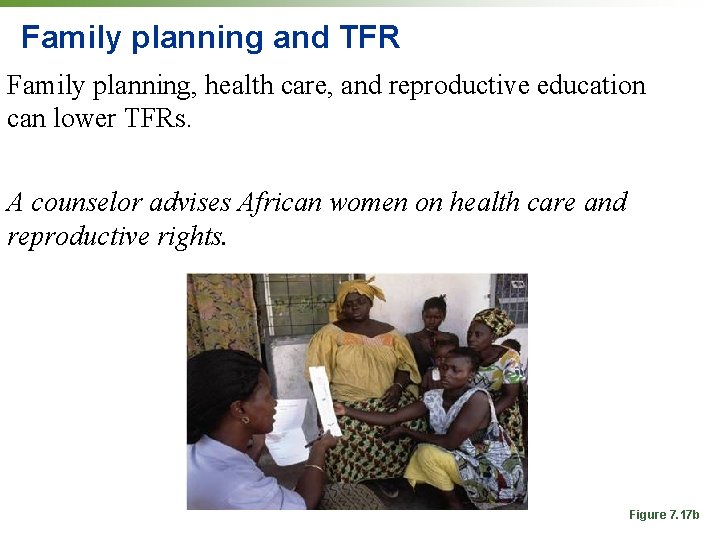
Family planning and TFR Family planning, health care, and reproductive education can lower TFRs. A counselor advises African women on health care and reproductive rights. Figure 7. 17 b
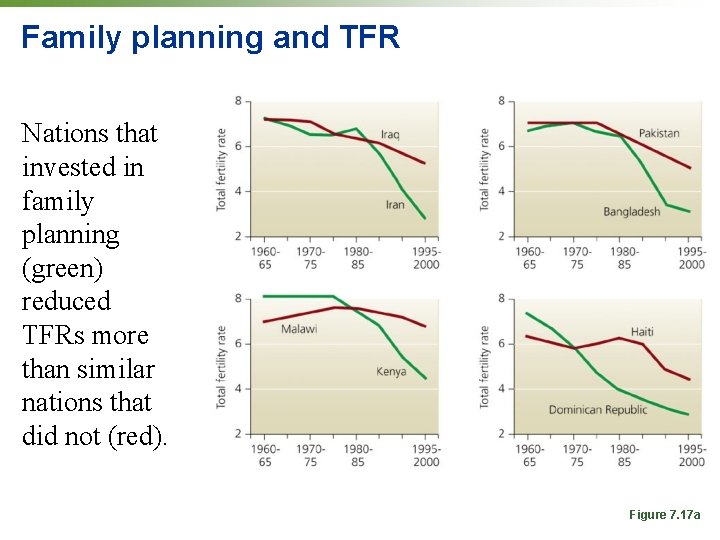
Family planning and TFR Nations that invested in family planning (green) reduced TFRs more than similar nations that did not (red). Figure 7. 17 a
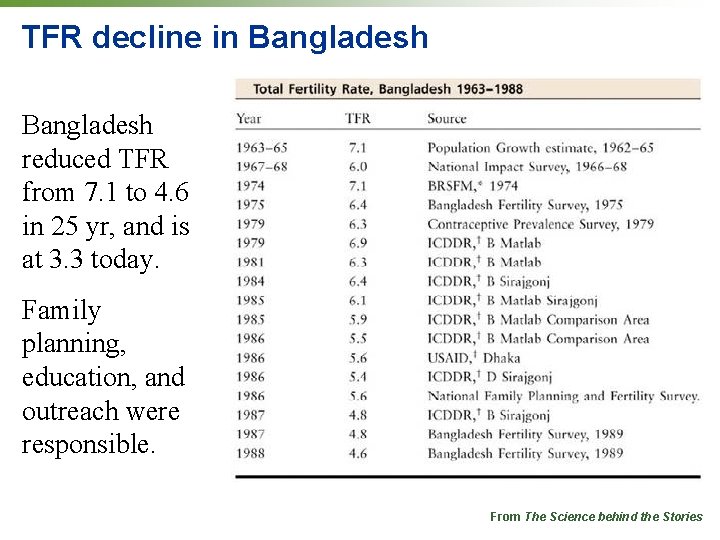
TFR decline in Bangladesh reduced TFR from 7. 1 to 4. 6 in 25 yr, and is at 3. 3 today. Family planning, education, and outreach were responsible. From The Science behind the Stories
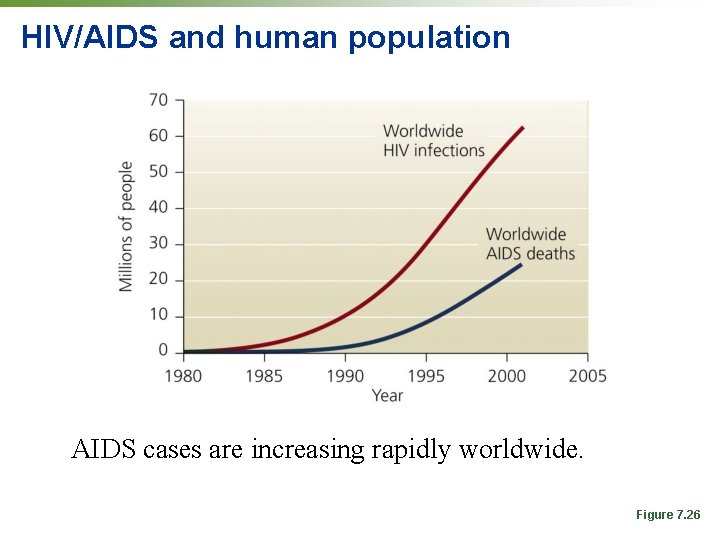
HIV/AIDS and human population AIDS cases are increasing rapidly worldwide. Figure 7. 26
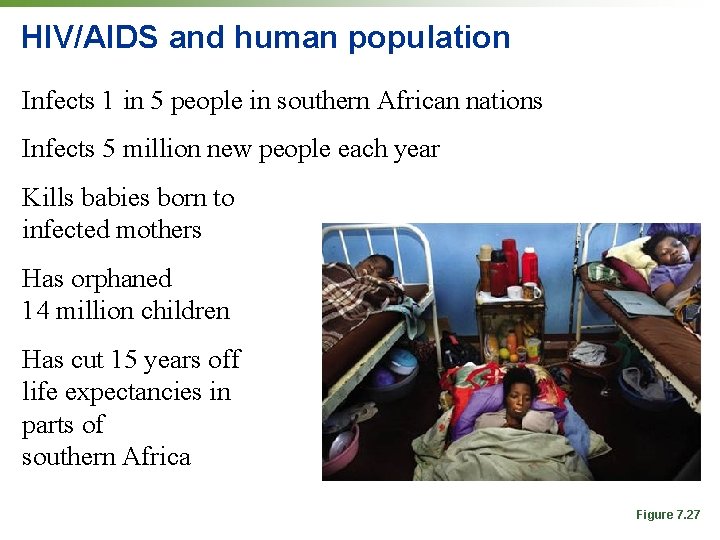
HIV/AIDS and human population Infects 1 in 5 people in southern African nations Infects 5 million new people each year Kills babies born to infected mothers Has orphaned 14 million children Has cut 15 years off life expectancies in parts of southern Africa Figure 7. 27
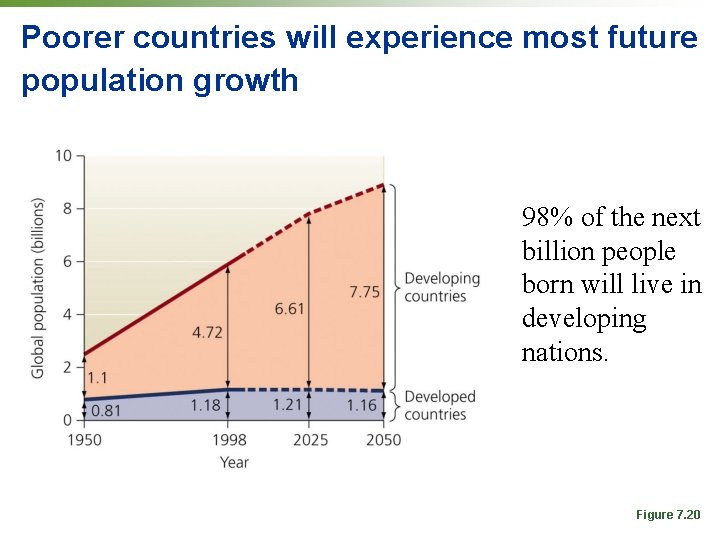
Poorer countries will experience most future population growth 98% of the next billion people born will live in developing nations. Figure 7. 20
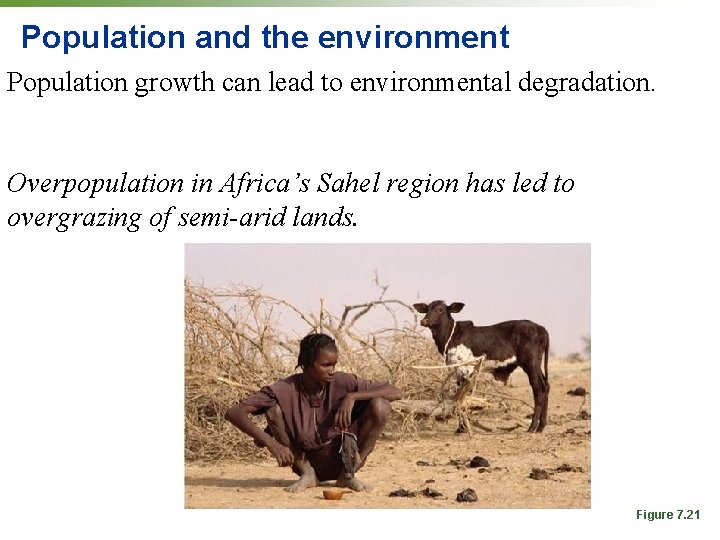
Population and the environment Population growth can lead to environmental degradation. Overpopulation in Africa’s Sahel region has led to overgrazing of semi-arid lands. Figure 7. 21
Affluence and the environment Poverty can lead to environmental degradation… BUT wealth and resource consumption can produce even more severe and far-reaching environmental impacts.
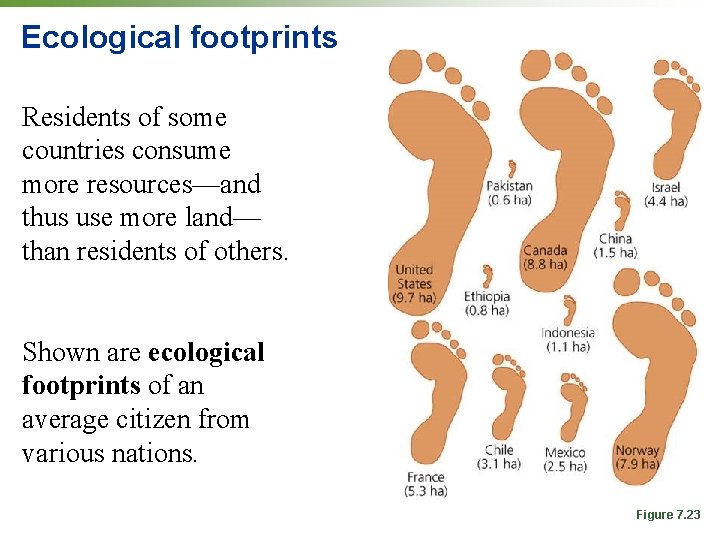
The ecological footprint The cumulative amount of Earth’s surface area required to provide the raw materials a person or a population consumes and to dispose of or recycle the waste that is produced
Ecological footprints Residents of some countries consume more resources—and thus use more land— than residents of others. Shown are ecological footprints of an average citizen from various nations. Figure 7. 23
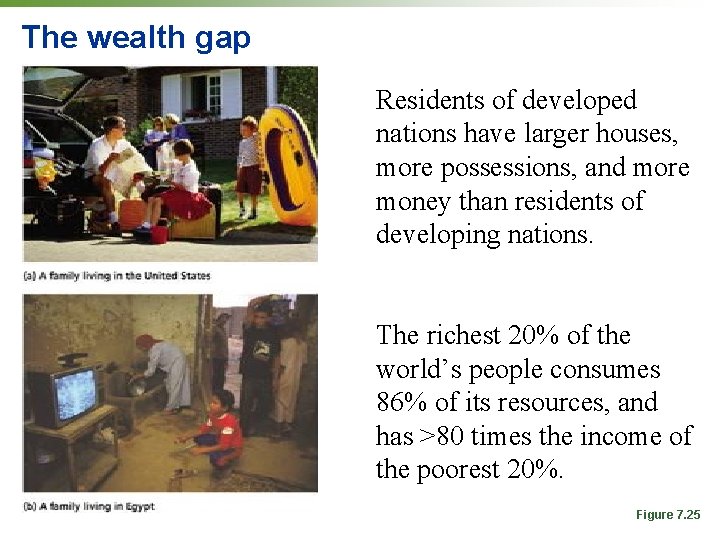
The wealth gap Residents of developed nations have larger houses, more possessions, and more money than residents of developing nations. The richest 20% of the world’s people consumes 86% of its resources, and has >80 times the income of the poorest 20%. Figure 7. 25
Demographic fatigue and demographic transition Many governments of developing countries are experiencing “demographic fatigue, ” unable to meet the social, economic, and environmental challenges imposed by rapid population growth. This raises the question: Will today’s developing countries successfully pass through the demographic transition?
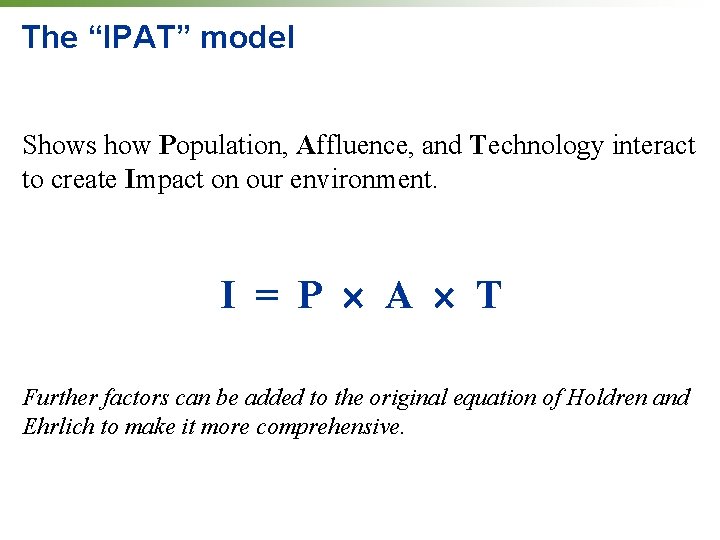
The “IPAT” model Shows how Population, Affluence, and Technology interact to create Impact on our environment. I = P A T Further factors can be added to the original equation of Holdren and Ehrlich to make it more comprehensive.
Conclusions: Challenges Human population is rising by 79 million people annually. Many more people are born into poverty than into wealth. Rich and poor nations are divided by a “wealth gap. ” HIV/AIDS is taking a heavy toll. Population growth has severe environmental effects.
Conclusions: Solutions Expanding women’s rights is crucial to encourage the demographic transition. Health and reproductive education and counseling can reduce fertility rates. Education, medicine, and policies can lessen the toll of HIV/AIDS. New “green” technologies can help reduce population growth’s environmental impacts.
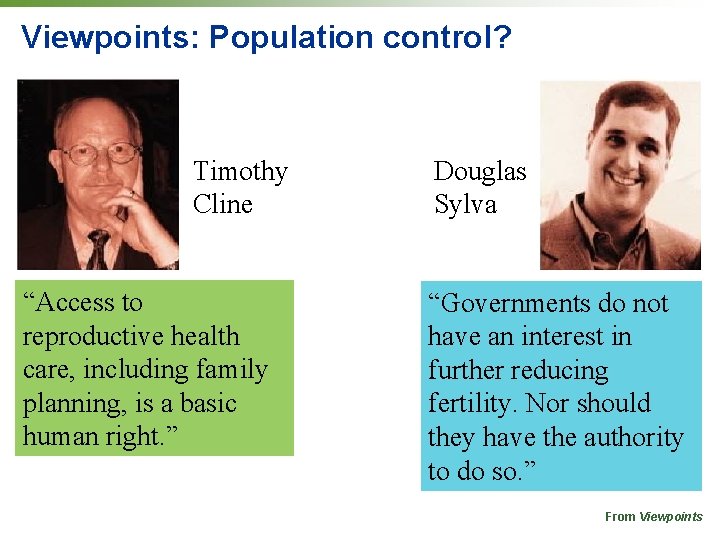
Viewpoints: Population control? Timothy Cline “Access to reproductive health care, including family planning, is a basic human right. ” Douglas Sylva “Governments do not have an interest in further reducing fertility. Nor should they have the authority to do so. ” From Viewpoints
QUESTION: Review Using the I = P A T equation, what would happen if the population doubled? a. Affluence and technology would decline. b. The environment would become more sensitive. c. The environmental impact would double. d. Nothing, because Earth can compensate.
QUESTION: Review What has allowed us to increase Earth’s carrying capacity for our species? a. Agriculture b. Industrialization c. Tool-making d. All of the above
QUESTION: Review Which statement is FALSE? a. The global population growth rate is decreasing. b. The global population is increasing. c. At a TFR of 2. 4, a human population grows. d. Populations with age distributions skewed toward young people grow more slowly.
QUESTION: Review Women who are more educated tend to… ? a. Have higher TFRs. b. Live in developing nations. c. Have fewer children. d. Contract HIV/AIDS.
QUESTION: Weighing the Issues Should the United States fund family planning efforts in other nations? a. Yes, without reservation b. Yes, in nations whose programs it approves c. Only if it can influence the nations’ policies d. Never under any circumstances
QUESTION: Interpreting Graphs and Data What happens during the “transitional stage” of the demographic transition? a. Birth rates rise; death rates drop; population increases b. Birth rates drop; death rates drop; population decreases c. Death rates drop; birth rates are stable; population increases Figure 7. 18
QUESTION: Viewpoints Do you believe that national governments should implement policies, subsidies, or other programs to reduce birth rates? a. No, not at all b. Yes, but only positive incentives for fewer children c. Yes—penalties for too many children d. Yes, both incentives and penalties