
HUMAN GEOGRAPHY SPAINS TERRITORY AND POPULATION 1 SPAINS




















- Slides: 43
HUMAN GEOGRAPHY
SPAIN´S TERRITORY AND POPULATION
1. SPAIN´S TERRITORY • Spain organise its territory according to administrative divisions, set by the 1978 Constitution. • They provide the structure for local and regional public administration. • We have a LOCAL ADMINISTRATION and an AUTONOMOUS ADMINISTRATION.
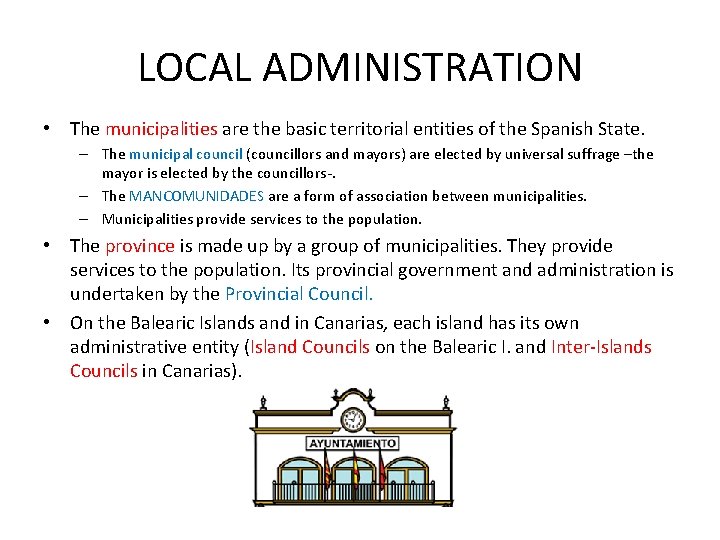
LOCAL ADMINISTRATION • The municipalities are the basic territorial entities of the Spanish State. – The municipal council (councillors and mayors) are elected by universal suffrage –the mayor is elected by the councillors-. – The MANCOMUNIDADES are a form of association between municipalities. – Municipalities provide services to the population. • The province is made up by a group of municipalities. They provide services to the population. Its provincial government and administration is undertaken by the Provincial Council. • On the Balearic Islands and in Canarias, each island has its own administrative entity (Island Councils on the Balearic I. and Inter-Islands Councils in Canarias).
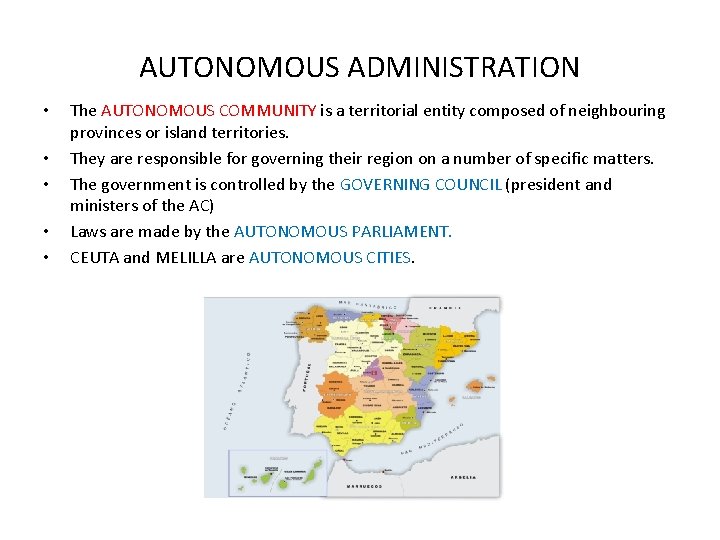
AUTONOMOUS ADMINISTRATION • • • The AUTONOMOUS COMMUNITY is a territorial entity composed of neighbouring provinces or island territories. They are responsible for governing their region on a number of specific matters. The government is controlled by the GOVERNING COUNCIL (president and ministers of the AC) Laws are made by the AUTONOMOUS PARLIAMENT. CEUTA and MELILLA are AUTONOMOUS CITIES.
2. THE SPANISH POPULATION • The sources for its study are: – Censuses, which are made each 10 years – Municipal registers of inhabitants, continuously refreshed • POPULATION DENSITY: this is obtained by dividing a territory´s total population by its area, the result is expressed as number of people per km 2.
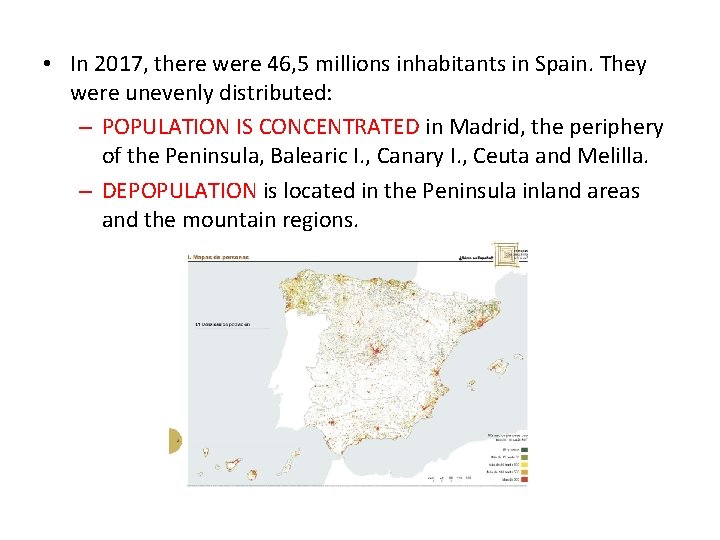
• In 2017, there were 46, 5 millions inhabitants in Spain. They were unevenly distributed: – POPULATION IS CONCENTRATED in Madrid, the periphery of the Peninsula, Balearic I. , Canary I. , Ceuta and Melilla. – DEPOPULATION is located in the Peninsula inland areas and the mountain regions.
3. DEMOGRAPHIC DYNAMISM • Population changes over the course of time, due to two types of movement: – Natural movement: it is the increase or decrease of the population in a place due to natural causes (births and deaths). The difference between them is the rate of natural increase. – Migratory movements are the population movement from one place to another. We have internal migration (rural exodus) and overseas/international migration. The causes are natural, political and economic. The difference between EMIGRATION (the people who move to a new place) and IMMIGRATION (the people who arrive) is the net migration rate.
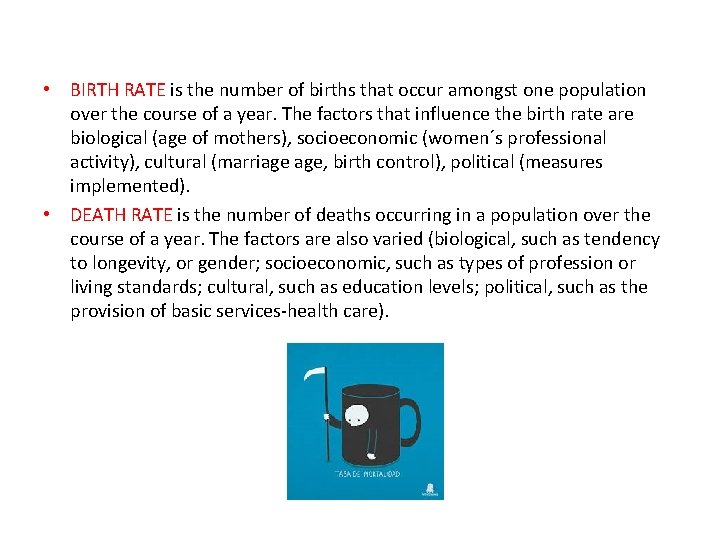
• BIRTH RATE is the number of births that occur amongst one population over the course of a year. The factors that influence the birth rate are biological (age of mothers), socioeconomic (women´s professional activity), cultural (marriage age, birth control), political (measures implemented). • DEATH RATE is the number of deaths occurring in a population over the course of a year. The factors are also varied (biological, such as tendency to longevity, or gender; socioeconomic, such as types of profession or living standards; cultural, such as education levels; political, such as the provision of basic services-health care).
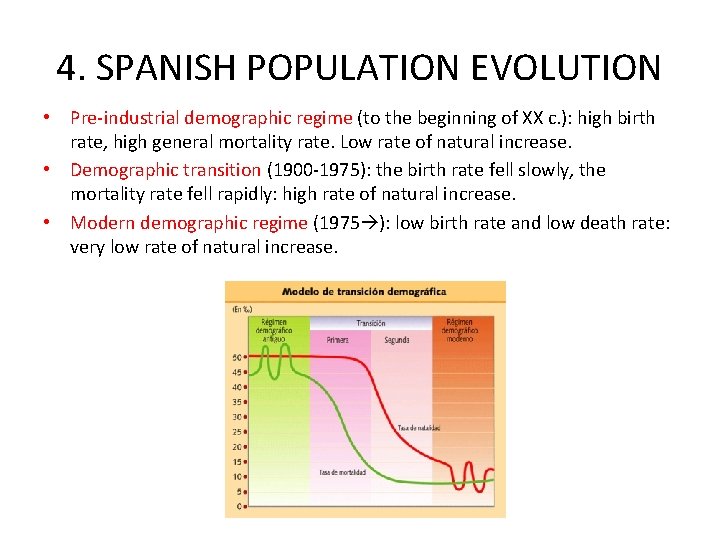
4. SPANISH POPULATION EVOLUTION • Pre-industrial demographic regime (to the beginning of XX c. ): high birth rate, high general mortality rate. Low rate of natural increase. • Demographic transition (1900 -1975): the birth rate fell slowly, the mortality rate fell rapidly: high rate of natural increase. • Modern demographic regime (1975 ): low birth rate and low death rate: very low rate of natural increase.
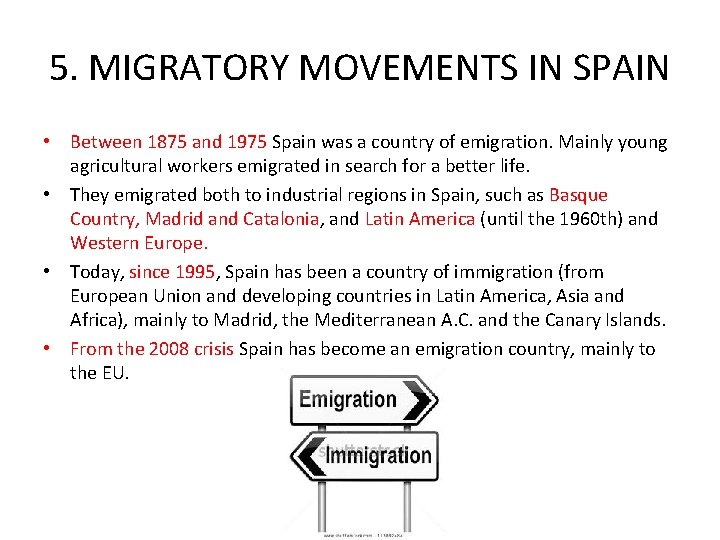
5. MIGRATORY MOVEMENTS IN SPAIN • Between 1875 and 1975 Spain was a country of emigration. Mainly young agricultural workers emigrated in search for a better life. • They emigrated both to industrial regions in Spain, such as Basque Country, Madrid and Catalonia, and Latin America (until the 1960 th) and Western Europe. • Today, since 1995, Spain has been a country of immigration (from European Union and developing countries in Latin America, Asia and Africa), mainly to Madrid, the Mediterranean A. C. and the Canary Islands. • From the 2008 crisis Spain has become an emigration country, mainly to the EU.
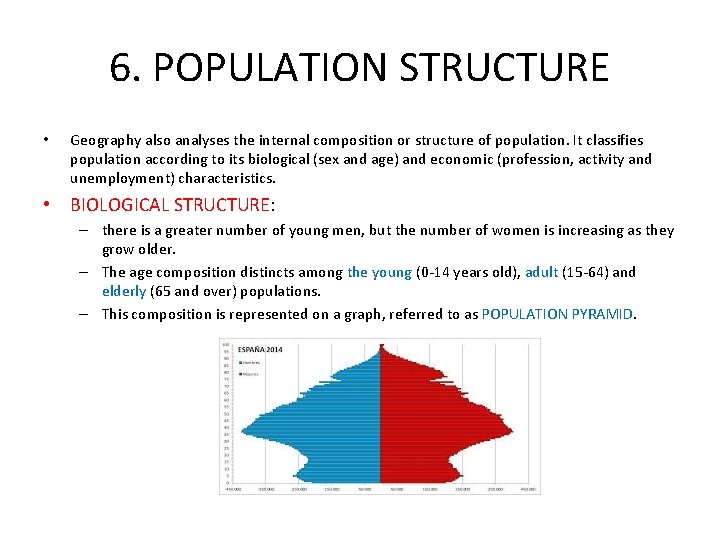
6. POPULATION STRUCTURE • Geography also analyses the internal composition or structure of population. It classifies population according to its biological (sex and age) and economic (profession, activity and unemployment) characteristics. • BIOLOGICAL STRUCTURE: – there is a greater number of young men, but the number of women is increasing as they grow older. – The age composition distincts among the young (0 -14 years old), adult (15 -64) and elderly (65 and over) populations. – This composition is represented on a graph, referred to as POPULATION PYRAMID.
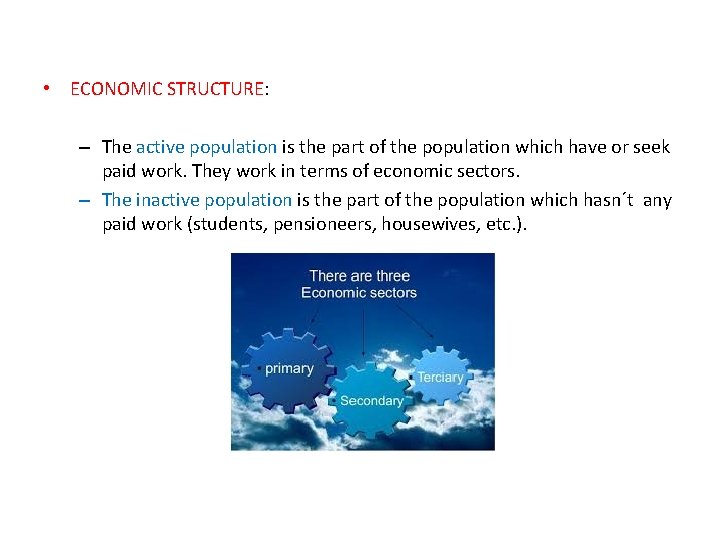
• ECONOMIC STRUCTURE: – The active population is the part of the population which have or seek paid work. They work in terms of economic sectors. – The inactive population is the part of the population which hasn´t any paid work (students, pensioneers, housewives, etc. ).
CITIES IN SPAIN
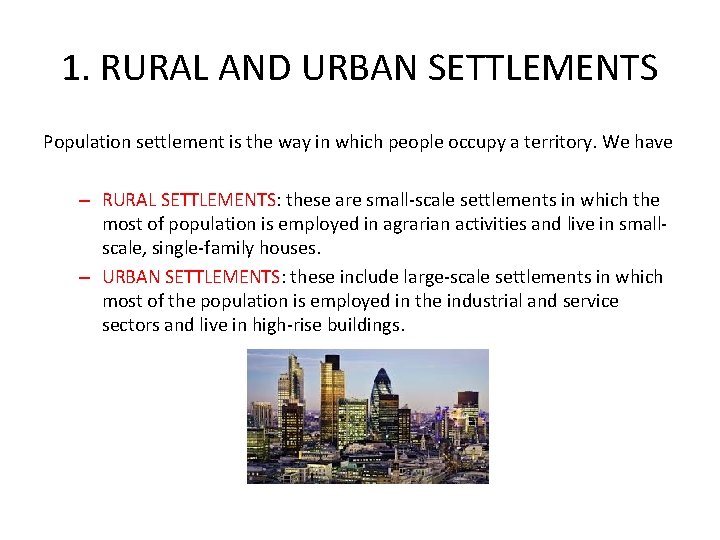
1. RURAL AND URBAN SETTLEMENTS Population settlement is the way in which people occupy a territory. We have – RURAL SETTLEMENTS: these are small-scale settlements in which the most of population is employed in agrarian activities and live in smallscale, single-family houses. – URBAN SETTLEMENTS: these include large-scale settlements in which most of the population is employed in the industrial and service sectors and live in high-rise buildings.
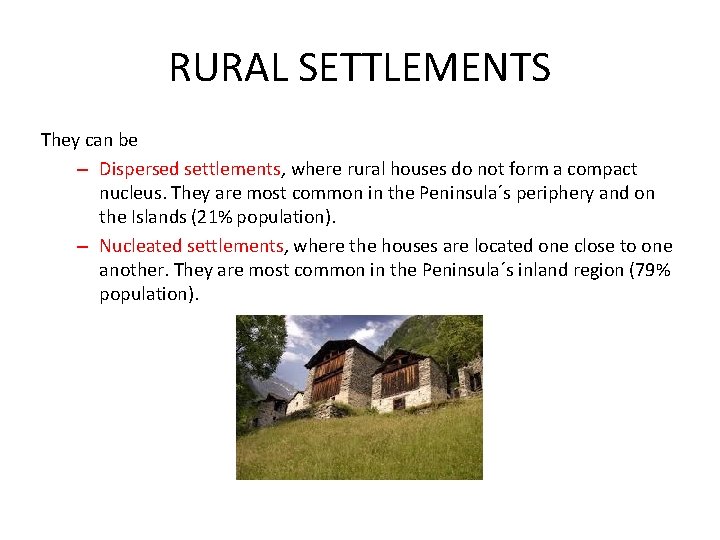
RURAL SETTLEMENTS They can be – Dispersed settlements, where rural houses do not form a compact nucleus. They are most common in the Peninsula´s periphery and on the Islands (21% population). – Nucleated settlements, where the houses are located one close to one another. They are most common in the Peninsula´s inland region (79% population).
2. THE URBANISATION PROCESS • To 1800, – Antiquity: the greek and phoenician colonisation created new cities which added to the previous ones (Tartessos and El Argar Cultures). This new cities had a grid plan. Also the romans created new cities with the same pattern. – Middle Ages: the muslims transformed the old roman cities and created new ones. The christians also created new cities along the Camino de Santiago. This cities were irregular and included singular buildings (mosques, cathedrals, souks, etc. ) – Early Modern Period: Madrid, as the new capital, expanded; aso did the commercial coastal cities (Sevilla). A main square and public buildings added to the old singular buildings.
• After 1800, – Industrial revolution made cities increase in size; the walls were pulled down and many proletarian quarters were created. – Enlargement plans were made for the bourgeoisie, with better houses and services. – Between 1970 and 1980 the large cities were gradually surrounded by extensive peripheral zones filled with residential neighbourhoods, industrial states and urban facilities. Shantytowns also emerged. – Since 1980, the growth or urban population has slowed due to the demographic drop and the stop of rural exodus.
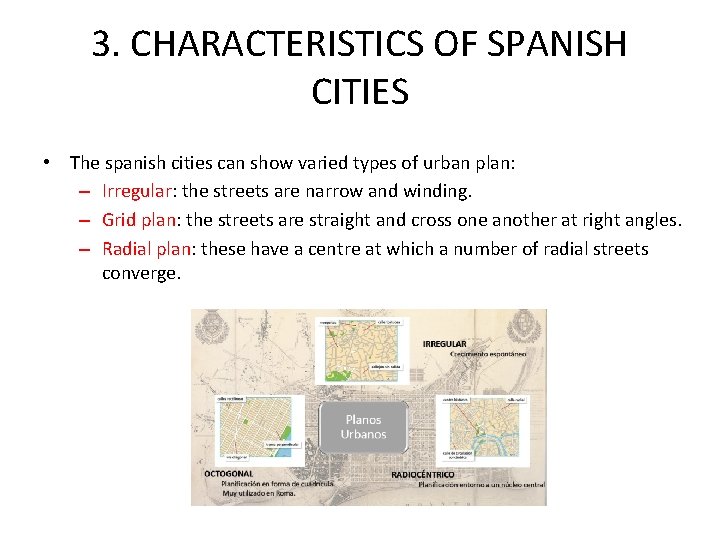
3. CHARACTERISTICS OF SPANISH CITIES • The spanish cities can show varied types of urban plan: – Irregular: the streets are narrow and winding. – Grid plan: the streets are straight and cross one another at right angles. – Radial plan: these have a centre at which a number of radial streets converge.
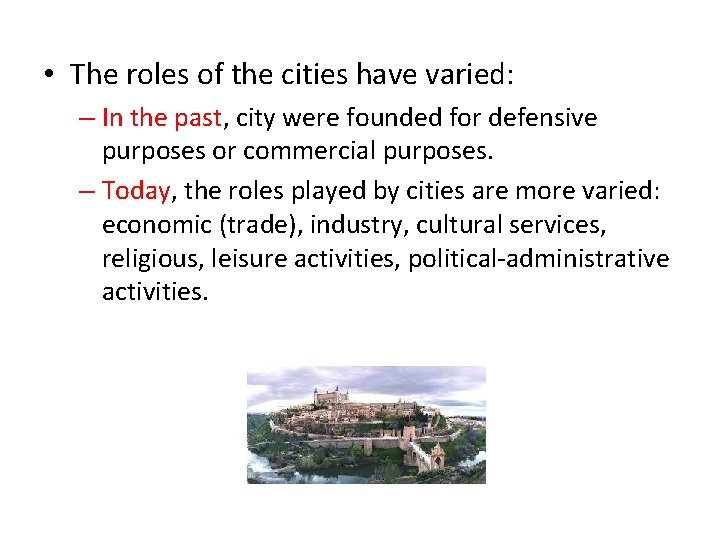
• The roles of the cities have varied: – In the past, city were founded for defensive purposes or commercial purposes. – Today, the roles played by cities are more varied: economic (trade), industry, cultural services, religious, leisure activities, political-administrative activities.
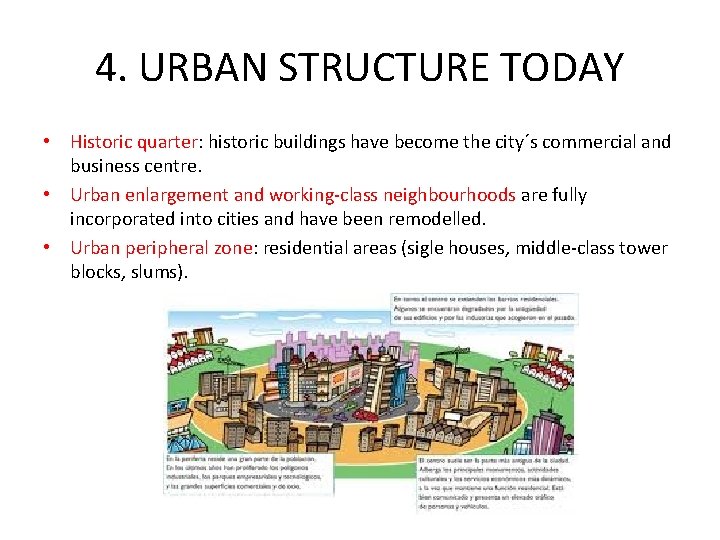
4. URBAN STRUCTURE TODAY • Historic quarter: historic buildings have become the city´s commercial and business centre. • Urban enlargement and working-class neighbourhoods are fully incorporated into cities and have been remodelled. • Urban peripheral zone: residential areas (sigle houses, middle-class tower blocks, slums).
5. URBAN AGGLOMERATIONS They are the linking-up of several towns or cities: – Metropolitan areas are created by a large city linking up with nearby villages and towns. – Conurbations are created by the growth of various cities of similar importance that join together. – Megalopolis are created when an agglomeration exceeds a regional scale.
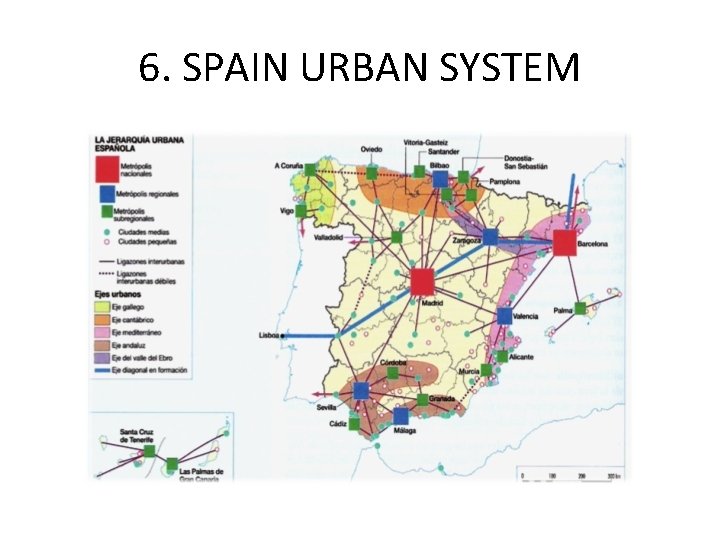
6. SPAIN URBAN SYSTEM