Huma n grow th Past P resent expansion


 Global population was")


 Figure 11 -5, p. 247) •")


")

")

 • Developing, Developed")


- Slides: 27
Huma n grow th Past, P resent /expansion: , Futu re Chapter 11 The Human Population and it’s impact
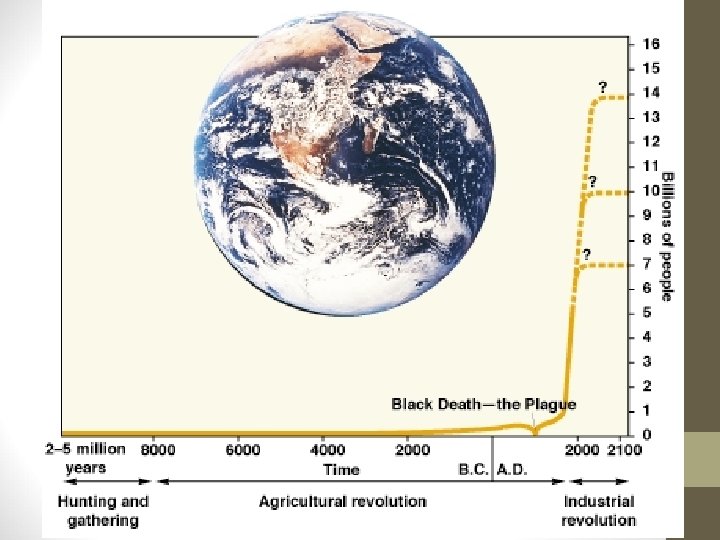
How Has the Human Population Grown Historically A. Early Hunter Gatherers 1. B. Nomadic, With a Strong Sense of the Earth Rise of Agriculture 1. Necessary for Survival a. b. Animals became extinct via predation and altered habitat Humans began to cultivate own food
C. Agriculture Gives Rise to Cities 1. Food Produced in Country, Consumed in City a. b. 2. 3. Food wastes are no longer returned to soil Soil becomes less productive Waste of Populations Concentrated in Cities Population Control in Medieval Societies a. b. Infanticide Plagues D. Industrialization 1. View of Children During Early Phases of Industrial Growth a. b. 2. Valued as cheap source of income and cheap labor Exponential growth of populations By 1900 s, Birth Rate in Industrialized World Dropped a. b. c. Rise in standards of living Safe and inexpensive means of birth control introduced Increase in the cost of child rearing
Current World Population • Population Clock Vital Events (per time unit) Global population was 7, 186, 917, 280 On August 21, 2014 at 7: 35 am • The global population grows by: • Nearly 4 persons per seconds • Over 225, 000 persons per day • Over 82 million persons per year
How Much is a Billion? • 1, 000 seconds = 16. 7 minutes • 1 million-s = 16, 677 min = 11. 6 days • 1 billion-s = 11, 574 days = 31. 7 years • How many years would it take to count every person on the planet if you counted at the rate of one person per second? • 1, 000 pennies = ~ 88 ounces = 5. 5 pounds • 1 million pennies = 5, 500 pounds (~1 -Suburban) • 1 billion pennies = 2, 750 tons (~2 Space Shuttles) • 7 billion pennies = ? ? ? Space Shuttles
Uneven distribution of population growth • Developed – 0. 1% per year • Developing – 1. 5% per year Projections in 2050 • 10. 7 billion • World population growth – 1. 19% per year • What does this say about the globe’s status?
• • M I L L I O N S See Figure 11 -3 p. 246 Compare with 11 -6, p. 247
Human Population Dynamics There are just three sources of change in population size: 1. fertility (births) 2. mortality (deaths) • • "natural decrease" refers to population decline resulting from more deaths than births 3. migration • Net migration is the number of immigrants minus emigrants
Population Change • Population Change is calculated by subtracting the number of people leaving a population (death/emigration) from the number entering it (birth/immigration), usually during one year. • Population Change = (B + I) – (D + E) • When is the population increasing, decreasing, and staying the same (ZPG)?
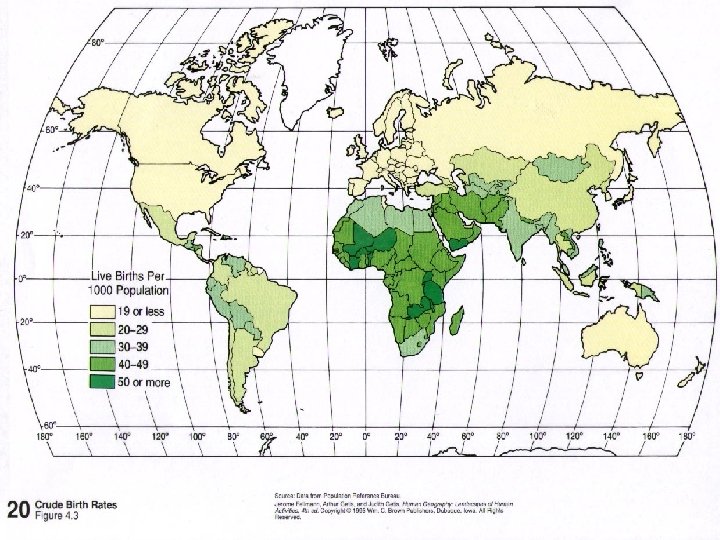
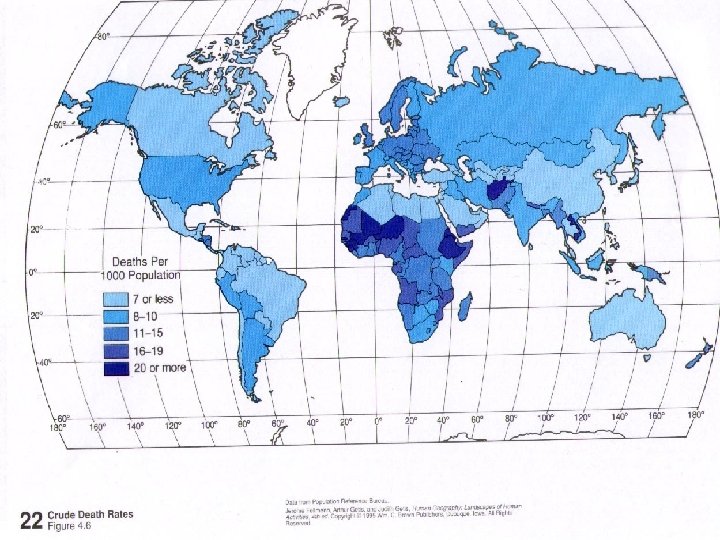
Rates of Global Pop. Change use: International Data Base http: //www. census. gov/ipc/www/idbnew. html, then Online Demographic Aggregation • CBR (crude birth rate) = # births / 1000 population 1990: 24 now: 20. 6 • CDR (crude death rate) = # deaths / 1000 population 1990: 9 now: 8. 8 • Annual rate of natural population change: • = (birth rate-death rate/1000)*100 1963: 39% 1990: 1. 5% now: 1. 19% • This equation excludes migration—why? • growth rates have come down (some)
Factors for population increase • ability to expand into new habitats and climate zones • emergence of modern agriculture • improved health care, sanitation, sources of water
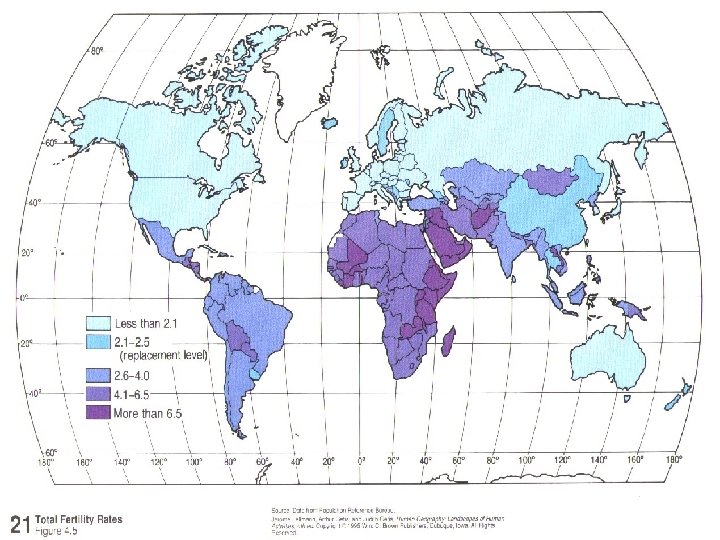
Human Population Dynamics • Total fertility rate (TFR) Figure 11 -5, p. 247) • • The average number of children born to a woman (age 15 -49) Average in developed countries = 1. 5 Average in developing countries = 3. 8 Worldwide 1990: 3. 1 now: 2. 76 • Replacement fertility rate (RFR) • The number of children a couple must have to replace themselves • A TFR of 2. 1 for developed countries with low infant and child mortality rates • Africa RFR = 2. 5 • Reaching RFR does not necessarily mean ZPG will immediately be reached (many future parents are already alive)
Factors affecting fertility rate • Children part of labor force • Urbanization (better access to family planning, unneeded for work – farms) • Cost of raising and educating children • Education/employment of women • Infant mortality rates • Age of marriage • Availability of pension system • Availability of abortions/birth control methods • Religious beliefs/cultural norms, etc. • World TFR has dropped from 5. 7 to 1. 6
Factors affecting death rate • increased life expectancy due to: • Food supplies • Nutrition • Medical/public health technology • Sanitation/hygiene • Safer water
Population Pyramids • • Graphic device: bar graph shows the age and gender composition of a region pre-reproductive, post-reproductive horizontal axis: gender • male: left-hand female: right-hand • absolute number of people or % • vertical axis: age • 5 -year or 10 -year age groups • Population Pyramids on the Web
Population Pyramid with young cohorts
High Growth (Rapid)
Moderate Growth
Zero Growth (Stable)
Negative Growth
Practice • Predict future growth • Rapid, Stable (slow, negative, zero) • Developing, Developed
Tracking the baby-boom generation in the United States
Effects of Population Decline • As percentage of 60+ aged people increases, population begins decline • 60+population increase --> severe economic and social problems because 60+ consume • more medical care • Social Security • costly public services • Labor shortages require automation & immigration