https pubs acs orgdoi10 1021ac s analchem 5


https: //pubs. acs. org/doi/10. 1021/ac s. analchem. 5 b 04221

Analytical Aspects of Nanotoxicology https: //pubs. acs. org/doi/10. 1021/acs. analchem. 5 b 04221

Comparison of DLS- and TRPS-measured size-distributions of H 2 O 2 -oxidized single wall carbon nanohorns prepared in cell culture medium (RPMI medium) supplemented with 10% fetal bovine serum. Sequential dilutions of a 500 μg/m. L stock solution of nanohorns in medium were prepared to achieve the concentrations listed. DLS analysis indicated a single, broad distribution of nanohorn sizes at most nanomaterial concentrations, though interfering signal in small size regimes due to serum proteins was observed at low nanohorn concentrations. In contrast, TRPS resolved two distinct nanohorn populations at all concentrations studied. Measured average nanohorn size varied with concentration when measured by DLS, while TRPS-measured averages showed limited concentration-dependence. ACS Nano 2014, 8 (9), 9003– 9015 (ref 33). Copyright 2014 American Chemical Society.
 Drosophila food with suspended carbon nanomaterials.")
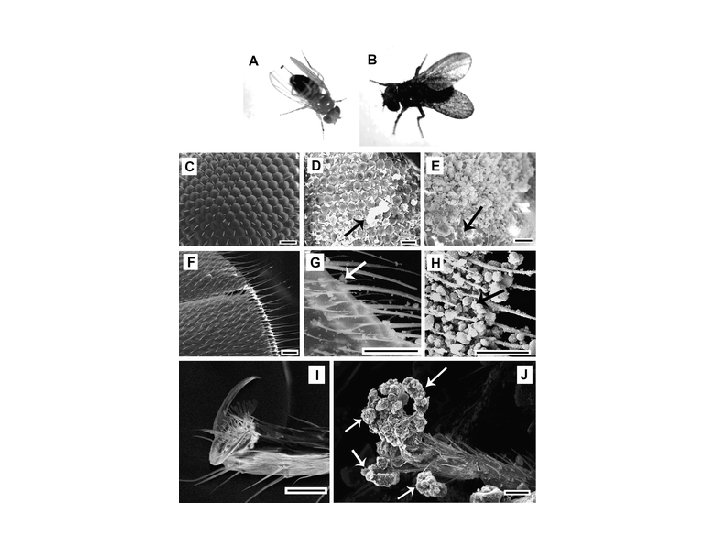
Drosophila larval exposure assay for carbon nanoparticles. (A) Drosophila food with suspended carbon nanomaterials. (B) Evidence that carbon nanomaterials in the food are taken into the larval gut (black areas compared to control). (C) Adult Drosophila hatched from nanomaterial-containing food have sequestered particles in tissues associated with external bristles (darkened abdominal regions, compared to control, most evident in CB sample). (D, E) Thin-section TEM showing C 60 particles dispersed in the Drosophila food at an aggregate size ∼ 1000 times smaller than a larval mouth opening (∼ 20 nm vs >50 μm) permitting nanomaterials to readily enter the larval gut. (F) SEM showing absence of CB particles on the exterior of adult flies hatched from CB-containing food, indicating that the dark patches in C represent sequestration in internal tissue. https: //pubs. acs. org/doi/full/10. 1021/es 901079 z
 and fluorescence-overlay STXM (b) images of mouse alveolar type II epithelial cells")
STXM (a) and fluorescence-overlay STXM (b) images of mouse alveolar type II epithelial cells exposed to Ce. O 2 nanoparticles. Cerium distribution within a cell was observed using STXM by subtracting a scan acquired below the cerium X-ray absorption edge from that acquired above it (a). The cell perimeter and nucleus were observed in scans acquired above the cerium X-ray absorption edge and are indicated with white lines. Cerium absorbance intensity is indicated in the gray scale-bar. Cerium distribution was also observed with respect to fluorescently labeled lysosomes present in the cell cytoplasm (b). Cerium (green, observed using STXM) was observed to be encased by lysosomes (red, observed using structured illumination microscopy) in overlaid STXM and fluorescence images, indicated by white arrows. Biomaterials 2015, 62, 147– 154 (ref 141).

Nanotoxycology https: //www. youtube. com/watch? v=s 0 BLh. HAC 6 b 4 https: //www. youtube. com/watch? v=wx. Fb. Yo. F 7 SLc Example of C-nanotube https: //www. youtube. com/watch? v=lq_l 09 kxzh 0 https: //www. youtube. com/watch? v=4 XDJC 64 t. DR 0
- Slides: 19