https onlinelibrary wiley comdoifull10 1002jmri 25750 The Data


https: //onlinelibrary. wiley. com/doi/full/10. 1002/jmri. 25750

The Data 9 23 2 44 256 32 178 subjects


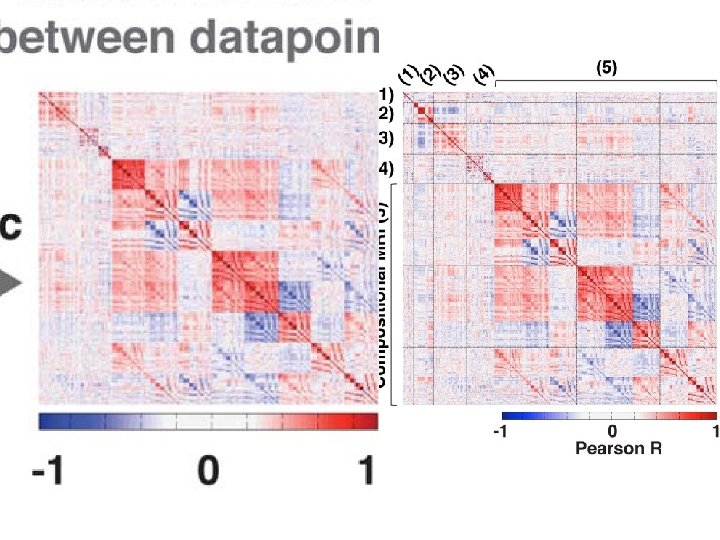
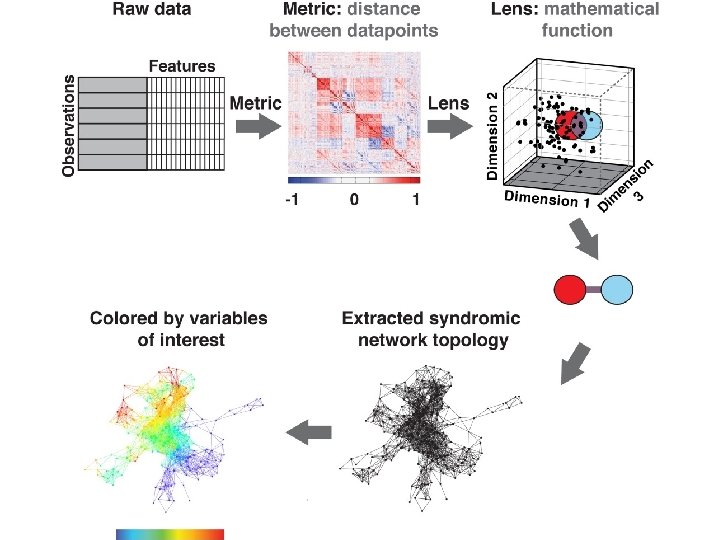
column‐wise: mean centered, and variance normalized

TDA parameters: 2 D filter function: PCA Number of intervals: %overlap: 3. 5


TDA parameters: 2 D filter function: PCA 1, PCA 2 Number of intervals: 30 %overlap: 3. 5 178 subjects 366 variables

48 in subnetwork 1 109 in subnetwork 2 6 in both 1 and 2 15 in subnetwork 3 and singletons(? ). TDA parameters: 2 D filter function: PCA 1, PCA 2 Number of intervals: 30 %overlap: 3. 5 178 subjects 288 variables

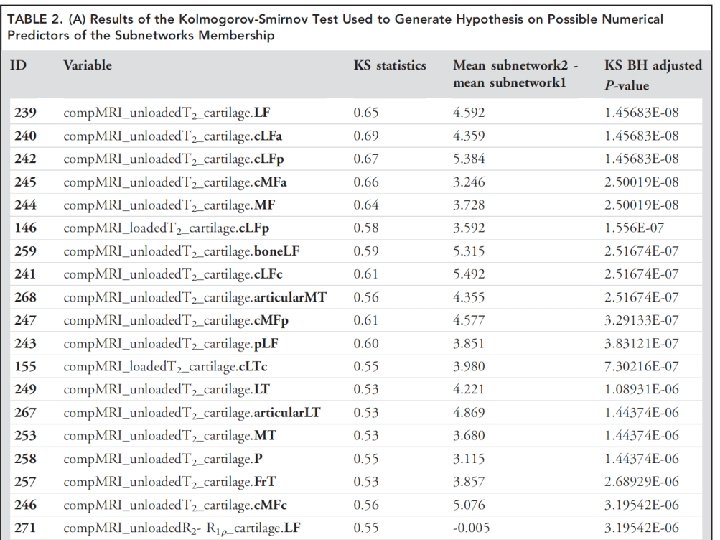
http: //www. physics. csbsju. edu/stats/KS‐test. html The KS‐test uses the maximum vertical deviation between the two curves as the statistic D. In this case the maximum deviation occurs near x=1 and has D=. 45. (The fraction of the treatment group that is less then one is 0. 2 (4 out of the 20 values); the fraction of the control group that is less than one is 0. 65 (13 out of the 20 values). Thus the maximum difference in cumulative fraction is D=. 45. )

 the progressors are marked (dashed circle,")
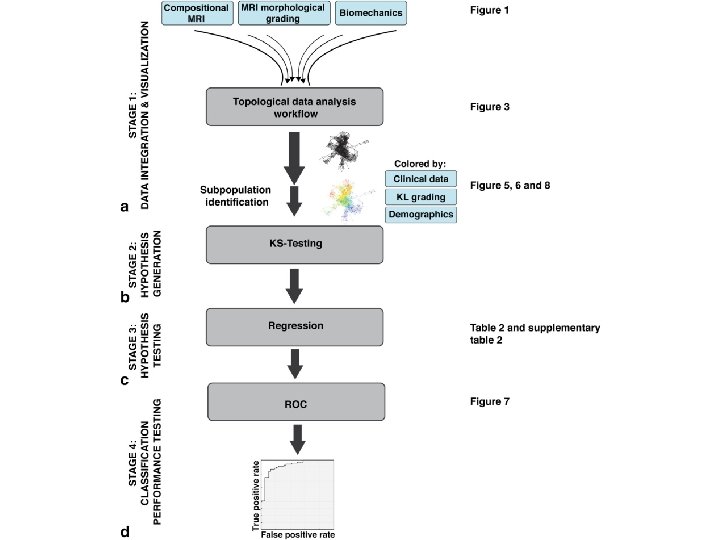
Within the less sever osteoarthritis subpopulation (subnetwork 1) the progressors are marked (dashed circle, subnetwork 1 a) and statistically compared to the remaining subjects within subnetwork 1. This analysis suggests R 2‐R 1 q as one of the possible predictors of cartilage lesion progression in just one of the two subpopulations identified by the multidimensional analysis approach, highlighting the value of using data‐driven TDA‐based grouping.


Department of Radiology and Biomedical Imaging, University of California, San Francisco, Department of Neurological Surgery, Brain and Spinal Injury Center, UCSF, Therapy and Rehabilitation Science, University of California, San Francisco Veterans Affairs Medical Center https: //onlinelibrary. wiley. com/doi/full/10. 1002/jmri. 25750

From: https: //onlinelibrary. wiley. com/doi/full/10. 1002/jmri. 25750 Acknowledgements: Usually at the end, sometimes at the beginning of talk or section. Grant funding often also on title slide

The Data 9 23 2 44 256 32 178 subjects


column‐wise: mean centered, and variance normalized


TDA parameters: 2 D filter function: PCA Number of intervals: %overlap: 3. 5


TDA parameters: 2 D filter function: PCA 1, PCA 2 Number of intervals: 30 %overlap: 3. 5 178 subjects 366 variables

48 in subnetwork 1 109 in subnetwork 2 6 in both 1 and 2 15 in subnetwork 3 and singletons(? ). TDA parameters: 2 D filter function: PCA 1, PCA 2 Number of intervals: 30 %overlap: 3. 5 178 subjects 288 variables
 the progressors are marked (dashed circle,")
Within the less sever osteoarthritis subpopulation (subnetwork 1) the progressors are marked (dashed circle, subnetwork 1 a) and statistically compared to the remaining subjects within subnetwork 1. This analysis suggests R 2‐R 1 q as one of the possible predictors of cartilage lesion progression in just one of the two subpopulations identified by the multidimensional analysis approach, highlighting the value of using data‐driven TDA‐based grouping.


https: //www. nature. com/articles/s 41467‐ 018‐ 03664‐ 4 Published online: 11 April 2018

1017 data points = 1017 acquired time frames Nonlinear dimensionality reduction method using a variant of stochastic neighborhood estimation (SNE

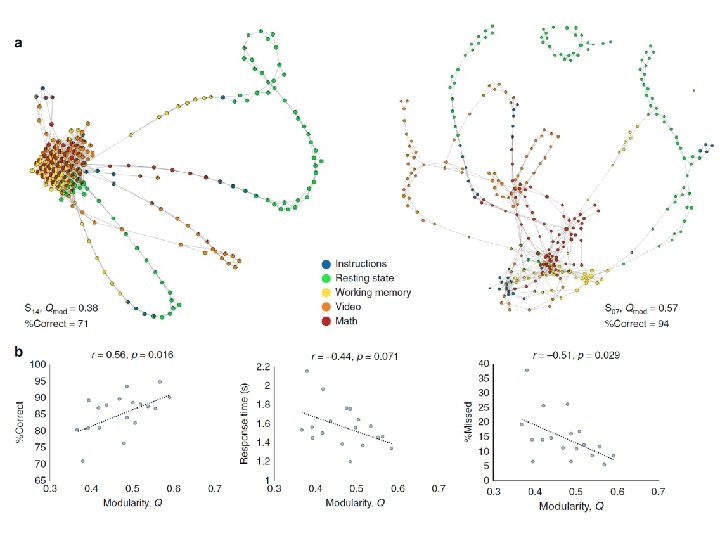
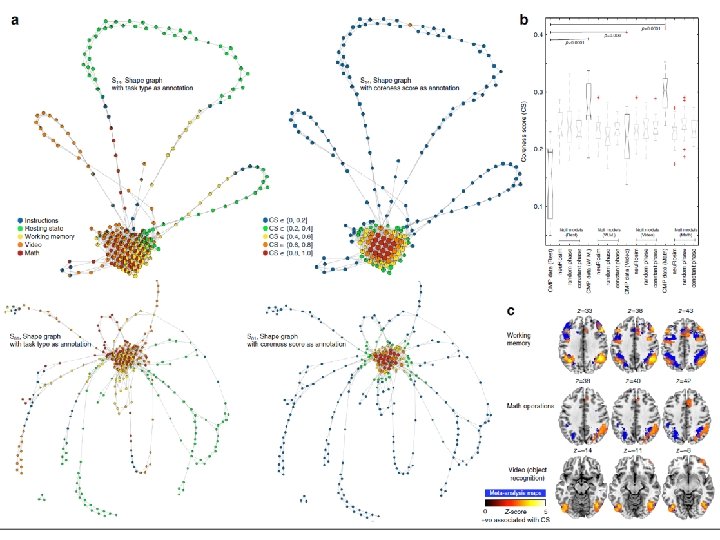
Fig. 2 Revealing the shape of brain’s dynamical organization. a Depicts the shape graph for one of the representative participants (S 01) from the CMP dataset. The shape graph was annotated using colors and pie-chart visualization scheme to depict how the tasks were represented in each shape graph. b Shows a zoomed-in version of the densely connected region of the shape graph to show the use of pie-chart visualization


- Slides: 47