
http www therealbears orgvideo 1 1 Obtained from
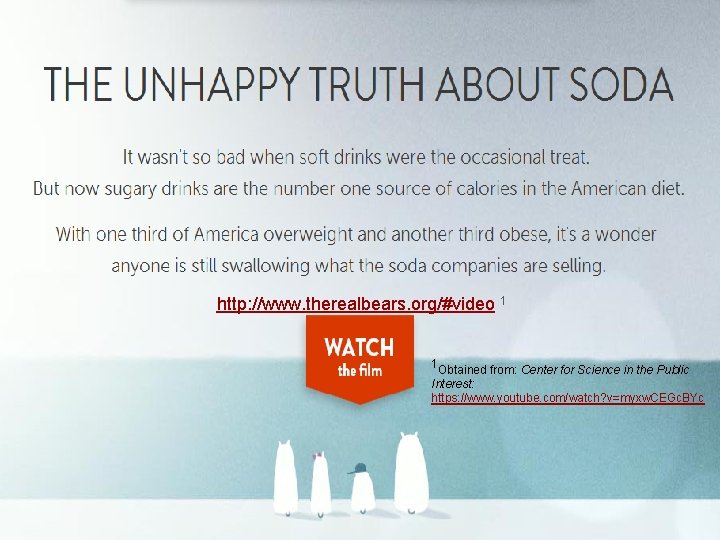
http: //www. therealbears. org/#video 1 1 Obtained from: Center for Science in the Public Interest: https: //www. youtube. com/watch? v=myxw. CEGc. BYc
Sodabriety Promoting Healthier Beverage Consumption Carol Smathers, MS, MPH, FCS Field Specialist, Youth Nutrition & Wellness Spring 2014
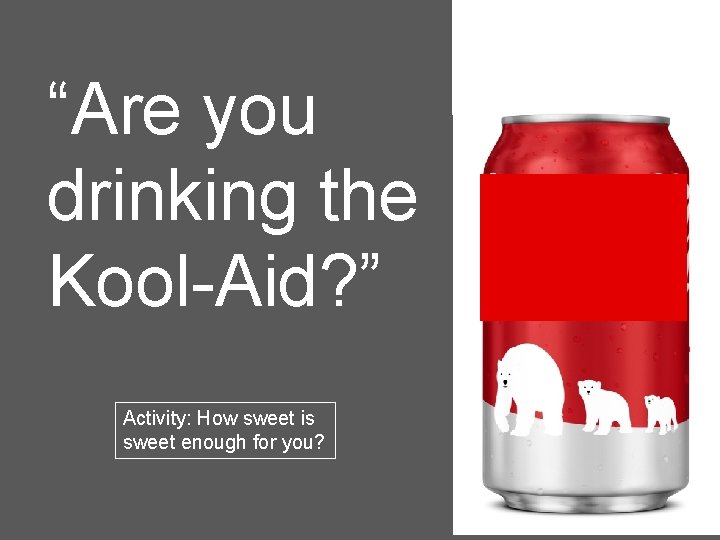
“Are you drinking the Kool-Aid? ” Activity: How sweet is sweet enough for you?
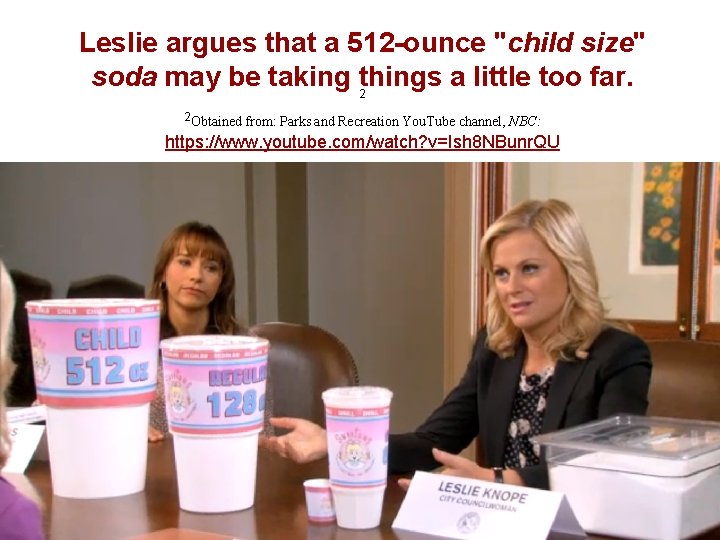
Leslie argues that a 512 -ounce "child size" soda may be taking things a little too far. 2 2 Obtained from: Parks and Recreation You. Tube channel, NBC: https: //www. youtube. com/watch? v=Ish 8 NBunr. QU
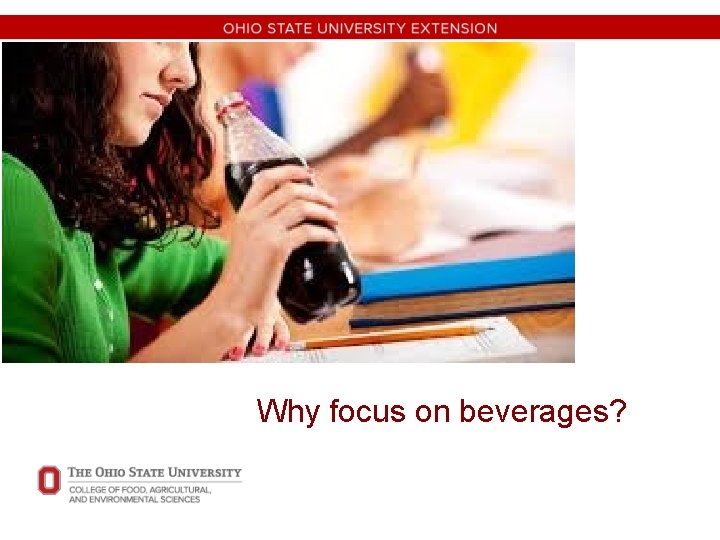
Why focus on beverages?
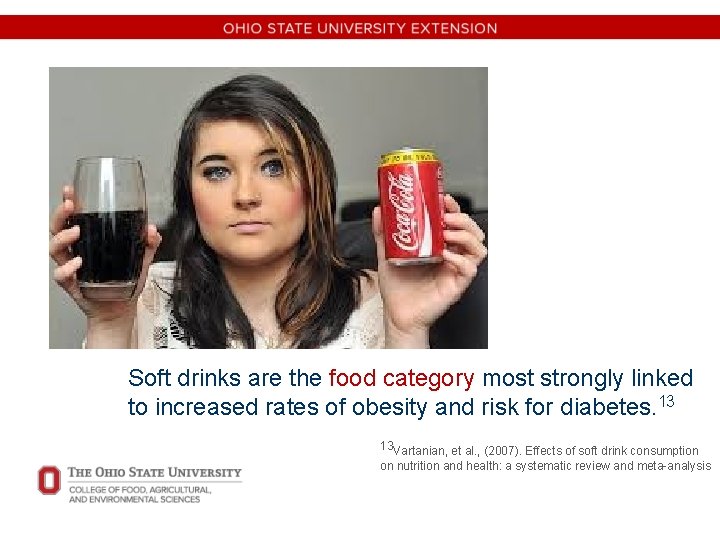
Soft drinks are the food category most strongly linked to increased rates of obesity and risk for diabetes. 13 13 Vartanian, et al. , (2007). Effects of soft drink consumption on nutrition and health: a systematic review and meta-analysis
“Your frenemy: Soda. It’s deceptively sweet. ”
How much sugar are we getting? Sugar is Killing Us: 16 https: //www. youtube. com/watch? v=Yda 8 Rt. Oc. VFU
The Sugar is Right Game Place as much food on your plate as you can to get close to 150 calories from sugars… without going over! sugar
Sugar Math 4 grams = 1 teaspoon = 15 -16 calories 17 If you get 100 -150 calories/day of added sugars, how much is that in terms of Teaspoons? Grams? Everyday foods and beverages? 17 Measurements obtained from: Agricultural Research Service: USDA.
Activity: How much sugar is in SSBs? For your beverage: 1. Show many teaspoons (packets) of sugar are in each serving. 4 grams = 1 teaspoon 2. Tell how many teaspoons (packets) of sugar are in each container. 3. What does the packaging imply about the product? 4. Does it have other sweeteners?
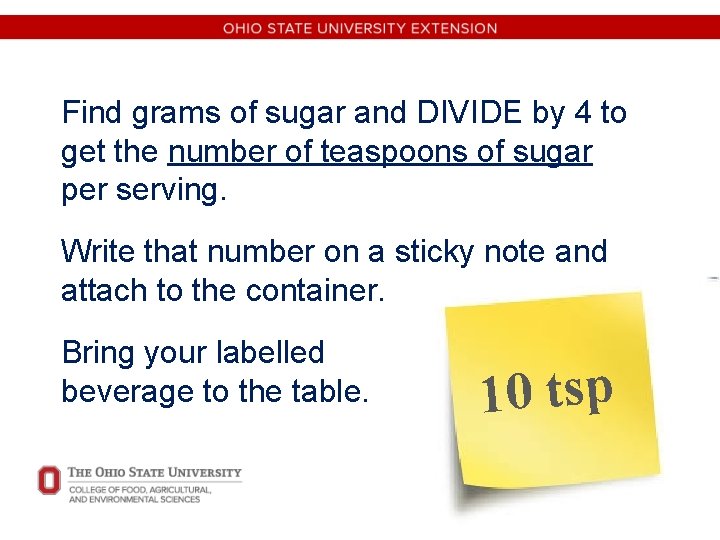
Find grams of sugar and DIVIDE by 4 to get the number of teaspoons of sugar per serving. Write that number on a sticky note and attach to the container. Bring your labelled beverage to the table. 10 tsp
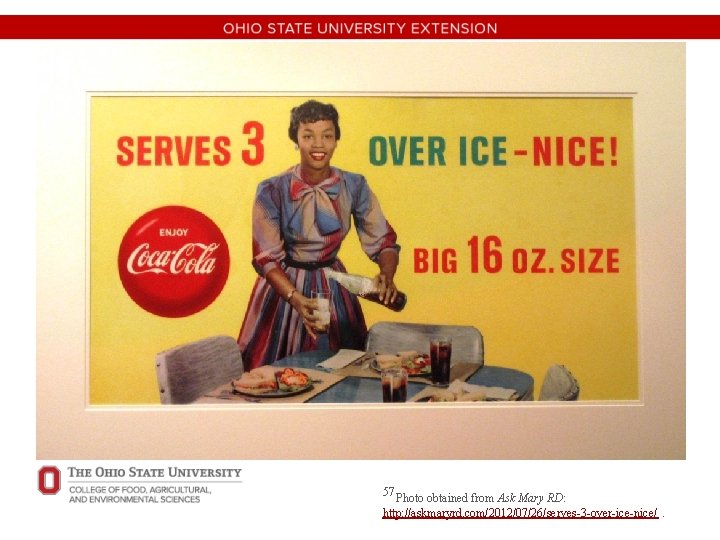
57 Photo obtained from Ask Mary RD: http: //askmaryrd. com/2012/07/26/serves-3 -over-ice-nice/.
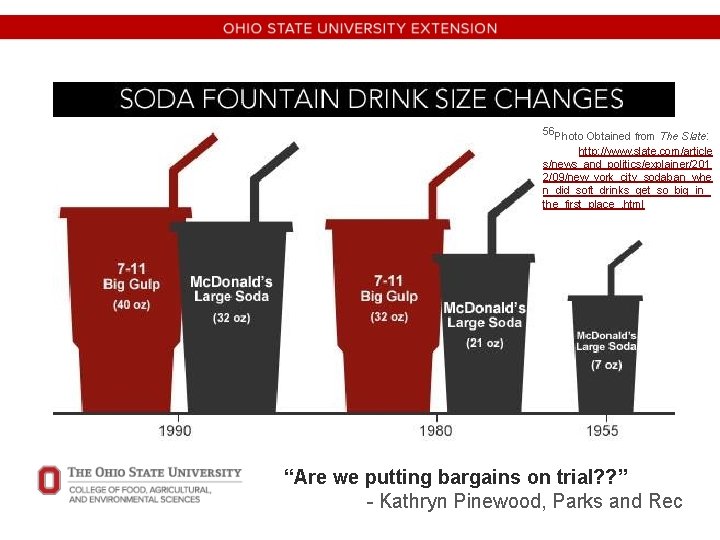
56 Photo Obtained from The Slate: http: //www. slate. com/article s/news_and_politics/explainer/201 2/09/new_york_city_sodaban_whe n_did_soft_drinks_get_so_big_in_ the_first_place_. html “Are we putting bargains on trial? ? ” - Kathryn Pinewood, Parks and Rec
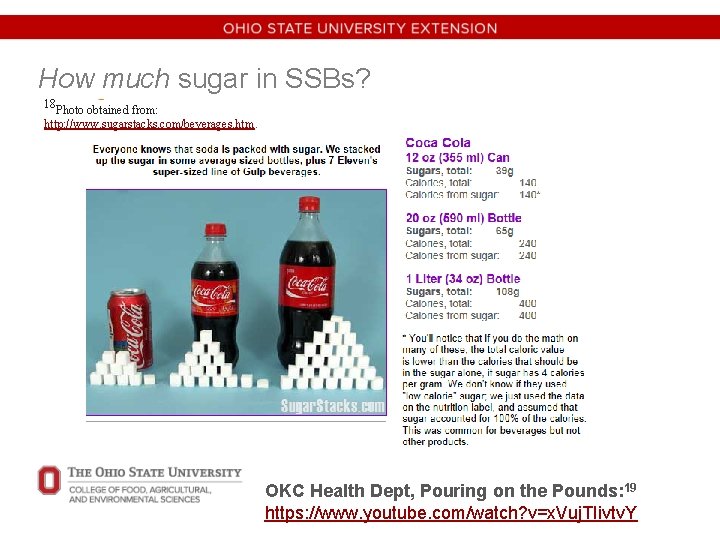
How much sugar in SSBs? 18 Photo obtained from: http: //www. sugarstacks. com/beverages. htm. OKC Health Dept, Pouring on the Pounds: 19 https: //www. youtube. com/watch? v=x. Vuj. TIivtv. Y
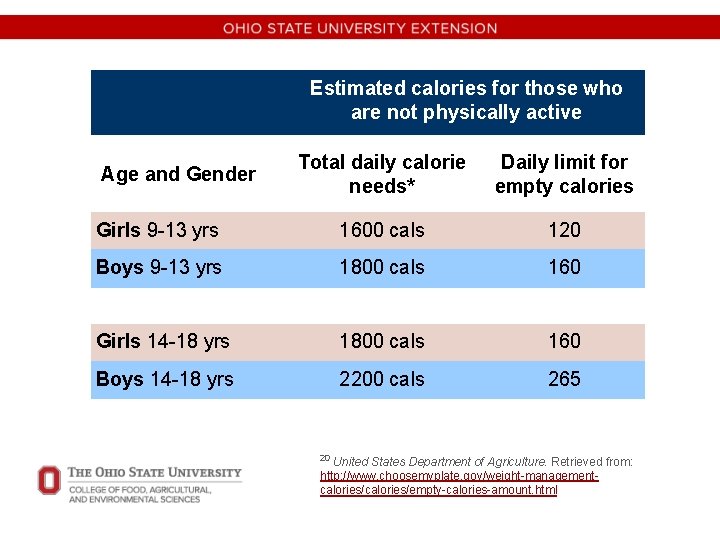
Estimated calories for those who are not physically active Total daily calorie needs* Daily limit for empty calories Girls 9 -13 yrs 1600 cals 120 Boys 9 -13 yrs 1800 cals 160 Girls 14 -18 yrs 1800 cals 160 Boys 14 -18 yrs 2200 cals 265 Age and Gender 20 United States Department of Agriculture. Retrieved from: http: //www. choosemyplate. gov/weight-managementcalories/empty-calories-amount. html
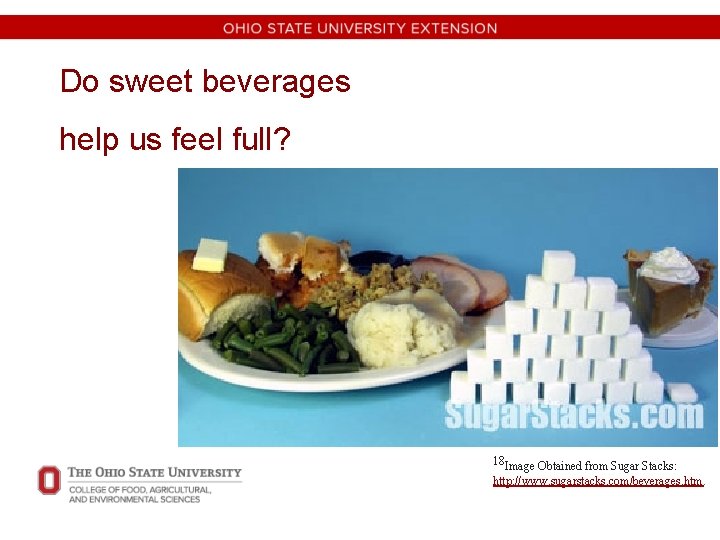
Do sweet beverages help us feel full? 18 Image Obtained from Sugar Stacks: http: //www. sugarstacks. com/beverages. htm.
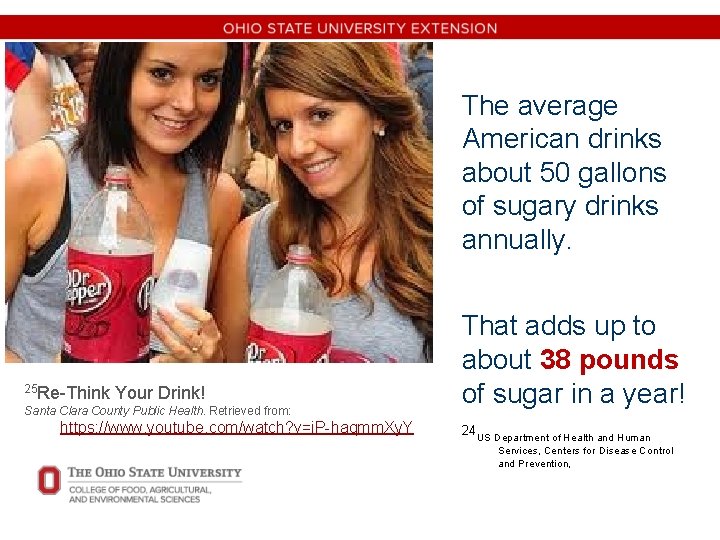
The average American drinks about 50 gallons of sugary drinks annually. 25 Re-Think Your Drink! Santa Clara County Public Health. Retrieved from: https: //www. youtube. com/watch? v=i. P-haqmm. Xy. Y That adds up to about 38 pounds of sugar in a year! 24 US Department of Health and Human Services, Centers for Disease Control and Prevention,
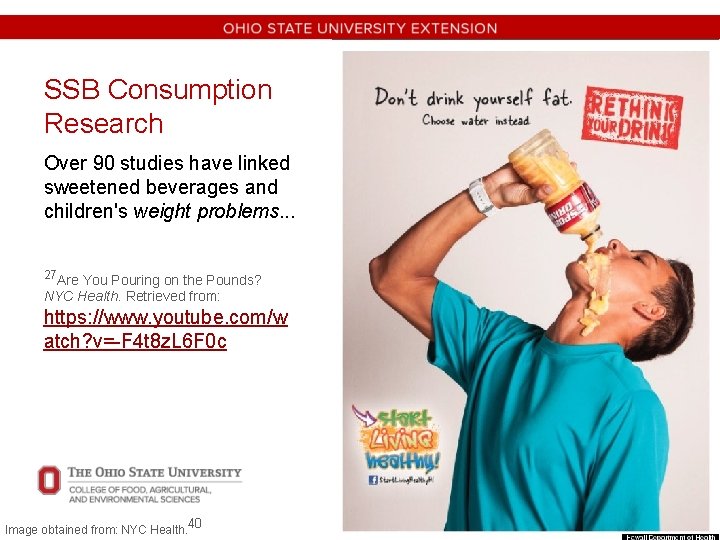
SSB Consumption Research Over 90 studies have linked sweetened beverages and children's weight problems. . . 27 Are You Pouring on the Pounds? NYC Health. Retrieved from: https: //www. youtube. com/w atch? v=-F 4 t 8 z. L 6 F 0 c Image obtained from: NYC Health. 40
Just what IS a sugary beverage… and what is NOT ? ? ? 28 Parks and Recreation. Retrieved from: https: //www. youtube. com/watch? v=Eq. Flt. HXCXV 0
“Look! Up in the label… It’s corn syrup! It’s sucrose! It’s… Sugar!”
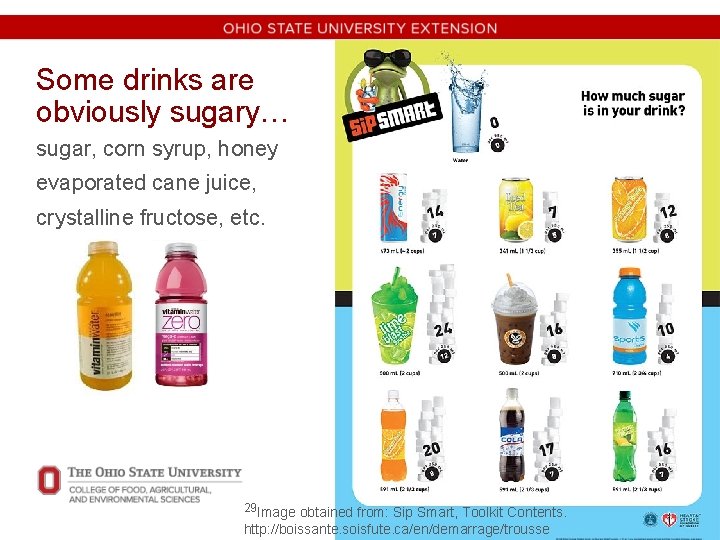
Some drinks are obviously sugary… sugar, corn syrup, honey evaporated cane juice, crystalline fructose, etc. 29 Image obtained from: Sip Smart, Toolkit Contents. http: //boissante. soisfute. ca/en/demarrage/trousse
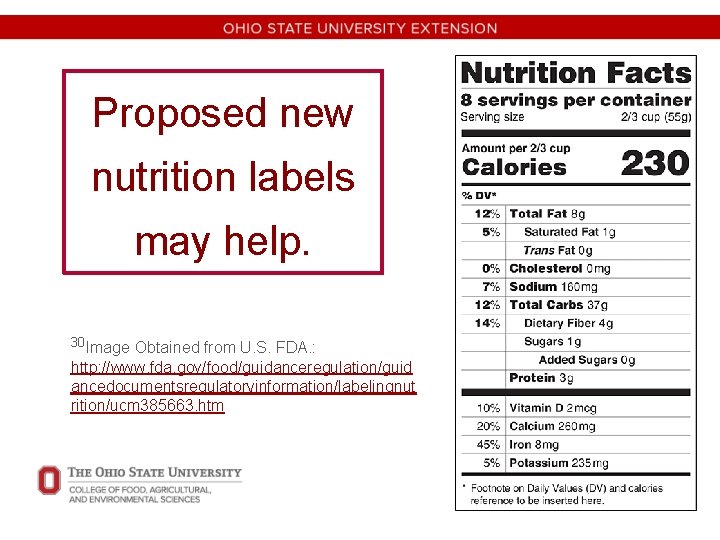
Proposed new nutrition labels may help. 30 Image Obtained from U. S. FDA. : http: //www. fda. gov/food/guidanceregulation/guid ancedocumentsregulatoryinformation/labelingnut rition/ucm 385663. htm
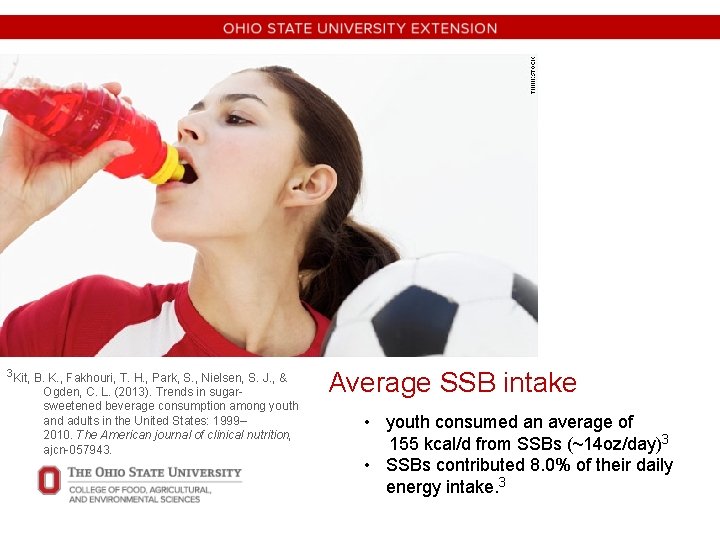
3 Kit, B. K. , Fakhouri, T. H. , Park, S. , Nielsen, S. J. , & Ogden, C. L. (2013). Trends in sugarsweetened beverage consumption among youth and adults in the United States: 1999– 2010. The American journal of clinical nutrition, ajcn-057943. Average SSB intake • youth consumed an average of 155 kcal/d from SSBs (~14 oz/day)3 • SSBs contributed 8. 0% of their daily energy intake. 3
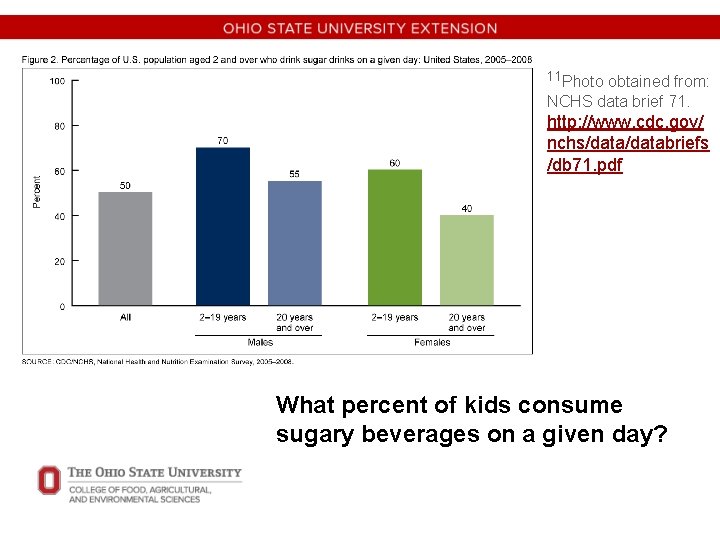
11 Photo obtained from: NCHS data brief 71. http: //www. cdc. gov/ nchs/databriefs /db 71. pdf What percent of kids consume sugary beverages on a given day?
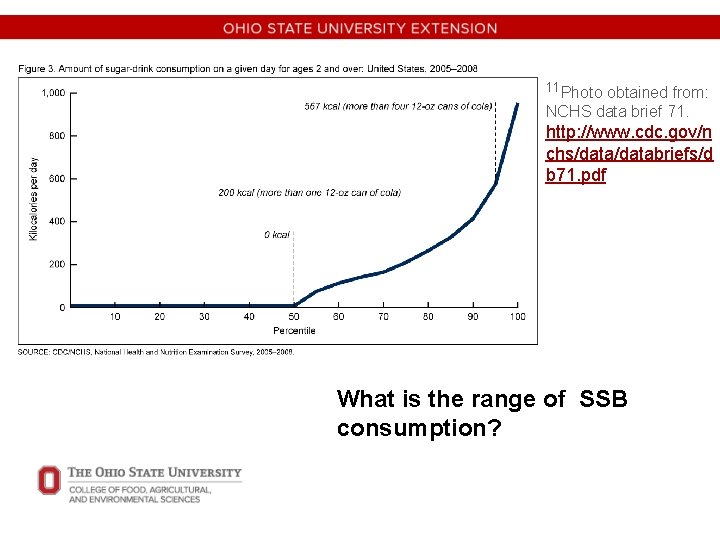
11 Photo obtained from: NCHS data brief 71. http: //www. cdc. gov/n chs/databriefs/d b 71. pdf What is the range of SSB consumption?
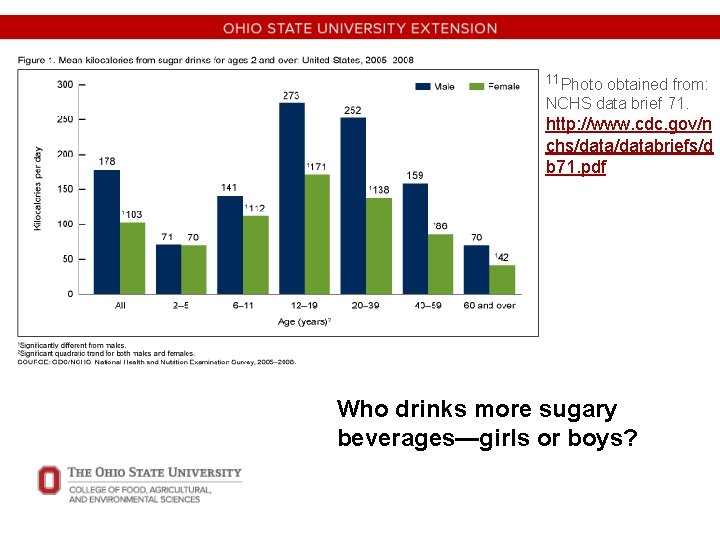
11 Photo obtained from: NCHS data brief 71. http: //www. cdc. gov/n chs/databriefs/d b 71. pdf Who drinks more sugary beverages—girls or boys?
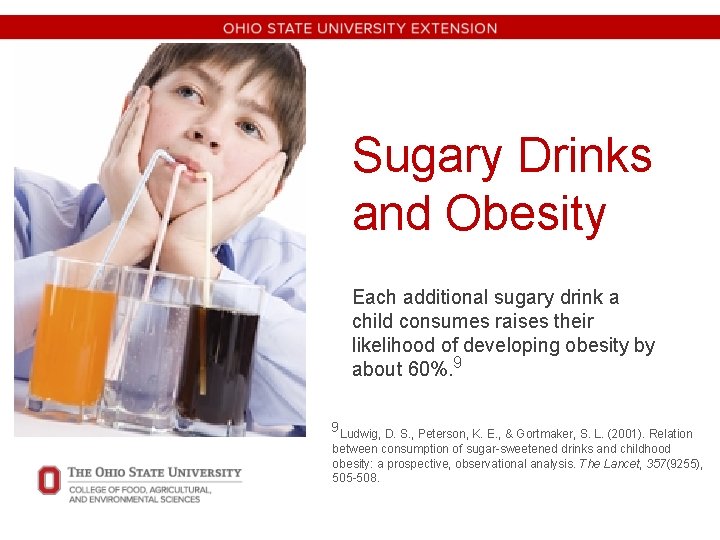
Sugary Drinks and Obesity Each additional sugary drink a child consumes raises their likelihood of developing obesity by about 60%. 9 9 Ludwig, D. S. , Peterson, K. E. , & Gortmaker, S. L. (2001). Relation between consumption of sugar-sweetened drinks and childhood obesity: a prospective, observational analysis. The Lancet, 357(9255), 505 -508.
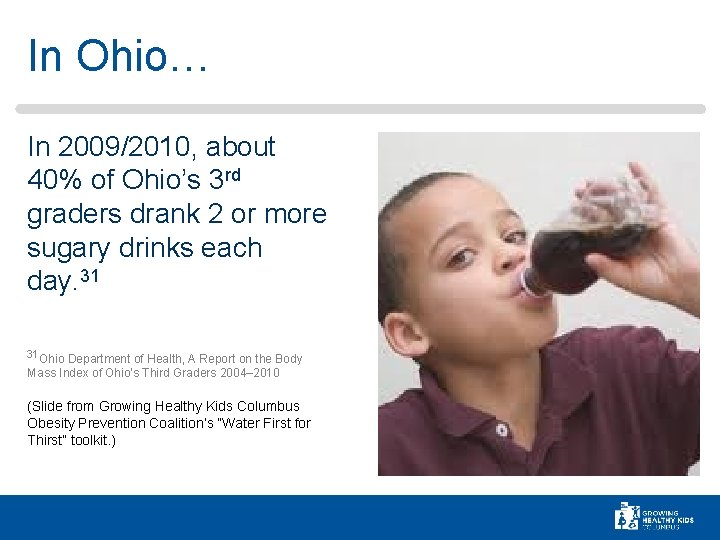
In Ohio… In 2009/2010, about 40% of Ohio’s 3 rd graders drank 2 or more sugary drinks each day. 31 31 Ohio Department of Health, A Report on the Body Mass Index of Ohio’s Third Graders 2004– 2010 (Slide from Growing Healthy Kids Columbus Obesity Prevention Coalition’s “Water First for Thirst” toolkit. )
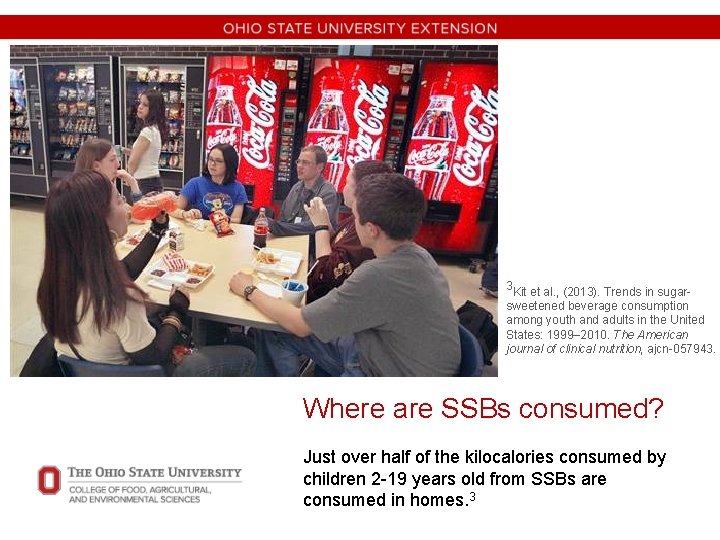
3 Kit et al. , (2013). Trends in sugar- sweetened beverage consumption among youth and adults in the United States: 1999– 2010. The American journal of clinical nutrition, ajcn-057943. Where are SSBs consumed? Just over half of the kilocalories consumed by children 2 -19 years old from SSBs are consumed in homes. 3
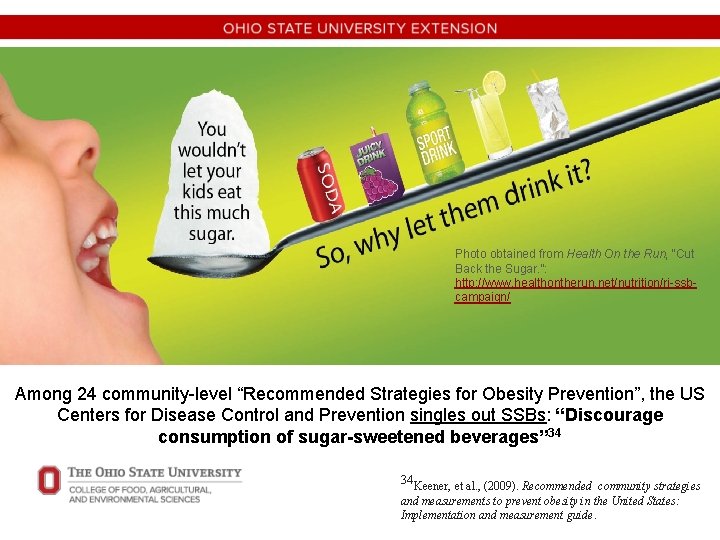
Photo obtained from Health On the Run, “Cut Back the Sugar. ”: http: //www. healthontherun. net/nutrition/ri-ssbcampaign/ Among 24 community-level “Recommended Strategies for Obesity Prevention”, the US Centers for Disease Control and Prevention singles out SSBs: “Discourage consumption of sugar-sweetened beverages” 34 34 Keener, et al. , (2009). Recommended community strategies and measurements to prevent obesity in the United States: Implementation and measurement guide.
SSB REDUCTION AMONG YOUTH
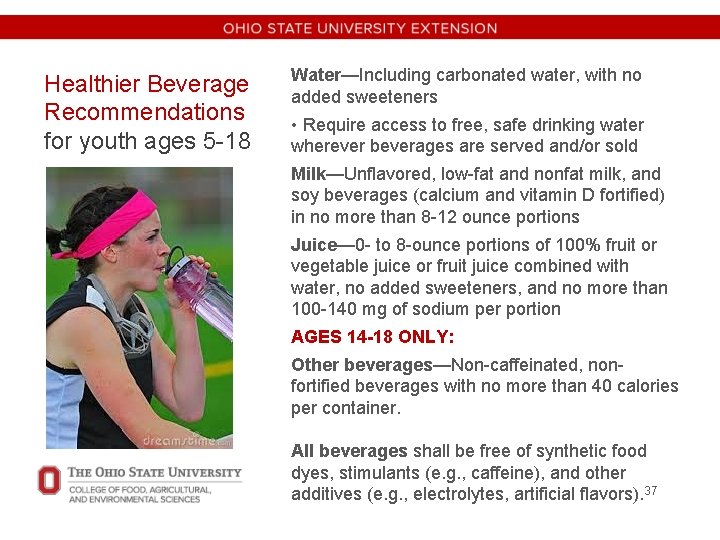
Healthier Beverage Recommendations for youth ages 5 -18 Water—Including carbonated water, with no added sweeteners • Require access to free, safe drinking water wherever beverages are served and/or sold Milk—Unflavored, low-fat and nonfat milk, and soy beverages (calcium and vitamin D fortified) in no more than 8 -12 ounce portions Juice— 0 - to 8 -ounce portions of 100% fruit or vegetable juice or fruit juice combined with water, no added sweeteners, and no more than 100 -140 mg of sodium per portion AGES 14 -18 ONLY: Other beverages—Non-caffeinated, nonfortified beverages with no more than 40 calories per container. All beverages shall be free of synthetic food dyes, stimulants (e. g. , caffeine), and other additives (e. g. , electrolytes, artificial flavors). 37
38 Partnership for a Healthier America. Drink Up: https: //www. youtube. com/watch? v=bz. JKRKEU-dw “Water First for Thirst” “Replacing sugary beverages with healthier options that contain no added sugar or low amounts of sugar and calories is a key public health priority. ” 37 (pg. 1)
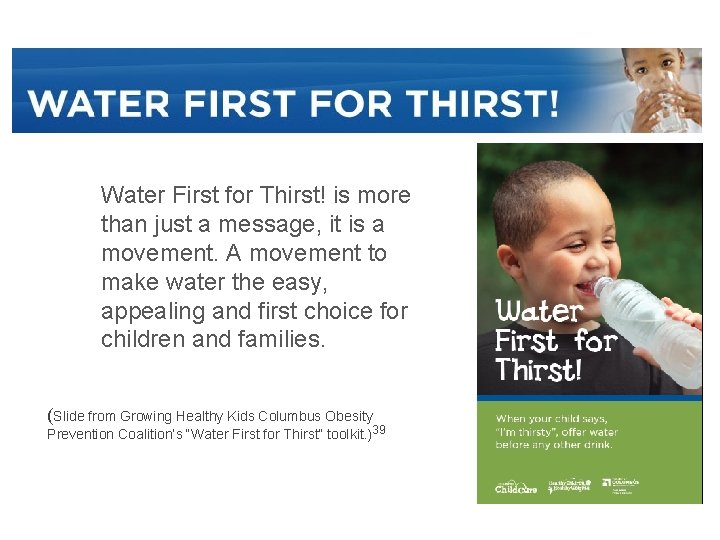
Water First for Thirst! is more than just a message, it is a movement. A movement to make water the easy, appealing and first choice for children and families. (Slide from Growing Healthy Kids Columbus Obesity Prevention Coalition’s “Water First for Thirst” toolkit. )39
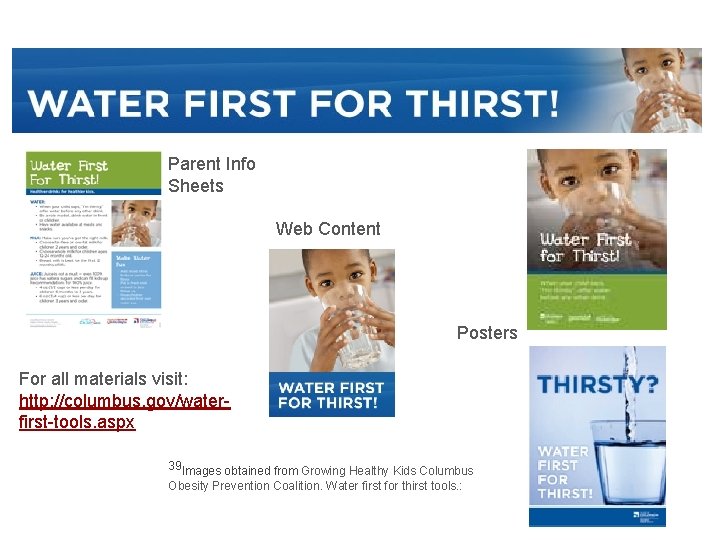
Parent Info Sheets Web Content Posters For all materials visit: http: //columbus. gov/waterfirst-tools. aspx 39 Images obtained from Growing Healthy Kids Columbus Obesity Prevention Coalition. Water first for thirst tools. :
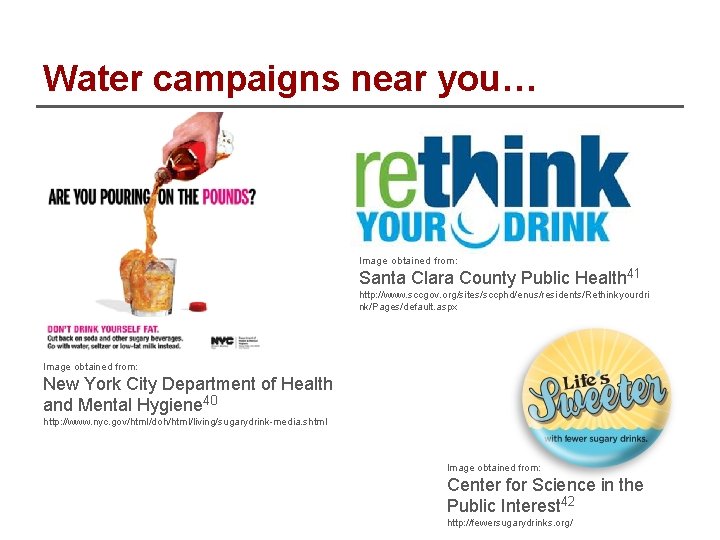
Water campaigns near you… Image obtained from: Santa Clara County Public Health 41 http: //www. sccgov. org/sites/sccphd/enus/residents/Rethinkyourdri nk/Pages/default. aspx Image obtained from: New York City Department of Health and Mental Hygiene 40 http: //www. nyc. gov/html/doh/html/living/sugarydrink-media. shtml Image obtained from: Center for Science in the Public Interest 42 http: //fewersugarydrinks. org/
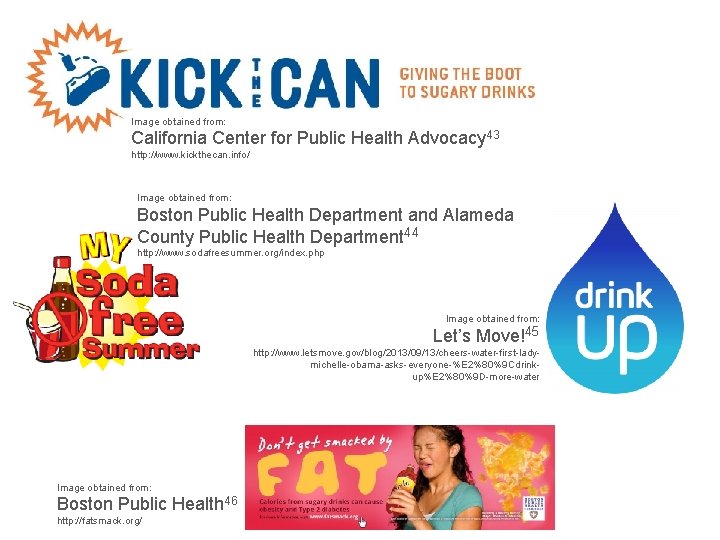
Image obtained from: California Center for Public Health Advocacy 43 http: //www. kickthecan. info/ Image obtained from: Boston Public Health Department and Alameda County Public Health Department 44 http: //www. sodafreesummer. org/index. php Image obtained from: Let’s Move!45 http: //www. letsmove. gov/blog/2013/09/13/cheers-water-first-ladymichelle-obama-asks-everyone-%E 2%80%9 Cdrinkup%E 2%80%9 D-more-water Image obtained from: Boston Public Health 46 http: //fatsmack. org/
“#Yougotserved”
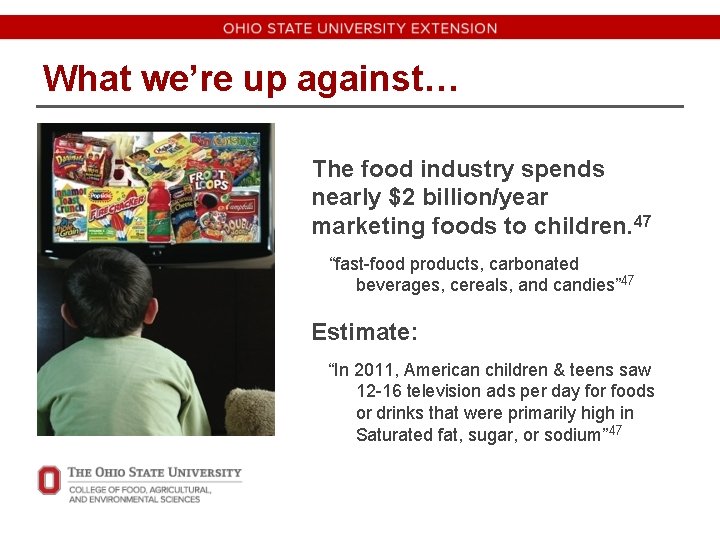
What we’re up against… The food industry spends nearly $2 billion/year marketing foods to children. 47 “fast-food products, carbonated beverages, cereals, and candies” 47 Estimate: “In 2011, American children & teens saw 12 -16 television ads per day for foods or drinks that were primarily high in Saturated fat, sugar, or sodium” 47
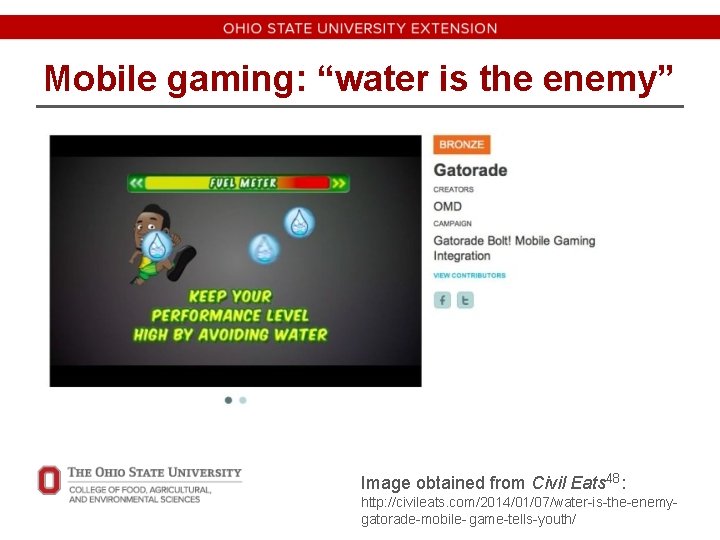
Mobile gaming: “water is the enemy” Image obtained from Civil Eats 48: http: //civileats. com/2014/01/07/water-is-the-enemygatorade-mobile- game-tells-youth/
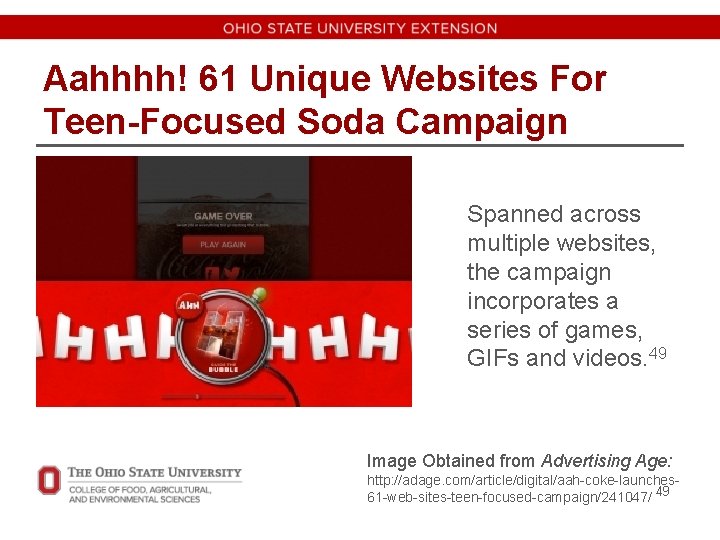
Aahhhh! 61 Unique Websites For Teen-Focused Soda Campaign Spanned across multiple websites, the campaign incorporates a series of games, GIFs and videos. 49 Image Obtained from Advertising Age: http: //adage. com/article/digital/aah-coke-launches 61 -web-sites-teen-focused-campaign/241047/ 49
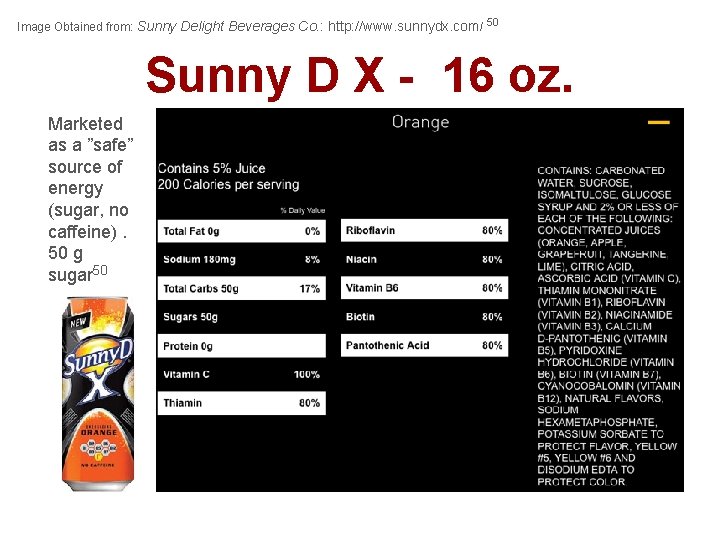
Image Obtained from: Sunny Delight Beverages Co. : http: //www. sunnydx. com/ 50 Sunny D X - 16 oz. Marketed as a ”safe” source of energy (sugar, no caffeine). 50 g sugar 50
Attitudes toward SSBs “If it Tastes Good, I’m Drinking It”: Qualitative Study of Beverage Consumption among College Students • taste and price were the most important factors in choosing beverages • negative perceptions of SSBs on the “dangers” of sugar and chemicals in sodas of little concern • thought shocking educational messages would be necessary to get them to reduce consumption of SSBs. 51 Block, J. P. , Gillman, M. W. , Linakis, S. K. , & Goldman, R. E. (2013). “If It Tastes Good, I'm Drinking It”: Qualitative Study of Beverage Consumption Among College Students. Journal of Adolescent Health, 52(6), 702 - 706.
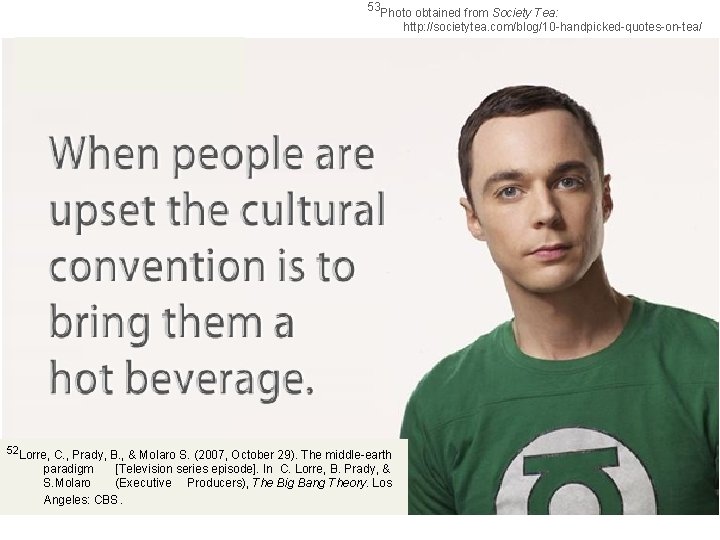
53 Photo obtained from Society Tea: http: //societytea. com/blog/10 -handpicked-quotes-on-tea/ 52 Lorre, C. , Prady, B. , & Molaro S. (2007, October 29). The middle-earth paradigm [Television series episode]. In C. Lorre, B. Prady, & S. Molaro (Executive Producers), The Big Bang Theory. Los Angeles: CBS.
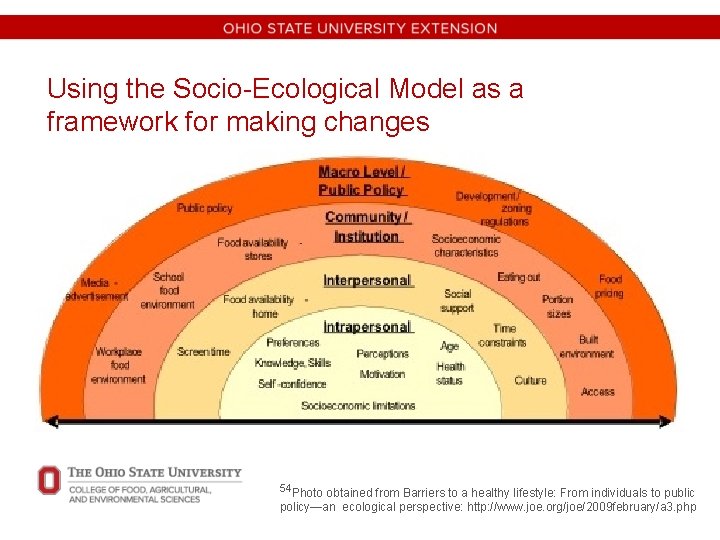
Using the Socio-Ecological Model as a framework for making changes 54 Photo obtained from Barriers to a healthy lifestyle: From individuals to public policy—an ecological perspective: http: //www. joe. org/joe/2009 february/a 3. php
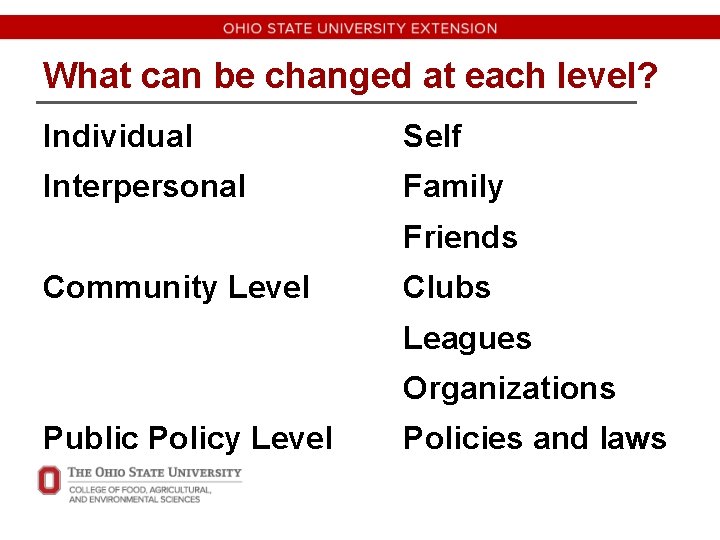
What can be changed at each level? Individual Self Interpersonal Family Friends Community Level Clubs Leagues Organizations Public Policy Level Policies and laws
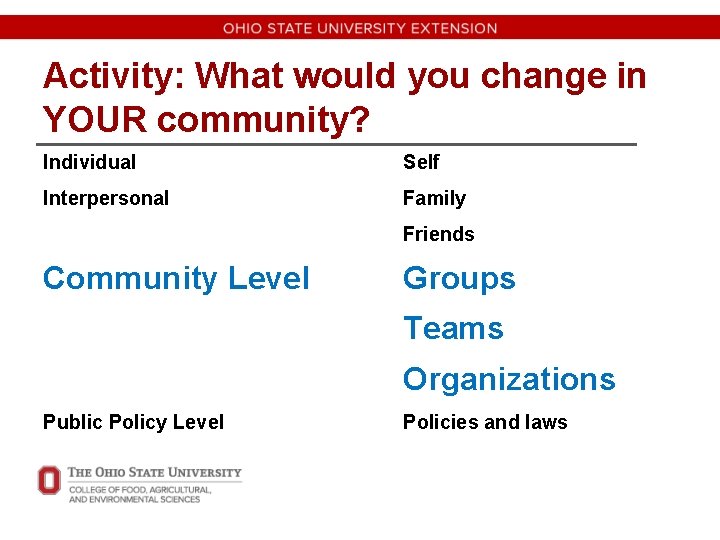
Activity: What would you change in YOUR community? Individual Self Interpersonal Family Friends Community Level Groups Teams Organizations Public Policy Level Policies and laws
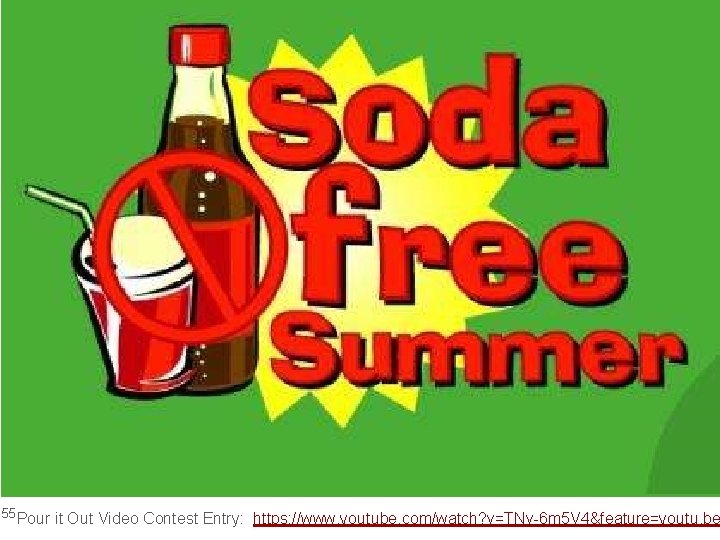
55 Pour it Out Video Contest Entry: https: //www. youtube. com/watch? v=TNv-6 m 5 V 4&feature=youtu. be
Acknowledgements Special thanks to Shawna Hite, OSU MPH student Bridgette Kidd, MPH, RD, OSU Extension Jamie Turner, MPH, Columbus Public Health Growing Healthy Kids Columbus Coalition Contact: smathers. 14@osu. edu
- Slides: 50