
http www bized ac uk Break Even Analysis
http: //www. bized. ac. uk Break Even Analysis and Short term profit planning
Break-Even Analysishttp: //www. bized. ac. uk • Break-Even Analysis is used to – predict future profits/losses – predict results eg produce Product A or Product B • Break-Even Point is when Sales Revenue equals Total Costs • at this point no profit or loss is incurred • the firm merely covers its total costs • Break-Even Point can be shown in graph form or by use of formulae

Break-Even Analysishttp: //www. bized. ac. uk In order to calculate how profitable a product will be, we must firstly look at the Costs involved There are two basic types of costs a company incurs. • Variable Costs • Fixed Costs Variable costs are costs that change with changes in production levels or sales. Examples include: Costs of materials used in the production of the goods. This is also referred as direct cost of . the company Direct material, direct labor, direct variable cost Fixed costs remain roughly the same regardless of sales/output levels. Examples include: Rent, Insurance and Wages
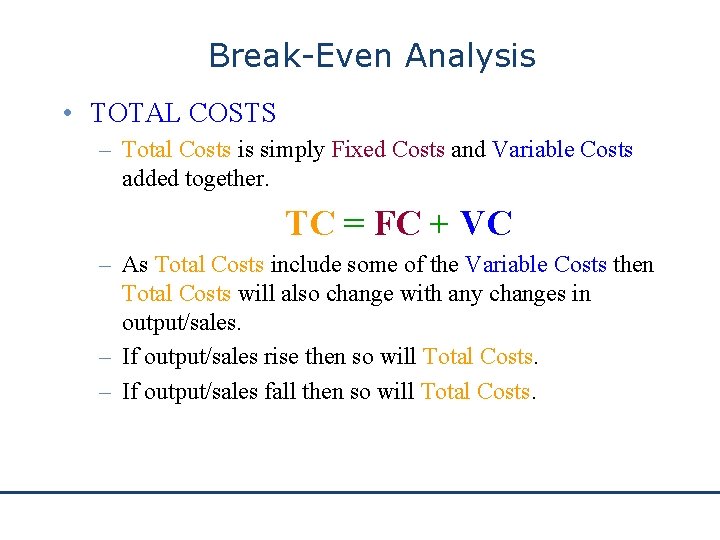
http: //www. bized. ac. uk Break-Even Analysis • TOTAL COSTS – Total Costs is simply Fixed Costs and Variable Costs added together. TC = FC + VC – As Total Costs include some of the Variable Costs then Total Costs will also change with any changes in output/sales. – If output/sales rise then so will Total Costs. – If output/sales fall then so will Total Costs.
Break-Even Analysis http: //www. bized. ac. uk The Break-even point occurs when Total Costs equals Revenue (Sales Income) Revenues (Sales Income) = Total Costs At this point the business is not making a Profit nor incurring a Loss – it is merely covering its Total Costs Let us have a look at a simple example. Bannerman Trading Company opens a flower shop.
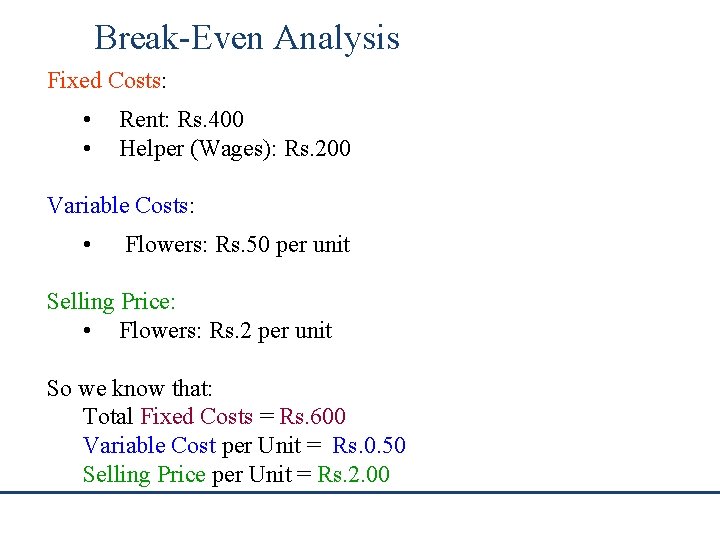
Break-Even Analysis Fixed Costs: • • Rent: Rs. 400 Helper (Wages): Rs. 200 Variable Costs: • Flowers: Rs. 50 per unit Selling Price: • Flowers: Rs. 2 per unit So we know that: Total Fixed Costs = Rs. 600 Variable Cost per Unit = Rs. 0. 50 Selling Price per Unit = Rs. 2. 00 http: //www. bized. ac. uk
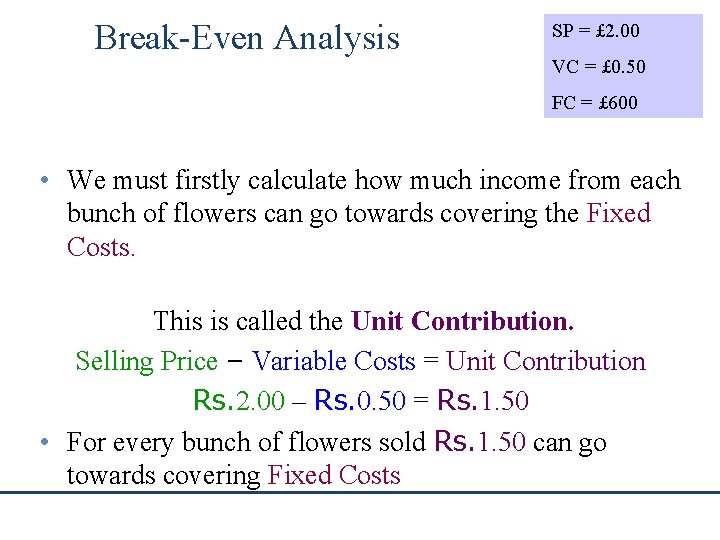
Break-Even Analysis SP = £ 2. 00 http: //www. bized. ac. uk VC = £ 0. 50 FC = £ 600 • We must firstly calculate how much income from each bunch of flowers can go towards covering the Fixed Costs. This is called the Unit Contribution. Selling Price – Variable Costs = Unit Contribution Rs. 2. 00 – Rs. 0. 50 = Rs. 1. 50 • For every bunch of flowers sold Rs. 1. 50 can go towards covering Fixed Costs
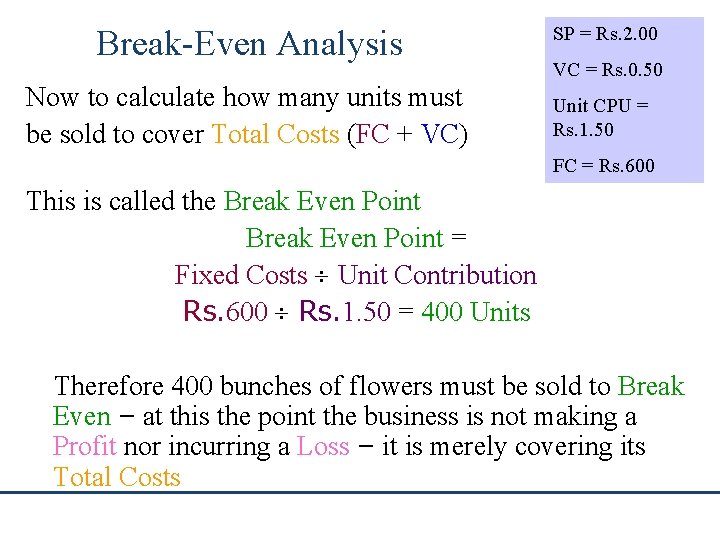
Break-Even Analysis SP = Rs. 2. 00 http: //www. bized. ac. uk Now to calculate how many units must be sold to cover Total Costs (FC + VC) VC = Rs. 0. 50 Unit CPU = Rs. 1. 50 FC = Rs. 600 This is called the Break Even Point = Fixed Costs Unit Contribution Rs. 600 Rs. 1. 50 = 400 Units Therefore 400 bunches of flowers must be sold to Break Even – at this the point the business is not making a Profit nor incurring a Loss – it is merely covering its Total Costs
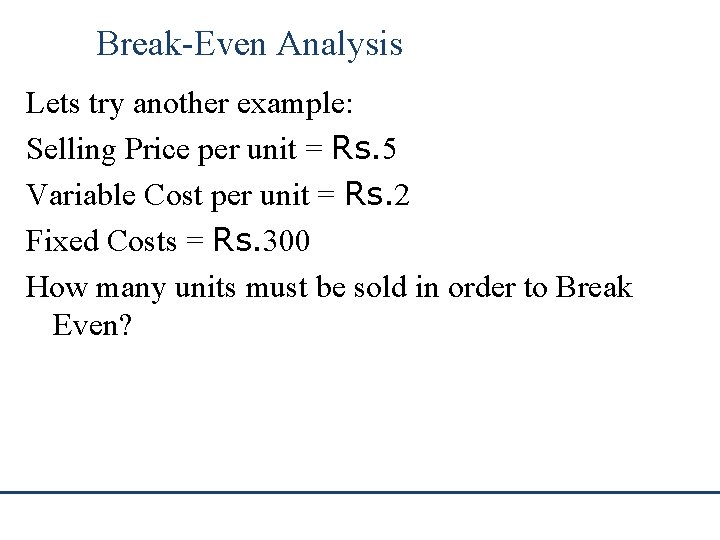
Break-Even Analysis http: //www. bized. ac. uk Lets try another example: Selling Price per unit = Rs. 5 Variable Cost per unit = Rs. 2 Fixed Costs = Rs. 300 How many units must be sold in order to Break Even?
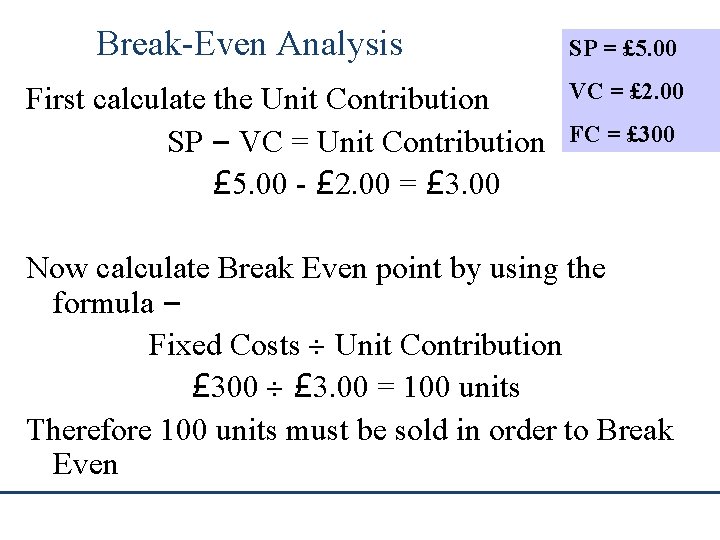
Break-Even Analysis SP = £ 5. 00 http: //www. bized. ac. uk First calculate the Unit Contribution SP – VC = Unit Contribution £ 5. 00 - £ 2. 00 = £ 3. 00 VC = £ 2. 00 FC = £ 300 Now calculate Break Even point by using the formula – Fixed Costs Unit Contribution £ 300 £ 3. 00 = 100 units Therefore 100 units must be sold in order to Break Even
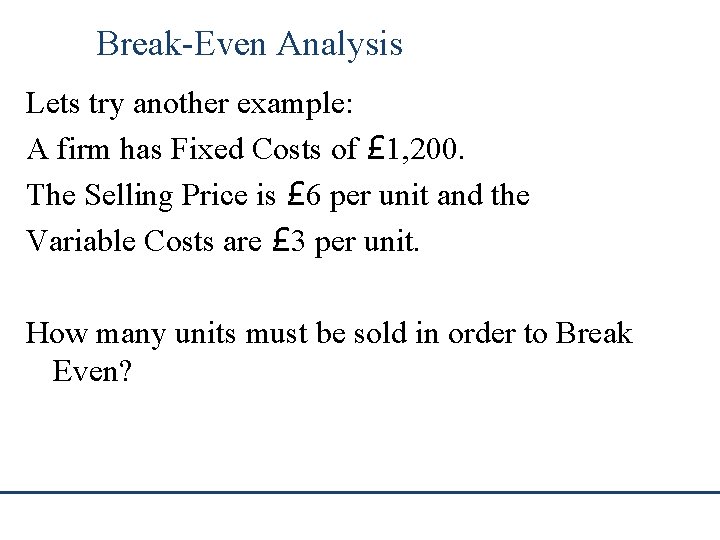
Break-Even Analysis http: //www. bized. ac. uk Lets try another example: A firm has Fixed Costs of £ 1, 200. The Selling Price is £ 6 per unit and the Variable Costs are £ 3 per unit. How many units must be sold in order to Break Even?
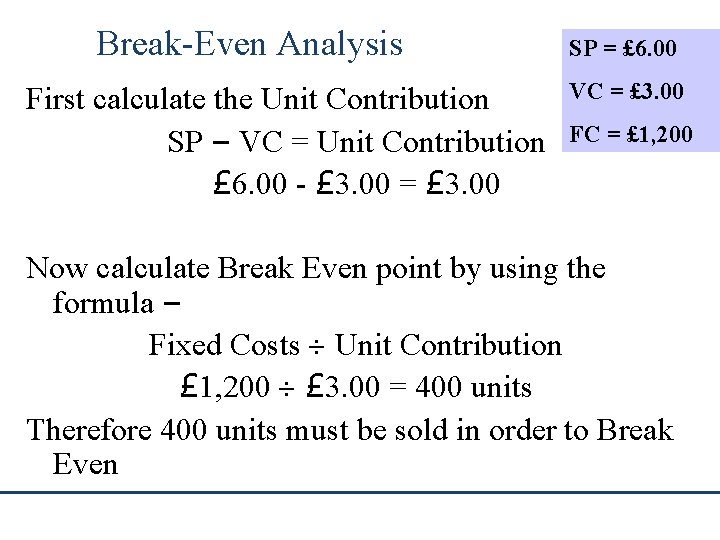
Break-Even Analysis SP = £ 6. 00 http: //www. bized. ac. uk First calculate the Unit Contribution SP – VC = Unit Contribution £ 6. 00 - £ 3. 00 = £ 3. 00 VC = £ 3. 00 FC = £ 1, 200 Now calculate Break Even point by using the formula – Fixed Costs Unit Contribution £ 1, 200 £ 3. 00 = 400 units Therefore 400 units must be sold in order to Break Even
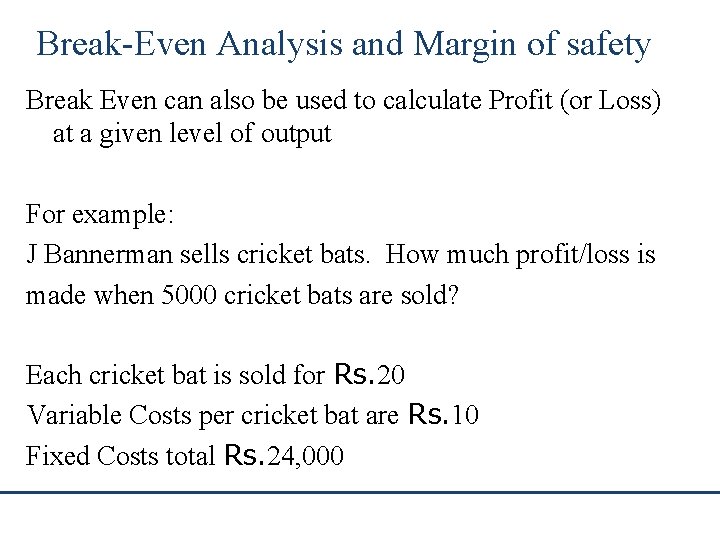
Break-Even Analysis and Margin of safety http: //www. bized. ac. uk Break Even can also be used to calculate Profit (or Loss) at a given level of output For example: J Bannerman sells cricket bats. How much profit/loss is made when 5000 cricket bats are sold? Each cricket bat is sold for Rs. 20 Variable Costs per cricket bat are Rs. 10 Fixed Costs total Rs. 24, 000
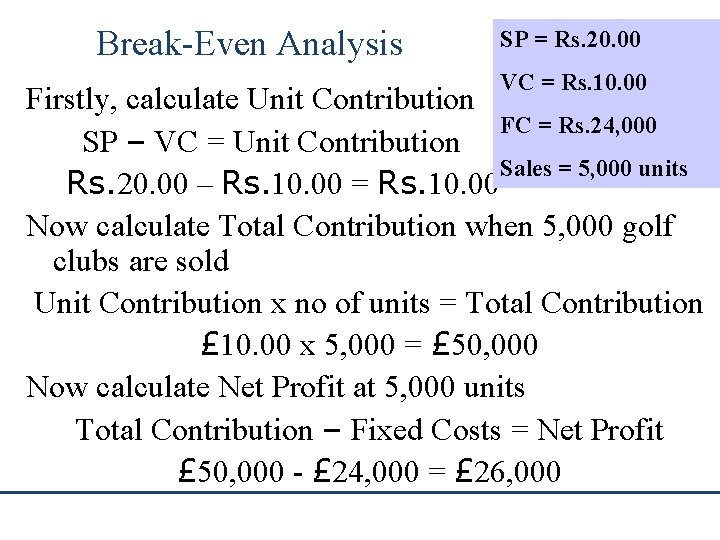
Break-Even Analysis SP = Rs. 20. 00 http: //www. bized. ac. uk VC = Rs. 10. 00 Firstly, calculate Unit Contribution FC = Rs. 24, 000 SP – VC = Unit Contribution Sales = 5, 000 units Rs. 20. 00 – Rs. 10. 00 = Rs. 10. 00 Now calculate Total Contribution when 5, 000 golf clubs are sold Unit Contribution x no of units = Total Contribution £ 10. 00 x 5, 000 = £ 50, 000 Now calculate Net Profit at 5, 000 units Total Contribution – Fixed Costs = Net Profit £ 50, 000 - £ 24, 000 = £ 26, 000

http: //www. bized. ac. uk Margin of safety (MOS) • MOS = Budgeted Sales – Break even point *CPU • = 5000 -2400* 10. 00 • = Rs. 26, 000. 00
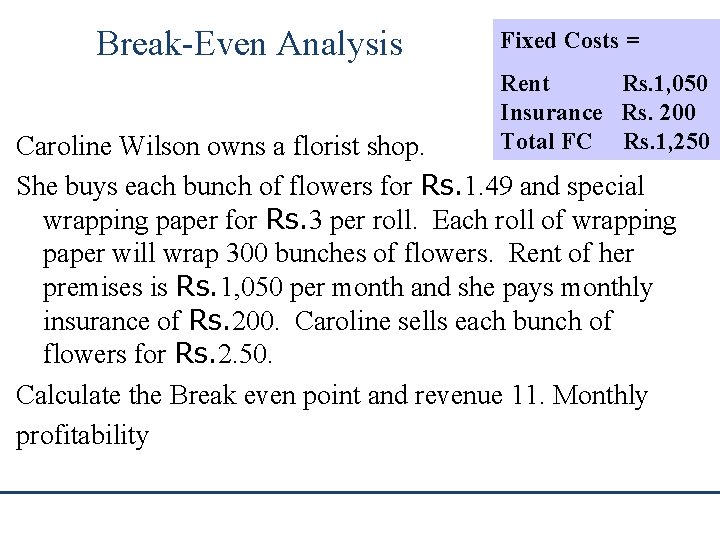
Break-Even Analysis SP = £ 2. 50 Fixed Costs = http: //www. bized. ac. uk Rent Rs. 1, 050 Insurance Rs. 200 Total FC Rs. 1, 250 Caroline Wilson owns a florist shop. She buys each bunch of flowers for Rs. 1. 49 and special wrapping paper for Rs. 3 per roll. Each roll of wrapping paper will wrap 300 bunches of flowers. Rent of her premises is Rs. 1, 050 per month and she pays monthly insurance of Rs. 200. Caroline sells each bunch of flowers for Rs. 2. 50. Calculate the Break even point and revenue 11. Monthly profitability
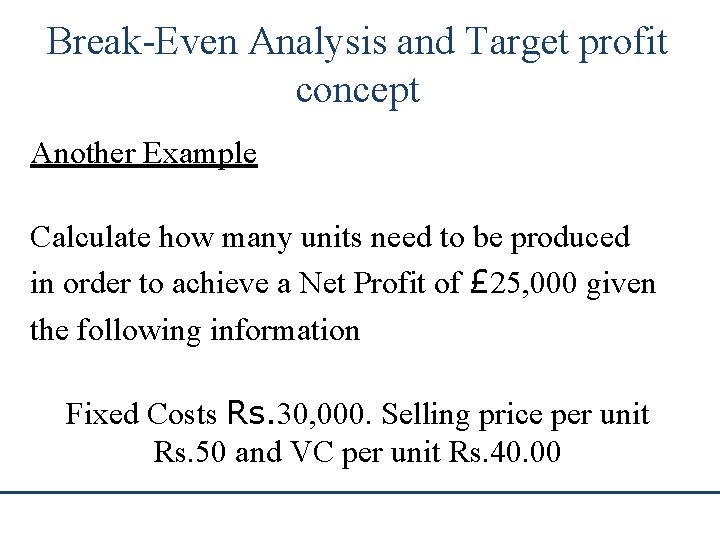
Break-Even Analysis and Target profit concept http: //www. bized. ac. uk Another Example Calculate how many units need to be produced in order to achieve a Net Profit of £ 25, 000 given the following information Fixed Costs Rs. 30, 000. Selling price per unit Rs. 50 and VC per unit Rs. 40. 00

Answer Number of units required to earn a target profit http: //www. bized. ac. uk = Fixed cost + Target Profit / CPU = 30, 000 + 25, 000 / 10. 00 = 55, 00 units
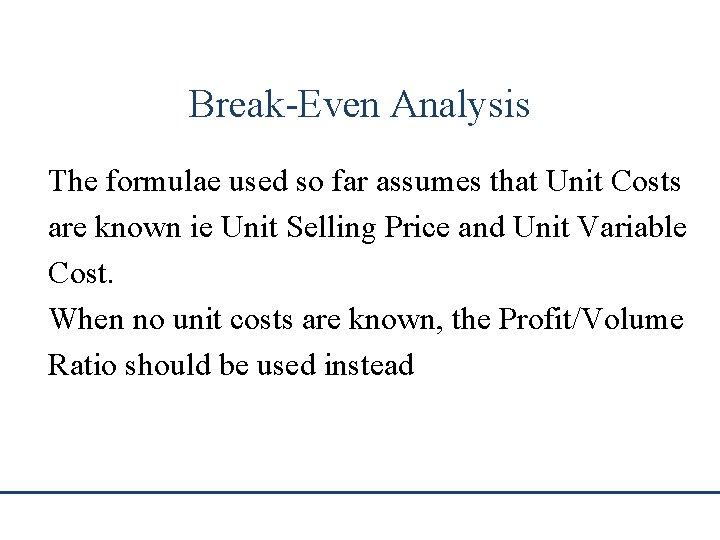
http: //www. bized. ac. uk Break-Even Analysis The formulae used so far assumes that Unit Costs are known ie Unit Selling Price and Unit Variable Cost. When no unit costs are known, the Profit/Volume Ratio should be used instead

Contribution to sales ratio (C/S) http: //www. bized. ac. uk P/V Ratio (Profit/Volume Ratio) = Contribution per unit / Selling price per unit x 100 Higher the C/S ratio higher the profitability of the product. C/S can also be used to calculate the break even revenue Sales at BEP = Fixed Costs / C/S Ratio
Profit/Volume Ratio http: //www. bized. ac. uk For Example Selling price per unit Rs. 80. 00 Variable cost per unit Rs. 40. 00 Fixed Costs Rs. 120, 000 Calculate the C/S Ratio and the BEP value
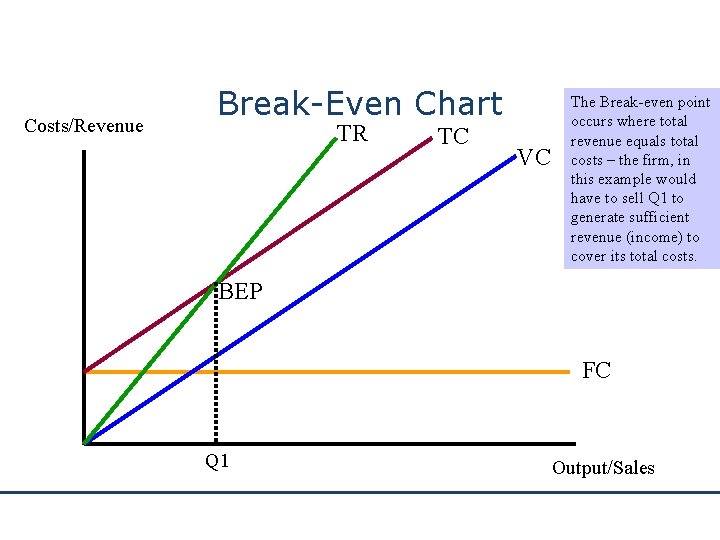
http: //www. bized. ac. uk Costs/Revenue Break-Even Chart TR TC VC The Break-even point occurs where total revenue equals total costs – the firm, in this example would have to sell Q 1 to generate sufficient revenue (income) to cover its total costs. BEP FC Q 1 Output/Sales
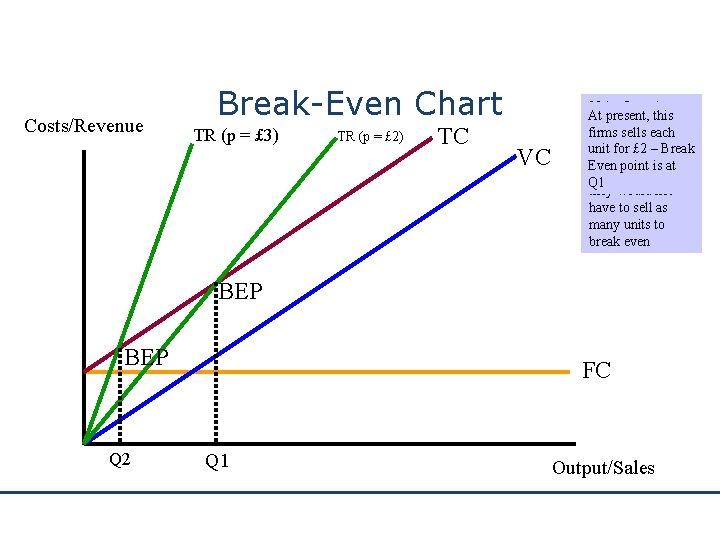
http: //www. bized. ac. uk Costs/Revenue Break-Even Chart TR (p = £ 3) TR (p = £ 2) TC VC If the firm chose At present, this to set price higher firms sells each than £ 2 (say £ 3) unit for £ 2 – Break the TR curve Even point is at would be steeper – Q 1 they would not have to sell as many units to break even BEP Q 2 FC Q 1 Output/Sales
LIMITING FACTORS http: //www. bized. ac. uk • Under normal circumstances, the bestpaying product is that which shows the highest contribution per £ of sales • Certain circumstances make this inappropriate eg • a factory producing a particular range of products may depend on a highly skilled labour force • If skilled labour is in short supply in the locality of the factory, then labour is termed a limiting, or key, factor
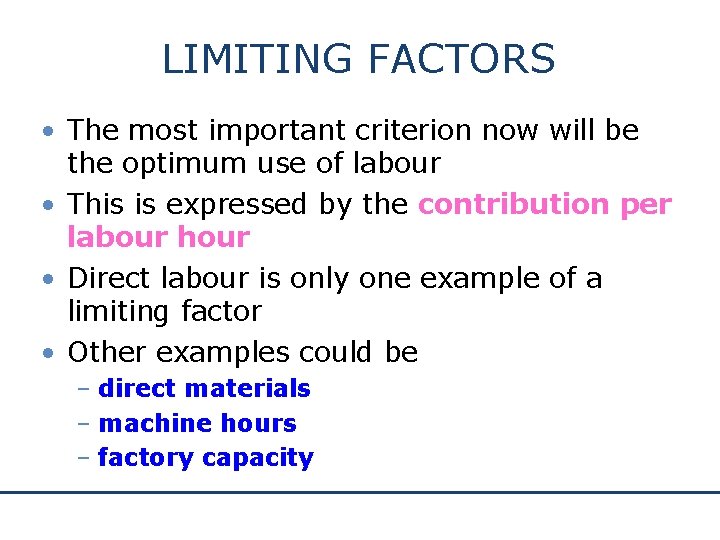
LIMITING FACTORS http: //www. bized. ac. uk • The most important criterion now will be the optimum use of labour • This is expressed by the contribution per labour hour • Direct labour is only one example of a limiting factor • Other examples could be – direct materials – machine hours – factory capacity
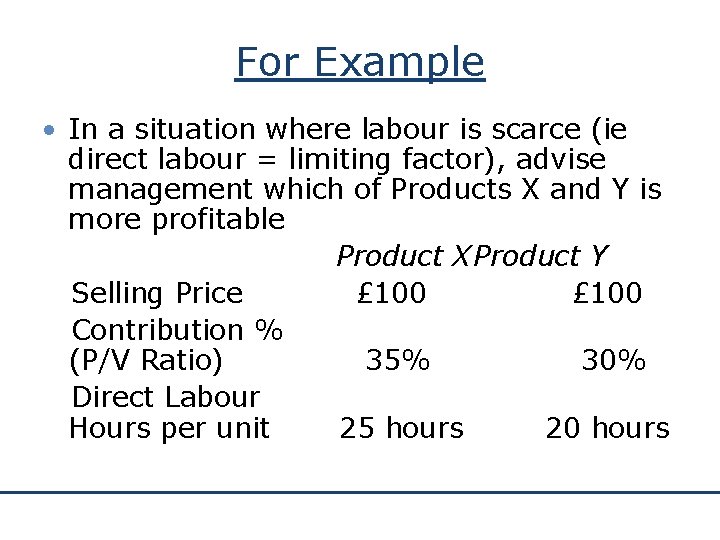
For Example http: //www. bized. ac. uk • In a situation where labour is scarce (ie direct labour = limiting factor), advise management which of Products X and Y is more profitable Product XProduct Y Selling Price £ 100 Contribution % (P/V Ratio) 35% 30% Direct Labour Hours per unit 25 hours 20 hours
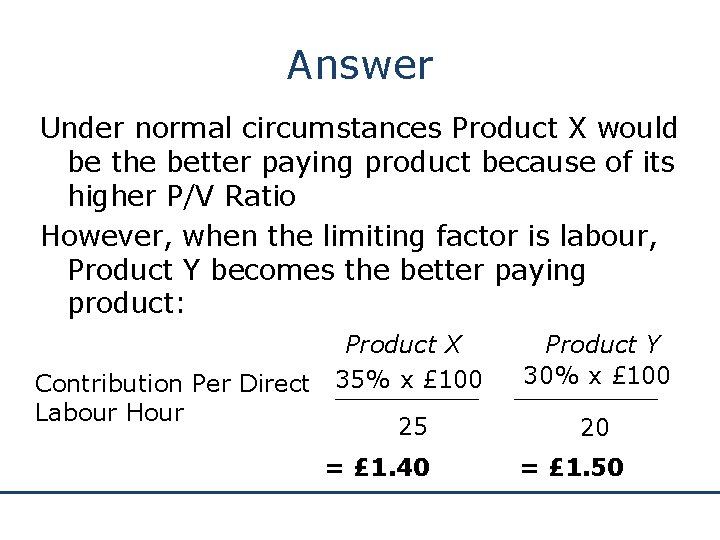
Answer http: //www. bized. ac. uk Under normal circumstances Product X would be the better paying product because of its higher P/V Ratio However, when the limiting factor is labour, Product Y becomes the better paying product: Contribution Per Direct Labour Hour Product X 35% x £ 100 Product Y 30% x £ 100 25 20 = £ 1. 40 = £ 1. 50
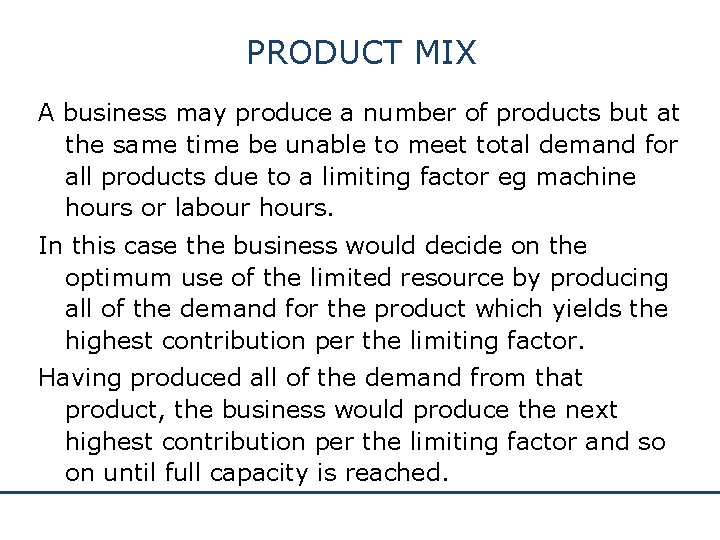
PRODUCT MIX http: //www. bized. ac. uk A business may produce a number of products but at the same time be unable to meet total demand for all products due to a limiting factor eg machine hours or labour hours. In this case the business would decide on the optimum use of the limited resource by producing all of the demand for the product which yields the highest contribution per the limiting factor. Having produced all of the demand from that product, the business would produce the next highest contribution per the limiting factor and so on until full capacity is reached.
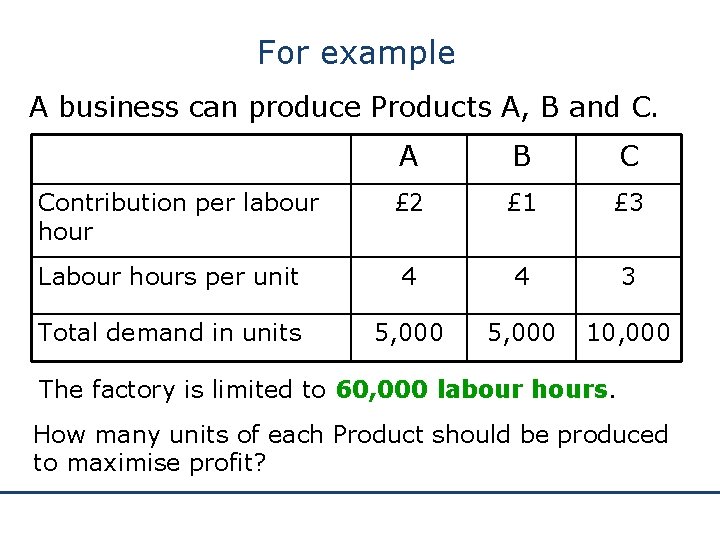
For example http: //www. bized. ac. uk A business can produce Products A, B and C. A B C £ 2 £ 1 £ 3 Labour hours per unit 4 4 3 Total demand in units 5, 000 10, 000 Contribution per labour hour The factory is limited to 60, 000 labour hours. How many units of each Product should be produced to maximise profit?
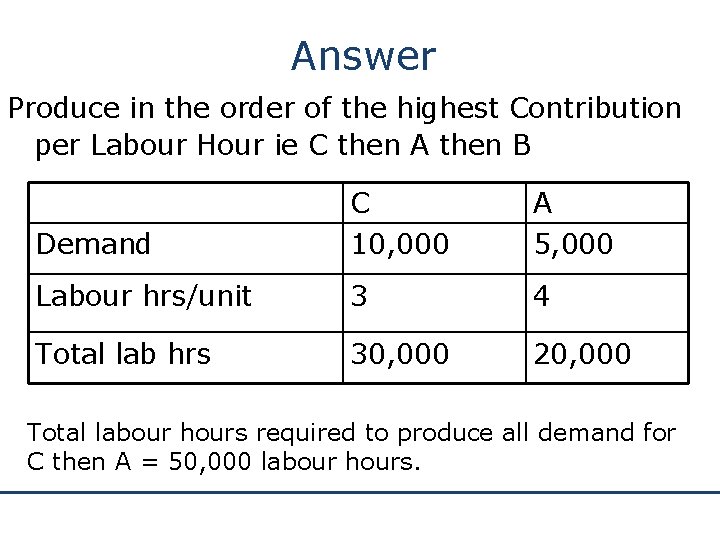
Answer http: //www. bized. ac. uk Produce in the order of the highest Contribution per Labour Hour ie C then A then B Demand C 10, 000 A 5, 000 Labour hrs/unit 3 4 Total lab hrs 30, 000 20, 000 Total labour hours required to produce all demand for C then A = 50, 000 labour hours.
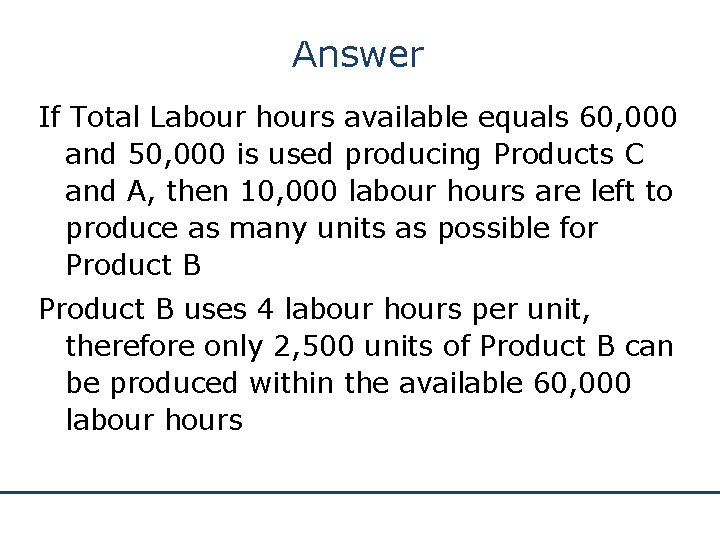
Answer http: //www. bized. ac. uk If Total Labour hours available equals 60, 000 and 50, 000 is used producing Products C and A, then 10, 000 labour hours are left to produce as many units as possible for Product B uses 4 labour hours per unit, therefore only 2, 500 units of Product B can be produced within the available 60, 000 labour hours
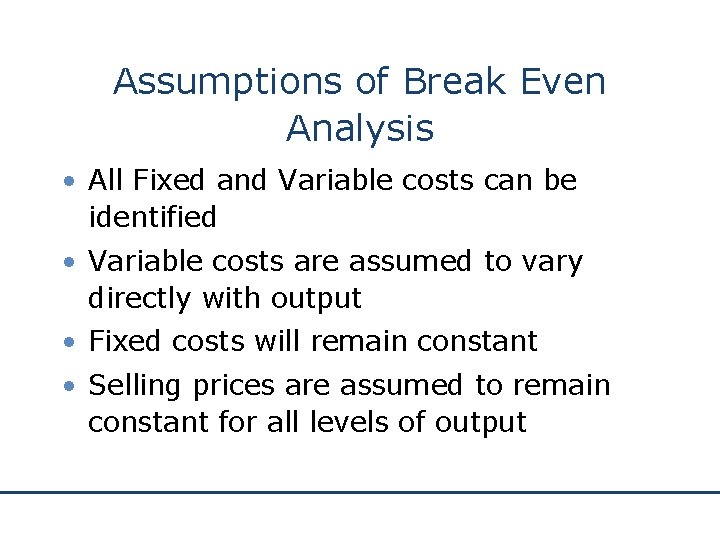
http: //www. bized. ac. uk Assumptions of Break Even Analysis • All Fixed and Variable costs can be identified • Variable costs are assumed to vary directly with output • Fixed costs will remain constant • Selling prices are assumed to remain constant for all levels of output
http: //www. bized. ac. uk Assumptions Continued • The sales mix of products will remain constant – break even charts cannot handle multi-product situations • It is assumed that all production will be sold • The volume of activity is the only relevant factor which will affect costs
Limitations of Break Even Analysis http: //www. bized. ac. uk • Some costs cannot be identified as precisely Fixed or Variable • Semi-variable costs cannot be easily accommodated in break-even analysis • Costs and revenues tend not to be constant • With Fixed costs the assumption that they are constant over the whole range of output from zero to maximum capacity is unrealistic
Limitations Continued http: //www. bized. ac. uk • Price reduction may be necessary to protect sales in the face of increased competition • The sales mix may change with changes in tastes and fashions • Productivity may be affected by strikes and absenteeism • The balance between Fixed and Variable costs may be altered by new technology
- Slides: 35