http Lloyd The Albins comAuto Vacuum Auto Vacuum

http: //Lloyd. The. Albins. com/Auto. Vacuum

Auto. Vacuum By Lloyd Albin
In this presentation we will cover: • Grafana • Custom Postgre. SQL Queries • Data from Graphite - collectd • How to interpret the output of the queries Additional notes in the note section of the slide when you see this icon ( ) in the upper right corner of the slide. © Fred Hutchinson Cancer Research Center 2

Auto. Vacuum What to monitor
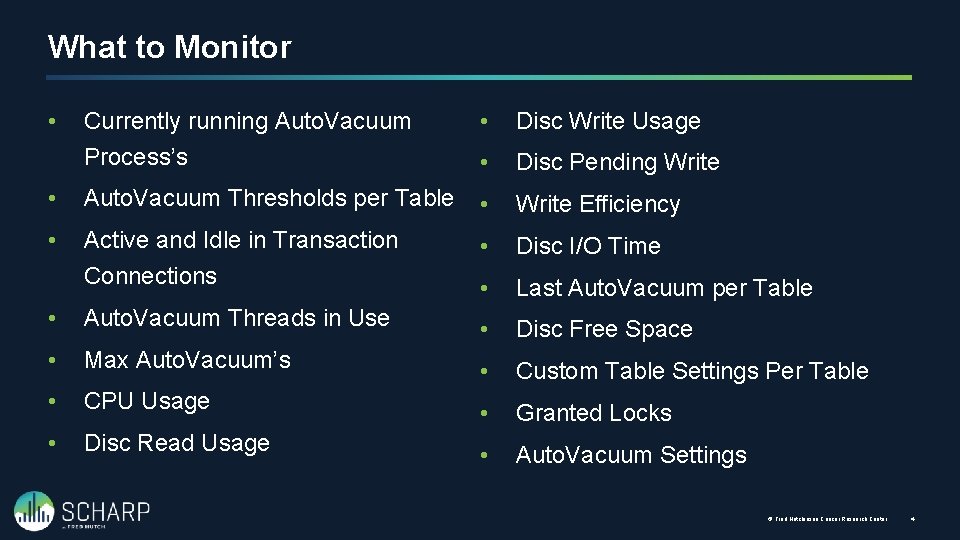
What to Monitor Currently running Auto. Vacuum Process’s • Disc Write Usage • Disc Pending Write • Auto. Vacuum Thresholds per Table • Write Efficiency • Active and Idle in Transaction Connections • Disc I/O Time • Last Auto. Vacuum per Table • Auto. Vacuum Threads in Use • Disc Free Space • Max Auto. Vacuum’s • Custom Table Settings Per Table • CPU Usage • Granted Locks • Disc Read Usage • Auto. Vacuum Settings • © Fred Hutchinson Cancer Research Center 4

Currently Running Auto. Vacuum(s) Knowing what is a happening and the speed at which it is happening. Requires Postgre. SQL 9. 6+
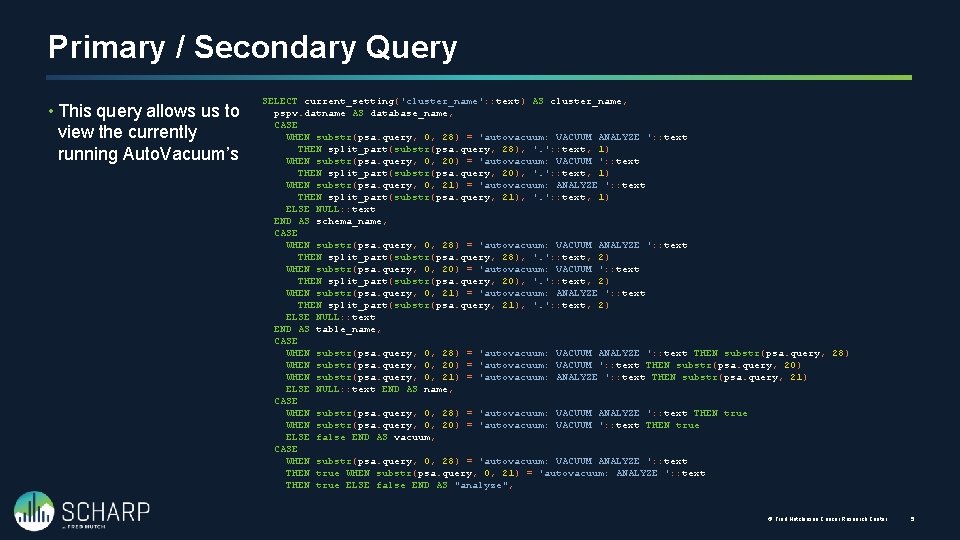
Primary / Secondary Query • This query allows us to view the currently running Auto. Vacuum’s SELECT current_setting('cluster_name': : text) AS cluster_name, pspv. datname AS database_name, CASE WHEN substr(psa. query, 0, 28) = 'autovacuum: VACUUM ANALYZE ': : text THEN split_part(substr(psa. query, 28), '. ': : text, 1) WHEN substr(psa. query, 0, 20) = 'autovacuum: VACUUM ': : text THEN split_part(substr(psa. query, 20), '. ': : text, 1) WHEN substr(psa. query, 0, 21) = 'autovacuum: ANALYZE ': : text THEN split_part(substr(psa. query, 21), '. ': : text, 1) ELSE NULL: : text END AS schema_name, CASE WHEN substr(psa. query, 0, 28) = 'autovacuum: VACUUM ANALYZE ': : text THEN split_part(substr(psa. query, 28), '. ': : text, 2) WHEN substr(psa. query, 0, 20) = 'autovacuum: VACUUM ': : text THEN split_part(substr(psa. query, 20), '. ': : text, 2) WHEN substr(psa. query, 0, 21) = 'autovacuum: ANALYZE ': : text THEN split_part(substr(psa. query, 21), '. ': : text, 2) ELSE NULL: : text END AS table_name, CASE WHEN substr(psa. query, 0, 28) = 'autovacuum: VACUUM ANALYZE ': : text THEN substr(psa. query, 28) WHEN substr(psa. query, 0, 20) = 'autovacuum: VACUUM ': : text THEN substr(psa. query, 20) WHEN substr(psa. query, 0, 21) = 'autovacuum: ANALYZE ': : text THEN substr(psa. query, 21) ELSE NULL: : text END AS name, CASE WHEN substr(psa. query, 0, 28) = 'autovacuum: VACUUM ANALYZE ': : text THEN true WHEN substr(psa. query, 0, 20) = 'autovacuum: VACUUM ': : text THEN true ELSE false END AS vacuum, CASE WHEN substr(psa. query, 0, 28) = 'autovacuum: VACUUM ANALYZE ': : text THEN true WHEN substr(psa. query, 0, 21) = 'autovacuum: ANALYZE ': : text THEN true ELSE false END AS "analyze", © Fred Hutchinson Cancer Research Center 5
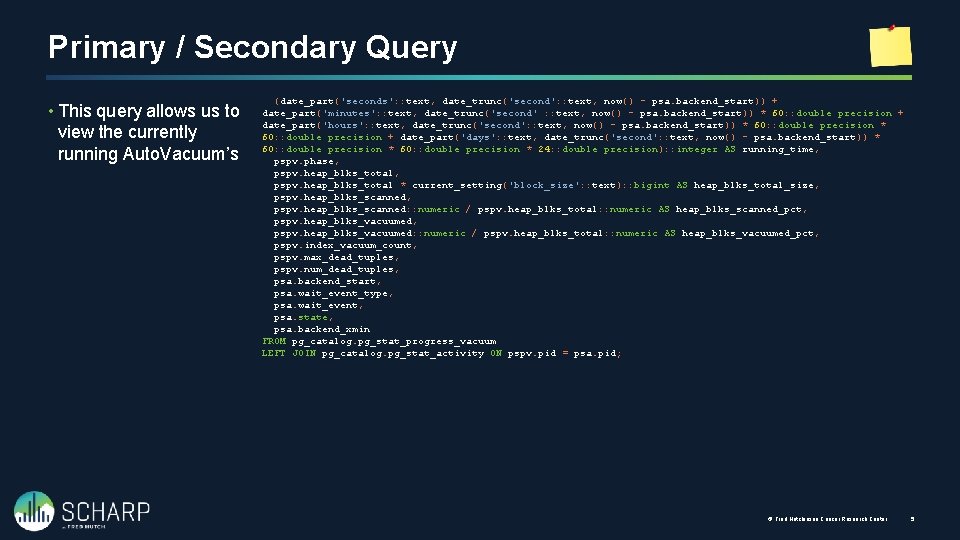
Primary / Secondary Query • This query allows us to view the currently running Auto. Vacuum’s (date_part('seconds': : text, date_trunc('second': : text, now() - psa. backend_start)) + date_part('minutes': : text, date_trunc('second' : : text, now() - psa. backend_start)) * 60: : double precision + date_part('hours': : text, date_trunc('second': : text, now() - psa. backend_start)) * 60: : double precision + date_part('days': : text, date_trunc('second': : text, now() - psa. backend_start)) * 60: : double precision * 24: : double precision): : integer AS running_time, pspv. phase, pspv. heap_blks_total * current_setting('block_size': : text): : bigint AS heap_blks_total_size, pspv. heap_blks_scanned: : numeric / pspv. heap_blks_total: : numeric AS heap_blks_scanned_pct, pspv. heap_blks_vacuumed: : numeric / pspv. heap_blks_total: : numeric AS heap_blks_vacuumed_pct, pspv. index_vacuum_count, pspv. max_dead_tuples, pspv. num_dead_tuples, psa. backend_start, psa. wait_event_type, psa. wait_event, psa. state, psa. backend_xmin FROM pg_catalog. pg_stat_progress_vacuum LEFT JOIN pg_catalog. pg_stat_activity ON pspv. pid = psa. pid; © Fred Hutchinson Cancer Research Center 5
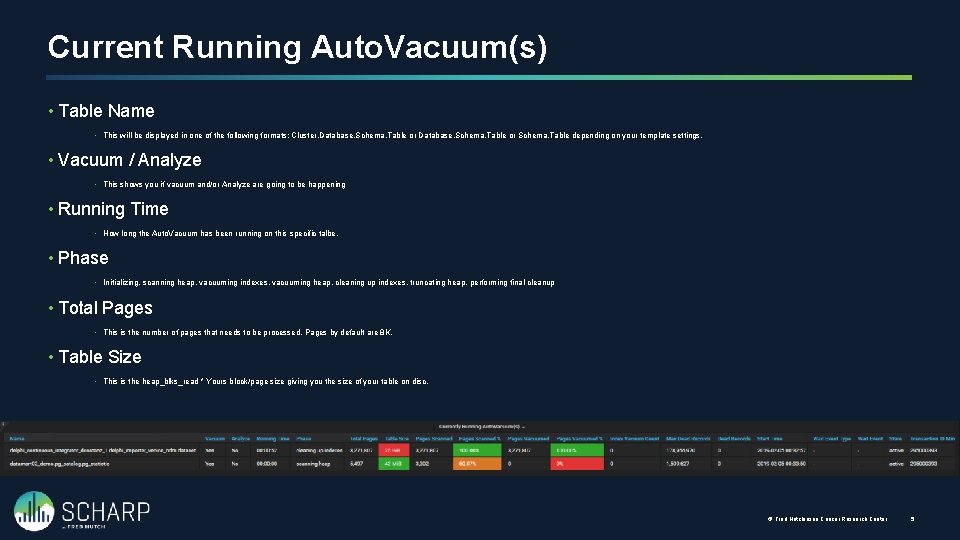
Current Running Auto. Vacuum(s) • Table Name • This will be displayed in one of the following formats: Cluster. Database. Schema. Table or Schema. Table depending on your template settings. • Vacuum / Analyze • This shows you if vacuum and/or Analyze are going to be happening • Running Time • How long the Auto. Vacuum has been running on this specific talbe. • Phase • Initializing, scanning heap, vacuuming indexes, vacuuming heap, cleaning up indexes, truncating heap, performing final cleanup • Total Pages • This is the number of pages that needs to be processed. Pages by default are 8 K. • Table Size • This is the heap_blks_read * Yours block/page size giving you the size of your table on disc. © Fred Hutchinson Cancer Research Center 5
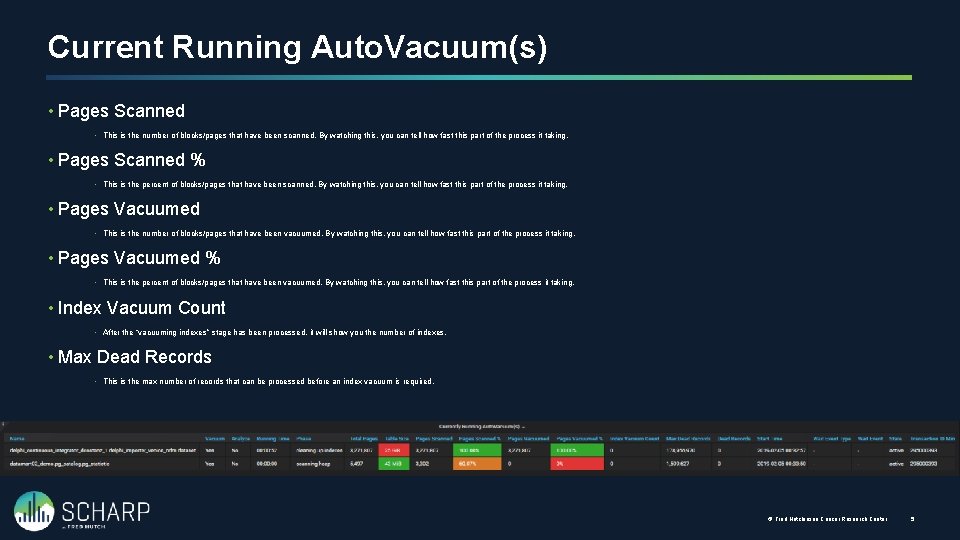
Current Running Auto. Vacuum(s) • Pages Scanned • This is the number of blocks/pages that have been scanned. By watching this, you can tell how fast this part of the process it taking. • Pages Scanned % • This is the percent of blocks/pages that have been scanned. By watching this, you can tell how fast this part of the process it taking. • Pages Vacuumed • This is the number of blocks/pages that have been vacuumed. By watching this, you can tell how fast this part of the process it taking. • Pages Vacuumed % • This is the percent of blocks/pages that have been vacuumed. By watching this, you can tell how fast this part of the process it taking. • Index Vacuum Count • After the “vacuuming indexes” stage has been processed, it will show you the number of indexes. • Max Dead Records • This is the max number of records that can be processed before an index vacuum is required. © Fred Hutchinson Cancer Research Center 5
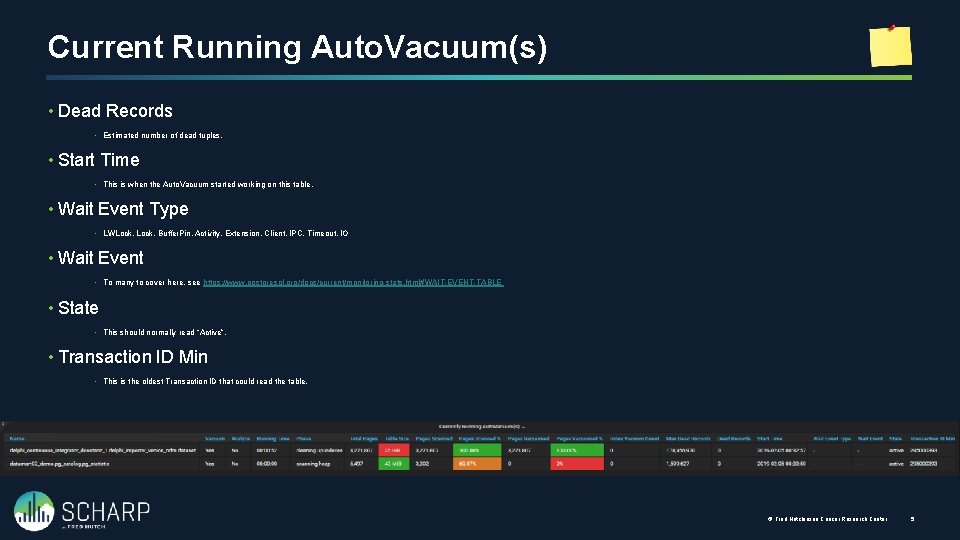
Current Running Auto. Vacuum(s) • Dead Records • Estimated number of dead tuples. • Start Time • This is when the Auto. Vacuum started working on this table. • Wait Event Type • LWLock, Buffer. Pin, Activity, Extension, Client, IPC, Timeout, IO • Wait Event • To many to cover here, see https: //www. postgresql. org/docs/current/monitoring-stats. html#WAIT-EVENT-TABLE • State • This should normally read “Active”. • Transaction ID Min • This is the oldest Transaction ID that could read the table. © Fred Hutchinson Cancer Research Center 5

Auto. Vacuum Thresholds Knowing when a table will be Auto. Vacuum’ed
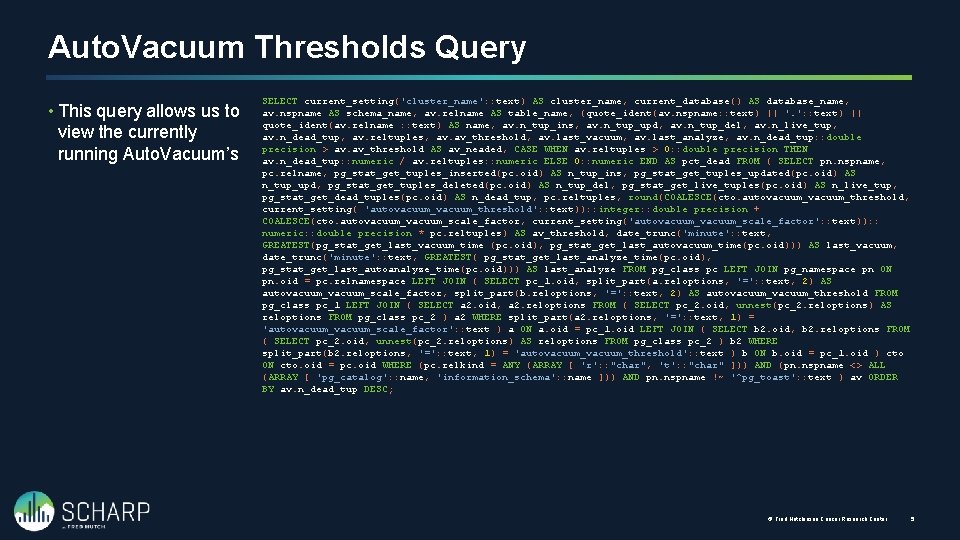
Auto. Vacuum Thresholds Query • This query allows us to view the currently running Auto. Vacuum’s SELECT current_setting('cluster_name': : text) AS cluster_name, current_database() AS database_name, av. nspname AS schema_name, av. relname AS table_name, (quote_ident(av. nspname: : text) || '. ': : text) || quote_ident(av. relname : : text) AS name, av. n_tup_ins, av. n_tup_upd, av. n_tup_del, av. n_live_tup, av. n_dead_tup, av. reltuples, av. av_threshold, av. last_vacuum, av. last_analyze, av. n_dead_tup: : double precision > av. av_threshold AS av_neaded, CASE WHEN av. reltuples > 0: : double precision THEN av. n_dead_tup: : numeric / av. reltuples: : numeric ELSE 0: : numeric END AS pct_dead FROM ( SELECT pn. nspname, pc. relname, pg_stat_get_tuples_inserted(pc. oid) AS n_tup_ins, pg_stat_get_tuples_updated(pc. oid) AS n_tup_upd, pg_stat_get_tuples_deleted(pc. oid) AS n_tup_del, pg_stat_get_live_tuples(pc. oid) AS n_live_tup, pg_stat_get_dead_tuples(pc. oid) AS n_dead_tup, pc. reltuples, round(COALESCE(cto. autovacuum_threshold, current_setting( 'autovacuum_threshold': : text)): : integer: : double precision + COALESCE(cto. autovacuum_scale_factor, current_setting('autovacuum_scale_factor': : text)): : numeric: : double precision * pc. reltuples) AS av_threshold, date_trunc('minute': : text, GREATEST(pg_stat_get_last_vacuum_time (pc. oid), pg_stat_get_last_autovacuum_time(pc. oid))) AS last_vacuum, date_trunc('minute': : text, GREATEST( pg_stat_get_last_analyze_time(pc. oid), pg_stat_get_last_autoanalyze_time(pc. oid))) AS last_analyze FROM pg_class pc LEFT JOIN pg_namespace pn ON pn. oid = pc. relnamespace LEFT JOIN ( SELECT pc_1. oid, split_part(a. reloptions, '=': : text, 2) AS autovacuum_scale_factor, split_part(b. reloptions, '=': : text, 2) AS autovacuum_threshold FROM pg_class pc_1 LEFT JOIN ( SELECT a 2. oid, a 2. reloptions FROM ( SELECT pc_2. oid, unnest(pc_2. reloptions) AS reloptions FROM pg_class pc_2 ) a 2 WHERE split_part(a 2. reloptions, '=': : text, 1) = 'autovacuum_scale_factor': : text ) a ON a. oid = pc_1. oid LEFT JOIN ( SELECT b 2. oid, b 2. reloptions FROM ( SELECT pc_2. oid, unnest(pc_2. reloptions) AS reloptions FROM pg_class pc_2 ) b 2 WHERE split_part(b 2. reloptions, '=': : text, 1) = 'autovacuum_threshold': : text ) b ON b. oid = pc_1. oid ) cto ON cto. oid = pc. oid WHERE (pc. relkind = ANY (ARRAY [ 'r': : "char", 't': : "char" ])) AND (pn. nspname <> ALL (ARRAY [ 'pg_catalog': : name, 'information_schema': : name ])) AND pn. nspname !~ '^pg_toast': : text ) av ORDER BY av. n_dead_tup DESC; © Fred Hutchinson Cancer Research Center 5
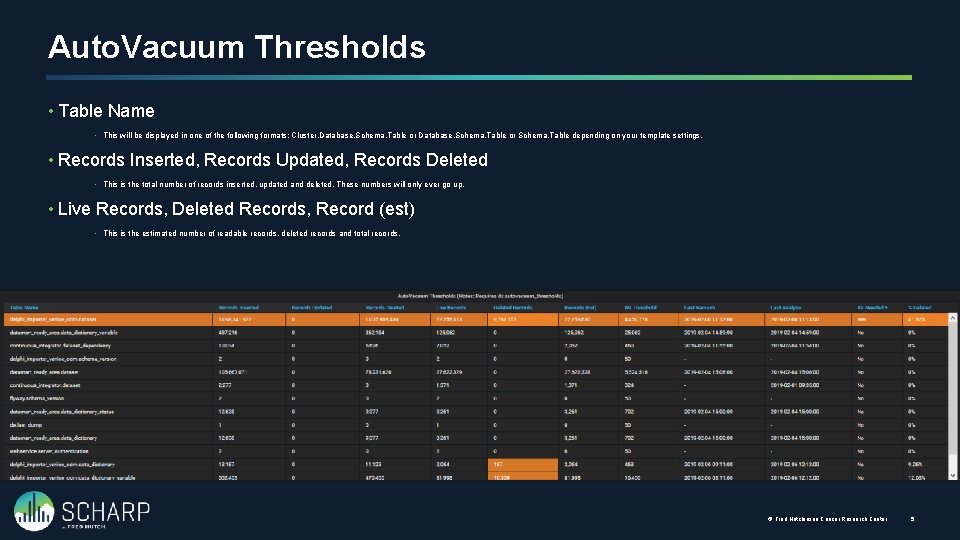
Auto. Vacuum Thresholds • Table Name • This will be displayed in one of the following formats: Cluster. Database. Schema. Table or Schema. Table depending on your template settings. • Records Inserted, Records Updated, Records Deleted • This is the total number of records inserted, updated and deleted. These numbers will only ever go up. • Live Records, Deleted Records, Record (est) • This is the estimated number of readable records, deleted records and total records. © Fred Hutchinson Cancer Research Center 5
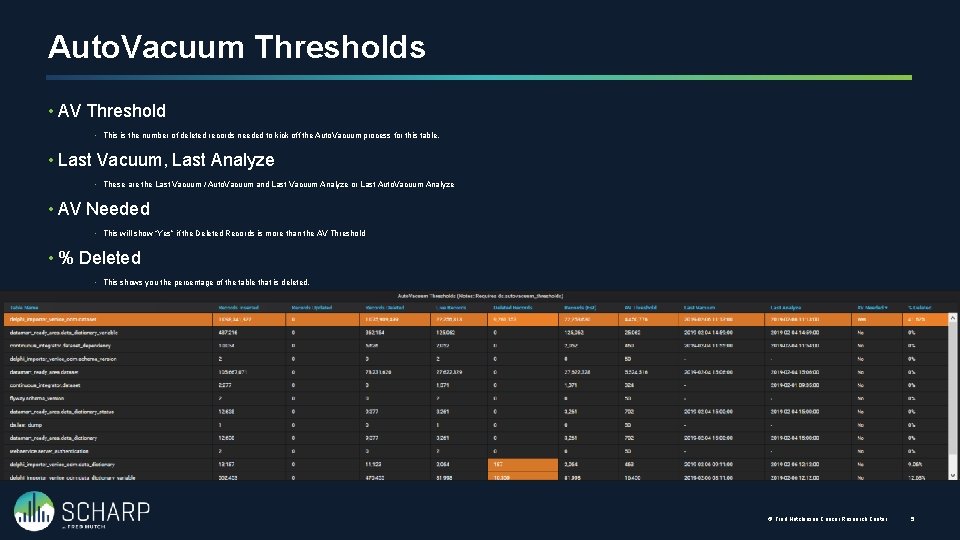
Auto. Vacuum Thresholds • AV Threshold • This is the number of deleted records needed to kick off the Auto. Vacuum process for this table. • Last Vacuum, Last Analyze • These are the Last Vacuum / Auto. Vacuum and Last Vacuum Analyze or Last Auto. Vacuum Analyze • AV Needed • This will show “Yes” if the Deleted Records is more than the AV Threshold • % Deleted • This shows you the percentage of the table that is deleted. © Fred Hutchinson Cancer Research Center 5

Active and Idle in Transaction Knowing what might be holding locks to prevent Auto. Vacuum

Active and Idle in Transaction • Process ID • This is the number of deleted records needed to kick off the Auto. Vacuum process for this table. • Database Name • These are the Last Vacuum / Auto. Vacuum and Last Vacuum Analyze or Last Auto. Vacuum Analyze • State • This will show “Yes” if the Deleted Records is more than the AV Threshold • Application Name • This shows you the percentage of the table that is deleted. • Backend Type • This shows you the percentage of the table that is deleted. © Fred Hutchinson Cancer Research Center 5
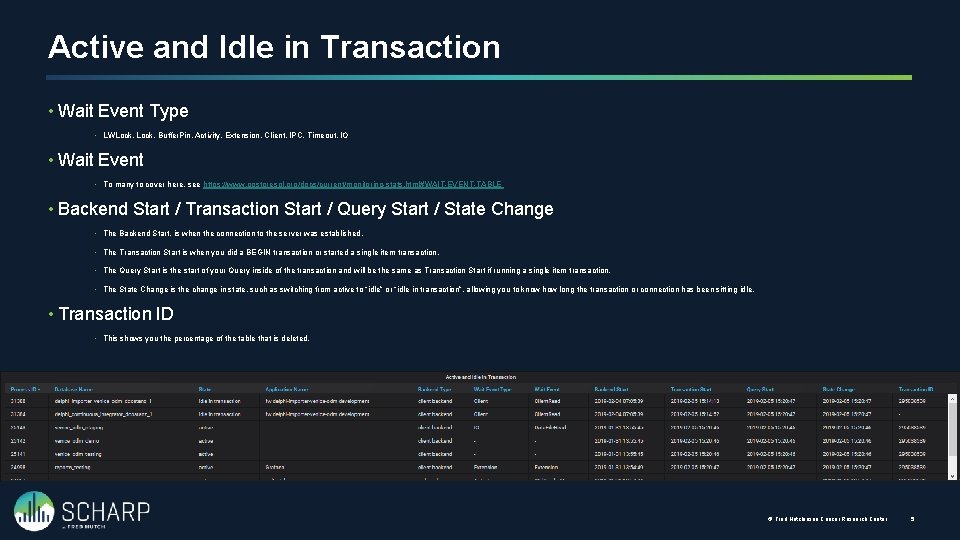
Active and Idle in Transaction • Wait Event Type • LWLock, Buffer. Pin, Activity, Extension, Client, IPC, Timeout, IO • Wait Event • To many to cover here, see https: //www. postgresql. org/docs/current/monitoring-stats. html#WAIT-EVENT-TABLE • Backend Start / Transaction Start / Query Start / State Change • The Backend Start, is when the connection to the server was established. • The Transaction Start is when you did a BEGIN transaction or started a single item transaction. • The Query Start is the start of your Query inside of the transaction and will be the same as Transaction Start if running a single item transaction. • The State Change is the change in state, such as switching from active to “idle” or “idle in transaction”, allowing you to know how long the transaction or connection has been sitting idle. • Transaction ID • This shows you the percentage of the table that is deleted. © Fred Hutchinson Cancer Research Center 5
Current Drive Performance Monitoring current drive performance
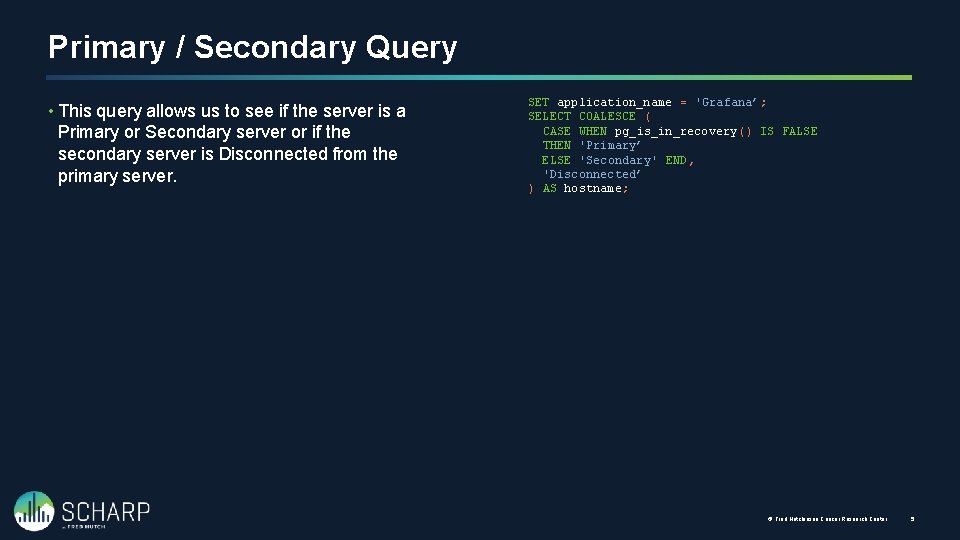
Primary / Secondary Query • This query allows us to see if the server is a Primary or Secondary server or if the secondary server is Disconnected from the primary server. SET application_name = 'Grafana’; SELECT COALESCE ( CASE WHEN pg_is_in_recovery() IS FALSE THEN 'Primary’ ELSE 'Secondary' END, 'Disconnected’ ) AS hostname; © Fred Hutchinson Cancer Research Center 5
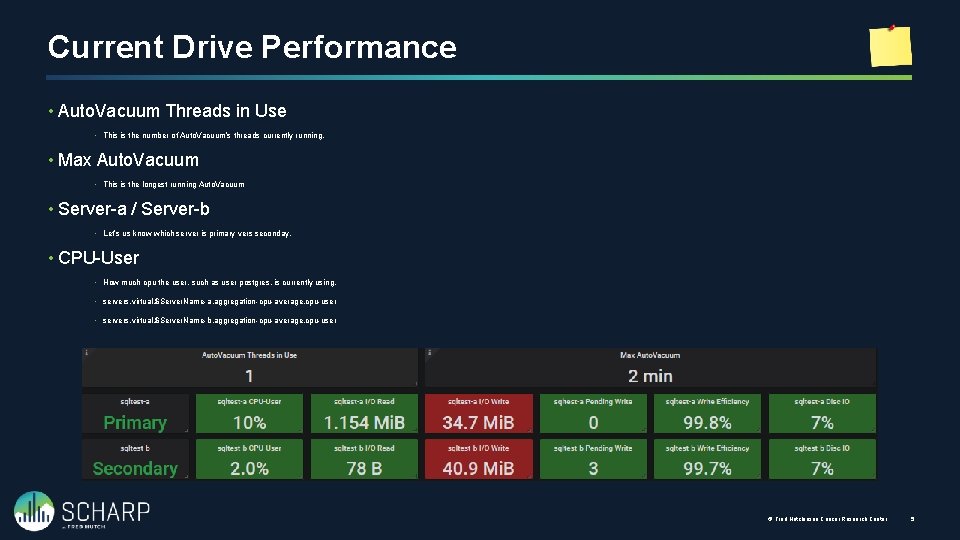
Current Drive Performance • Auto. Vacuum Threads in Use • This is the number of Auto. Vacuum’s threads currently running. • Max Auto. Vacuum • This is the longest running Auto. Vacuum • Server-a / Server-b • Let’s us know which server is primary vers seconday. • CPU-User • How much cpu the user, such as user postgres, is currently using. • servers. virtual. $Server. Name-a. aggregation-cpu-average. cpu-user • servers. virtual. $Server. Name-b. aggregation-cpu-average. cpu-user © Fred Hutchinson Cancer Research Center 5
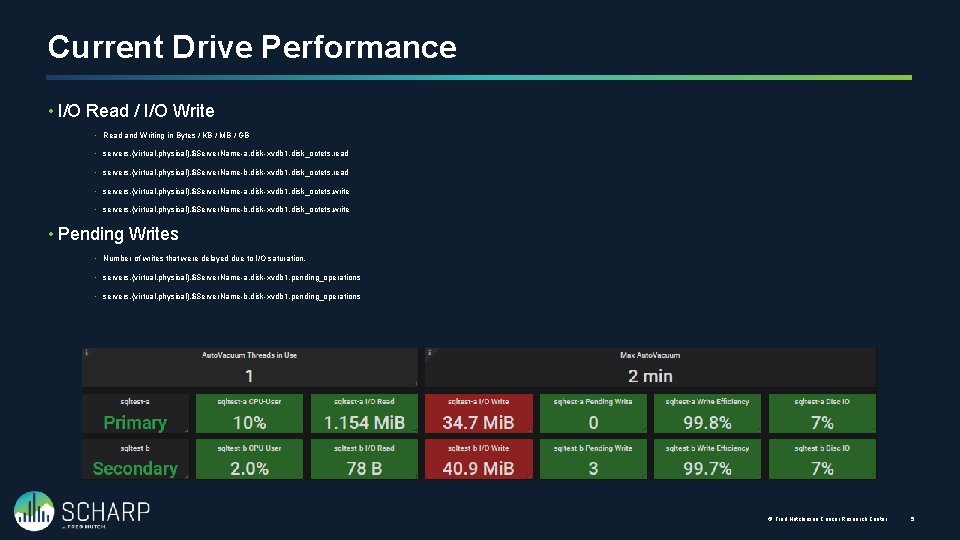
Current Drive Performance • I/O Read / I/O Write • Read and Writing in Bytes / KB / MB / GB • servers. {virtual, physical}. $Server. Name-a. disk-xvdb 1. disk_octets. read • servers. {virtual, physical}. $Server. Name-b. disk-xvdb 1. disk_octets. read • servers. {virtual, physical}. $Server. Name-a. disk-xvdb 1. disk_octets. write • servers. {virtual, physical}. $Server. Name-b. disk-xvdb 1. disk_octets. write • Pending Writes • Number of writes that were delayed due to I/O saturation. • servers. {virtual, physical}. $Server. Name-a. disk-xvdb 1. pending_operations • servers. {virtual, physical}. $Server. Name-b. disk-xvdb 1. pending_operations © Fred Hutchinson Cancer Research Center 5
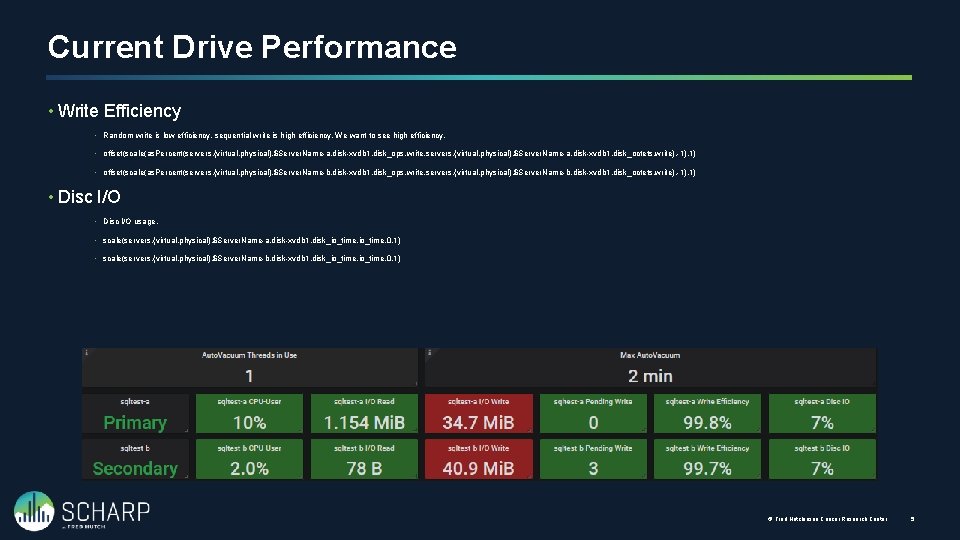
Current Drive Performance • Write Efficiency • Random write is low efficiency, sequential write is high efficiency. We want to see high efficiency. • offset(scale(as. Percent(servers. {virtual, physical}. $Server. Name-a. disk-xvdb 1. disk_ops. write, servers. {virtual, physical}. $Server. Name-a. disk-xvdb 1. disk_octets. write), -1), 1) • offset(scale(as. Percent(servers. {virtual, physical}. $Server. Name-b. disk-xvdb 1. disk_ops. write, servers. {virtual, physical}. $Server. Name-b. disk-xvdb 1. disk_octets. write), -1), 1) • Disc I/O usage. • scale(servers. {virtual, physical}. $Server. Name-a. disk-xvdb 1. disk_io_time, 0. 1) • scale(servers. {virtual, physical}. $Server. Name-b. disk-xvdb 1. disk_io_time, 0. 1) © Fred Hutchinson Cancer Research Center 5
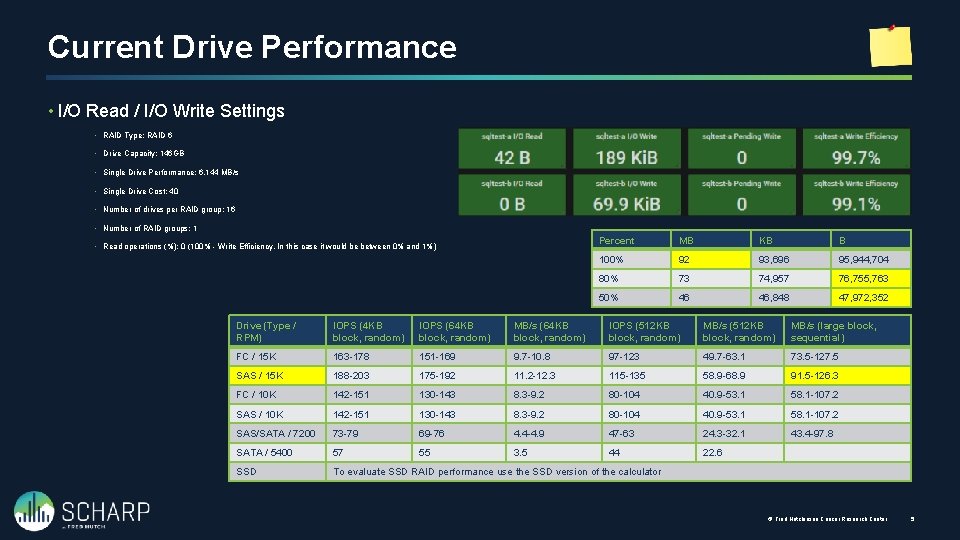
Current Drive Performance • I/O Read / I/O Write Settings • RAID Type: RAID 6 • Drive Capacity: 146 GB • Single Drive Performance: 6, 144 MB/s • Single Drive Cost: 40 • Number of drives per RAID group: 16 • Number of RAID groups: 1 • Read operations (%): 0 (100% - Write Efficiency, In this case it would be between 0% and 1%) Percent MB KB B 100% 92 93, 696 95, 944, 704 80% 73 74, 957 76, 755, 763 50% 46 46, 848 47, 972, 352 Drive (Type / RPM) IOPS (4 KB block, random) IOPS (64 KB block, random) MB/s (64 KB block, random) IOPS (512 KB block, random) MB/s (large block, sequential) FC / 15 K 163 -178 151 -169 9. 7 -10. 8 97 -123 49. 7 -63. 1 73. 5 -127. 5 SAS / 15 K 188 -203 175 -192 11. 2 -12. 3 115 -135 58. 9 -68. 9 91. 5 -126. 3 FC / 10 K 142 -151 130 -143 8. 3 -9. 2 80 -104 40. 9 -53. 1 58. 1 -107. 2 SAS/SATA / 7200 73 -79 69 -76 4. 4 -4. 9 47 -63 24. 3 -32. 1 43. 4 -97. 8 SATA / 5400 57 55 3. 5 44 22. 6 SSD To evaluate SSD RAID performance use the SSD version of the calculator © Fred Hutchinson Cancer Research Center 5
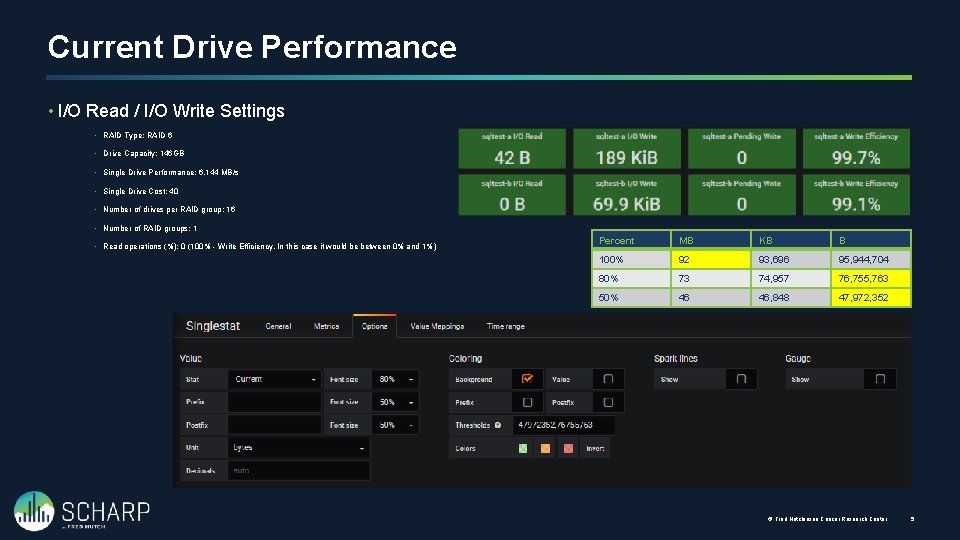
Current Drive Performance • I/O Read / I/O Write Settings • RAID Type: RAID 6 • Drive Capacity: 146 GB • Single Drive Performance: 6, 144 MB/s • Single Drive Cost: 40 • Number of drives per RAID group: 16 • Number of RAID groups: 1 • Read operations (%): 0 (100% - Write Efficiency, In this case it would be between 0% and 1%) Percent MB KB B 100% 92 93, 696 95, 944, 704 80% 73 74, 957 76, 755, 763 50% 46 46, 848 47, 972, 352 © Fred Hutchinson Cancer Research Center 5

Performance History Monitoring history as thing happen when we are not in front of the monitors.
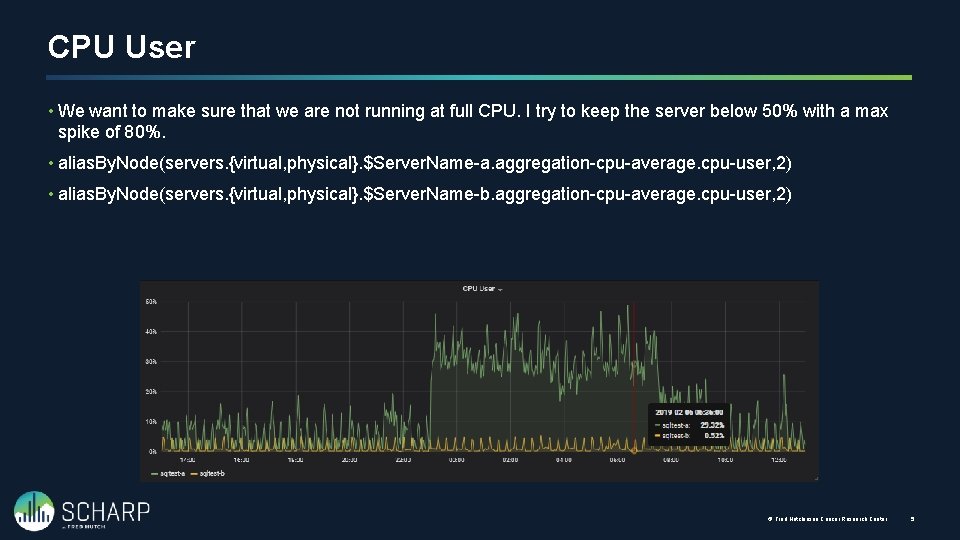
CPU User • We want to make sure that we are not running at full CPU. I try to keep the server below 50% with a max spike of 80%. • alias. By. Node(servers. {virtual, physical}. $Server. Name-a. aggregation-cpu-average. cpu-user, 2) • alias. By. Node(servers. {virtual, physical}. $Server. Name-b. aggregation-cpu-average. cpu-user, 2) © Fred Hutchinson Cancer Research Center 5
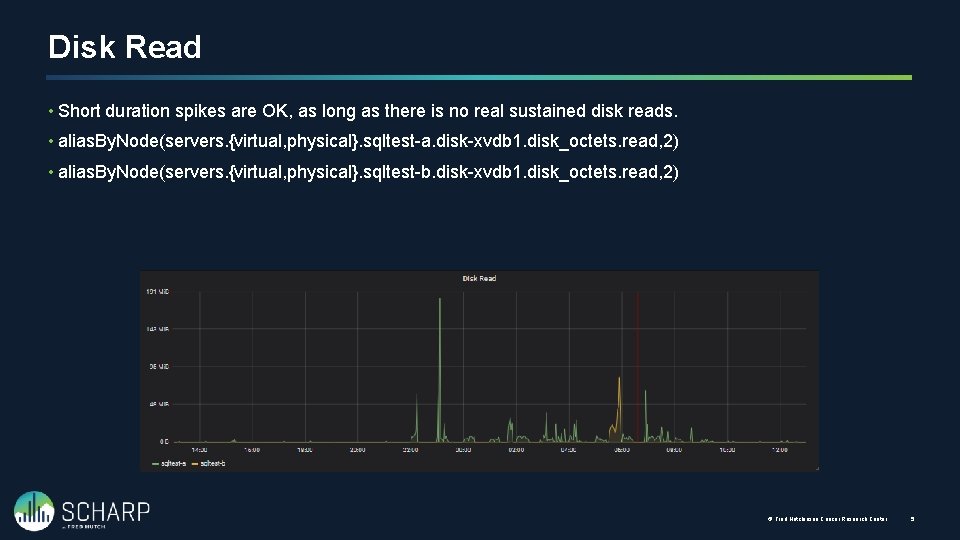
Disk Read • Short duration spikes are OK, as long as there is no real sustained disk reads. • alias. By. Node(servers. {virtual, physical}. sqltest-a. disk-xvdb 1. disk_octets. read, 2) • alias. By. Node(servers. {virtual, physical}. sqltest-b. disk-xvdb 1. disk_octets. read, 2) © Fred Hutchinson Cancer Research Center 5
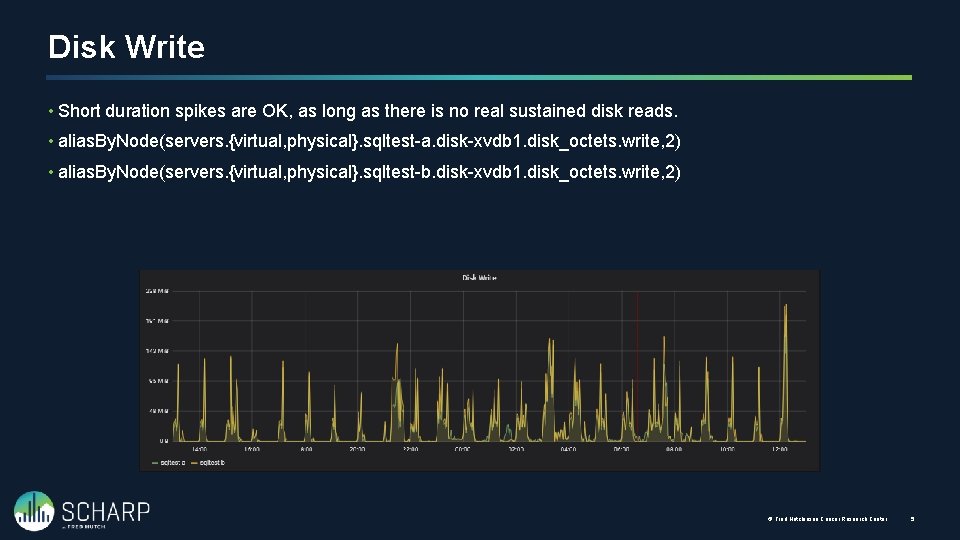
Disk Write • Short duration spikes are OK, as long as there is no real sustained disk reads. • alias. By. Node(servers. {virtual, physical}. sqltest-a. disk-xvdb 1. disk_octets. write, 2) • alias. By. Node(servers. {virtual, physical}. sqltest-b. disk-xvdb 1. disk_octets. write, 2) © Fred Hutchinson Cancer Research Center 5
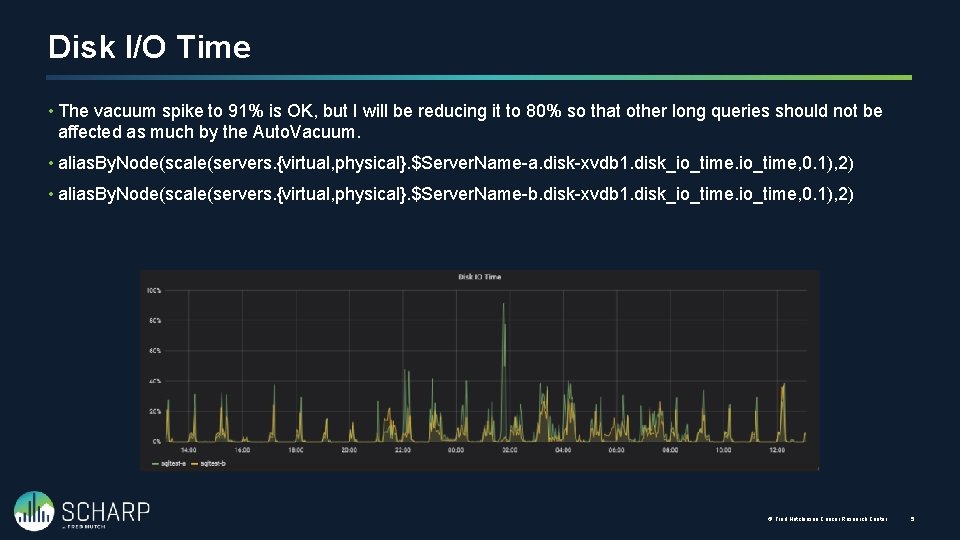
Disk I/O Time • The vacuum spike to 91% is OK, but I will be reducing it to 80% so that other long queries should not be affected as much by the Auto. Vacuum. • alias. By. Node(scale(servers. {virtual, physical}. $Server. Name-a. disk-xvdb 1. disk_io_time, 0. 1), 2) • alias. By. Node(scale(servers. {virtual, physical}. $Server. Name-b. disk-xvdb 1. disk_io_time, 0. 1), 2) © Fred Hutchinson Cancer Research Center 5
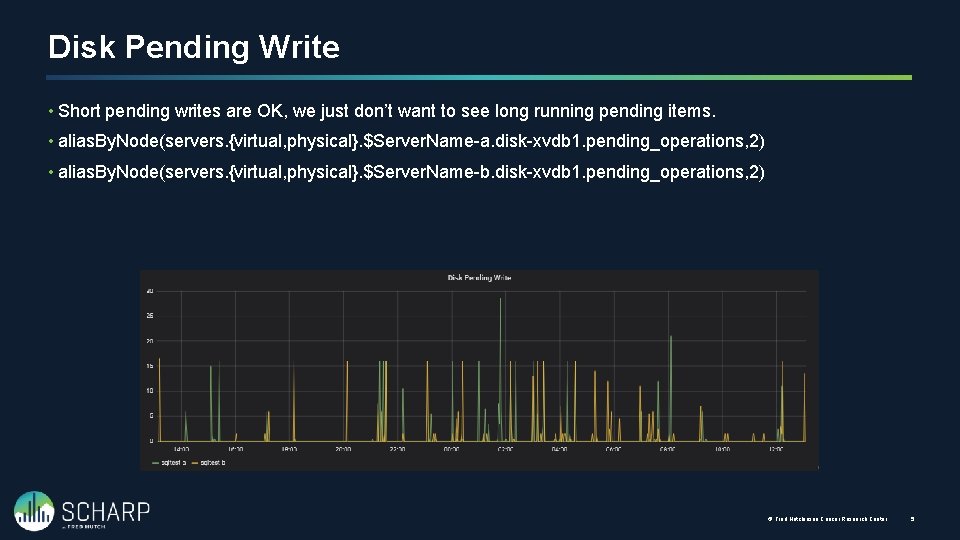
Disk Pending Write • Short pending writes are OK, we just don’t want to see long running pending items. • alias. By. Node(servers. {virtual, physical}. $Server. Name-a. disk-xvdb 1. pending_operations, 2) • alias. By. Node(servers. {virtual, physical}. $Server. Name-b. disk-xvdb 1. pending_operations, 2) © Fred Hutchinson Cancer Research Center 5
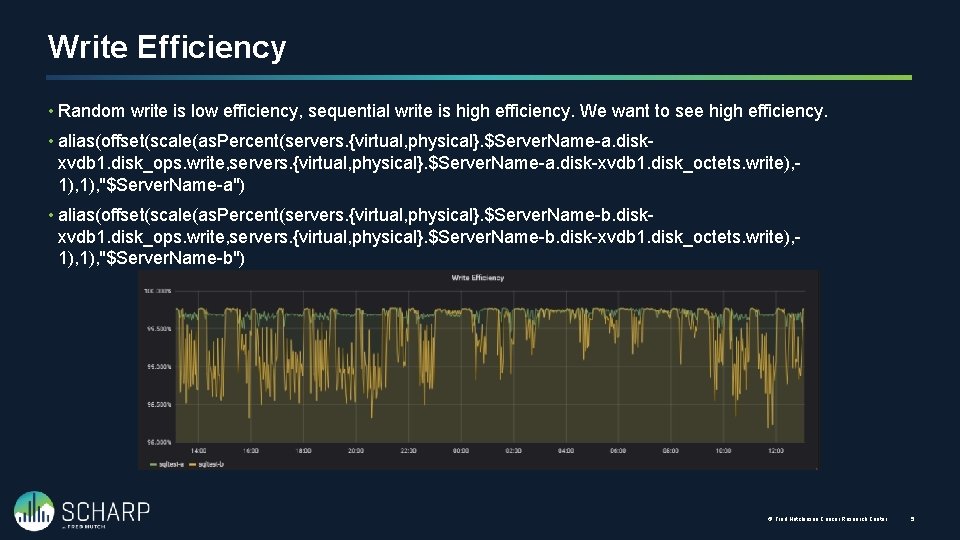
Write Efficiency • Random write is low efficiency, sequential write is high efficiency. We want to see high efficiency. • alias(offset(scale(as. Percent(servers. {virtual, physical}. $Server. Name-a. diskxvdb 1. disk_ops. write, servers. {virtual, physical}. $Server. Name-a. disk-xvdb 1. disk_octets. write), 1), "$Server. Name-a") • alias(offset(scale(as. Percent(servers. {virtual, physical}. $Server. Name-b. diskxvdb 1. disk_ops. write, servers. {virtual, physical}. $Server. Name-b. disk-xvdb 1. disk_octets. write), 1), "$Server. Name-b") © Fred Hutchinson Cancer Research Center 5
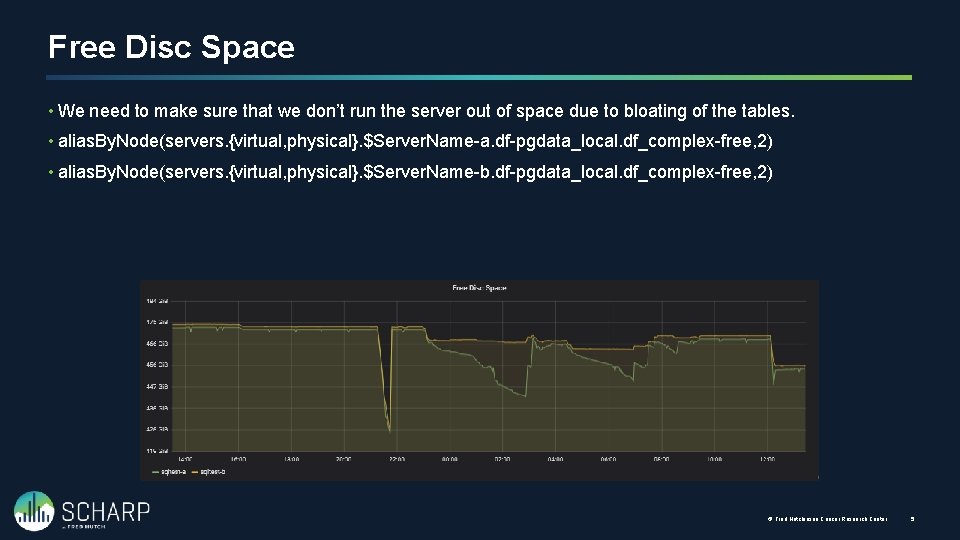
Free Disc Space • We need to make sure that we don’t run the server out of space due to bloating of the tables. • alias. By. Node(servers. {virtual, physical}. $Server. Name-a. df-pgdata_local. df_complex-free, 2) • alias. By. Node(servers. {virtual, physical}. $Server. Name-b. df-pgdata_local. df_complex-free, 2) © Fred Hutchinson Cancer Research Center 5
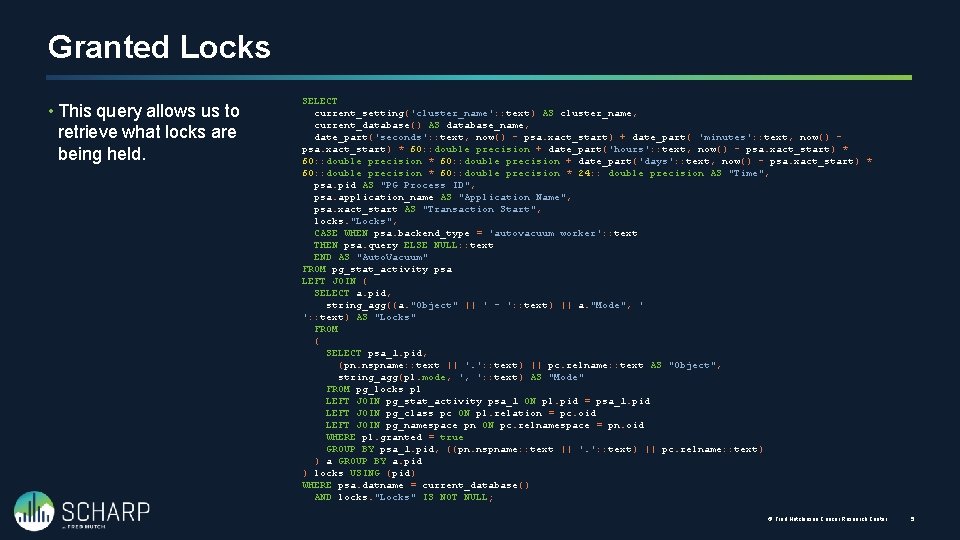
Granted Locks • This query allows us to retrieve what locks are being held. SELECT current_setting('cluster_name': : text) AS cluster_name, current_database() AS database_name, date_part('seconds': : text, now() - psa. xact_start) + date_part( 'minutes': : text, now() psa. xact_start) * 60: : double precision + date_part('hours': : text, now() - psa. xact_start) * 60: : double precision + date_part('days': : text, now() - psa. xact_start) * 60: : double precision * 24: : double precision AS "Time", psa. pid AS "PG Process ID", psa. application_name AS "Application Name", psa. xact_start AS "Transaction Start", locks. "Locks", CASE WHEN psa. backend_type = 'autovacuum worker': : text THEN psa. query ELSE NULL: : text END AS "Auto. Vacuum" FROM pg_stat_activity psa LEFT JOIN ( SELECT a. pid, string_agg((a. "Object" || ' - ': : text) || a. "Mode", ' ': : text) AS "Locks" FROM ( SELECT psa_1. pid, (pn. nspname: : text || '. ': : text) || pc. relname: : text AS "Object", string_agg(pl. mode, ', ': : text) AS "Mode" FROM pg_locks pl LEFT JOIN pg_stat_activity psa_1 ON pl. pid = psa_1. pid LEFT JOIN pg_class pc ON pl. relation = pc. oid LEFT JOIN pg_namespace pn ON pc. relnamespace = pn. oid WHERE pl. granted = true GROUP BY psa_1. pid, ((pn. nspname: : text || '. ': : text) || pc. relname: : text) ) a GROUP BY a. pid ) locks USING (pid) WHERE psa. datname = current_database() AND locks. "Locks" IS NOT NULL; © Fred Hutchinson Cancer Research Center 5
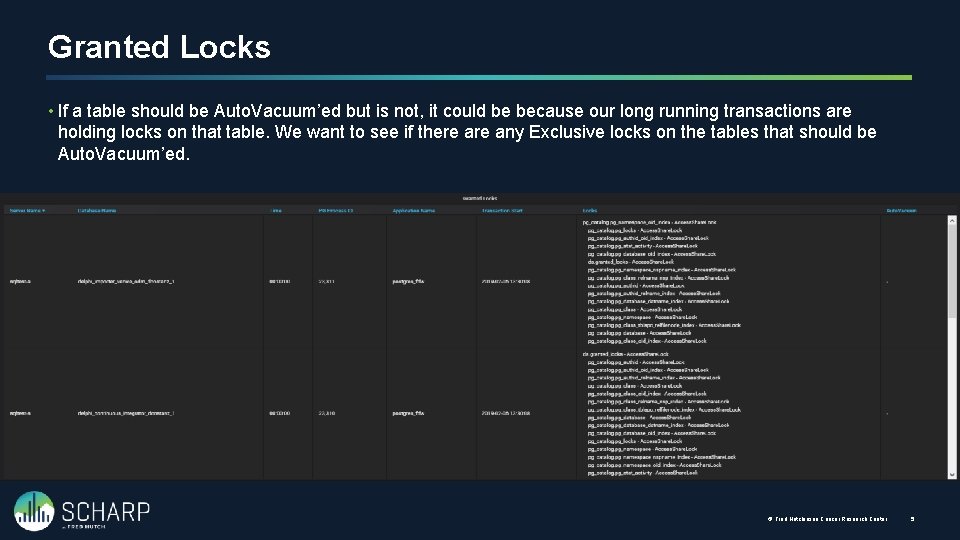
Granted Locks • If a table should be Auto. Vacuum’ed but is not, it could be because our long running transactions are holding locks on that table. We want to see if there any Exclusive locks on the tables that should be Auto. Vacuum’ed. © Fred Hutchinson Cancer Research Center 5

Custom Table Settings Adjusting the Auto. Vacuum per Table
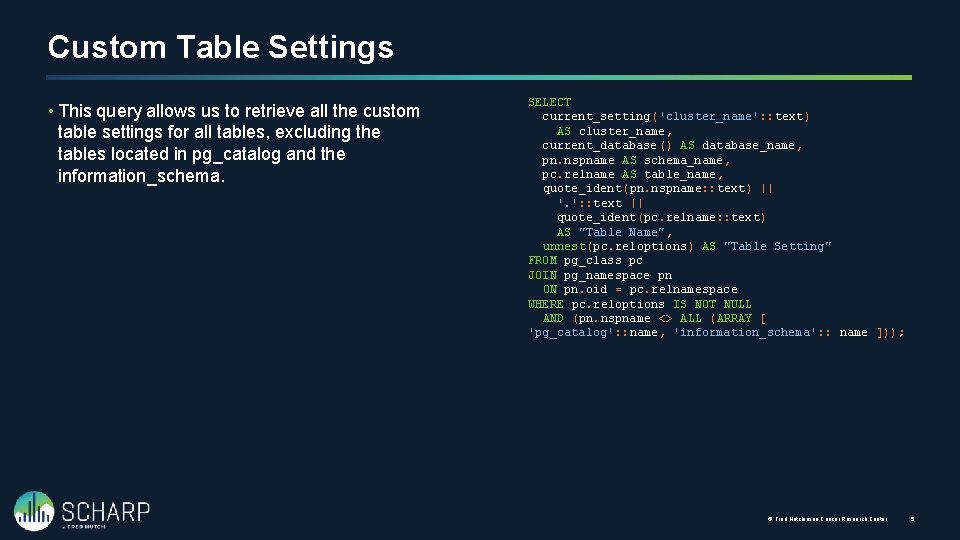
Custom Table Settings • This query allows us to retrieve all the custom table settings for all tables, excluding the tables located in pg_catalog and the information_schema. SELECT current_setting('cluster_name': : text) AS cluster_name, current_database() AS database_name, pn. nspname AS schema_name, pc. relname AS table_name, quote_ident(pn. nspname: : text) || '. ': : text || quote_ident(pc. relname: : text) AS "Table Name", unnest(pc. reloptions) AS "Table Setting" FROM pg_class pc JOIN pg_namespace pn ON pn. oid = pc. relnamespace WHERE pc. reloptions IS NOT NULL AND (pn. nspname <> ALL (ARRAY [ 'pg_catalog': : name, 'information_schema': : name ])); © Fred Hutchinson Cancer Research Center 5
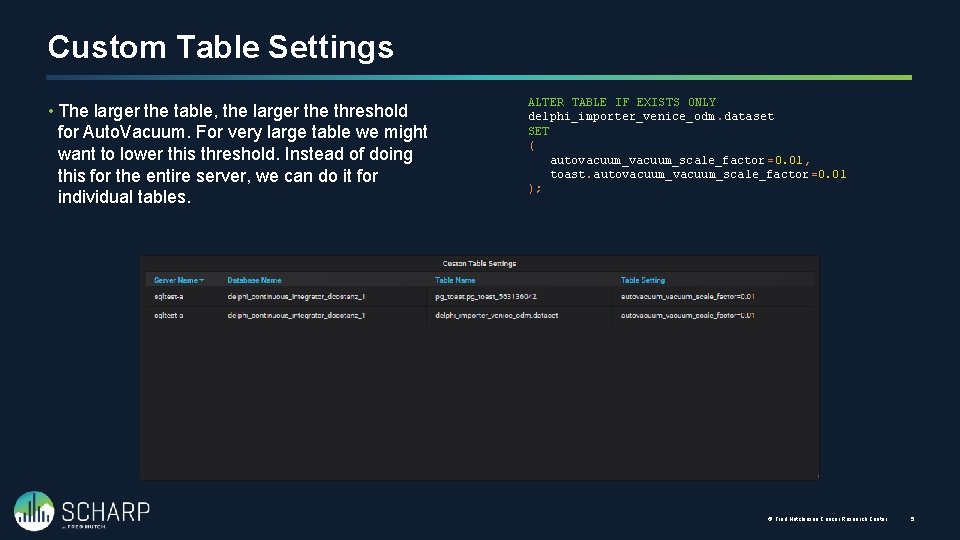
Custom Table Settings • The larger the table, the larger the threshold for Auto. Vacuum. For very large table we might want to lower this threshold. Instead of doing this for the entire server, we can do it for individual tables. ALTER TABLE IF EXISTS ONLY delphi_importer_venice_odm. dataset SET ( autovacuum_scale_factor =0. 01, toast. autovacuum_scale_factor =0. 01 ); © Fred Hutchinson Cancer Research Center 5
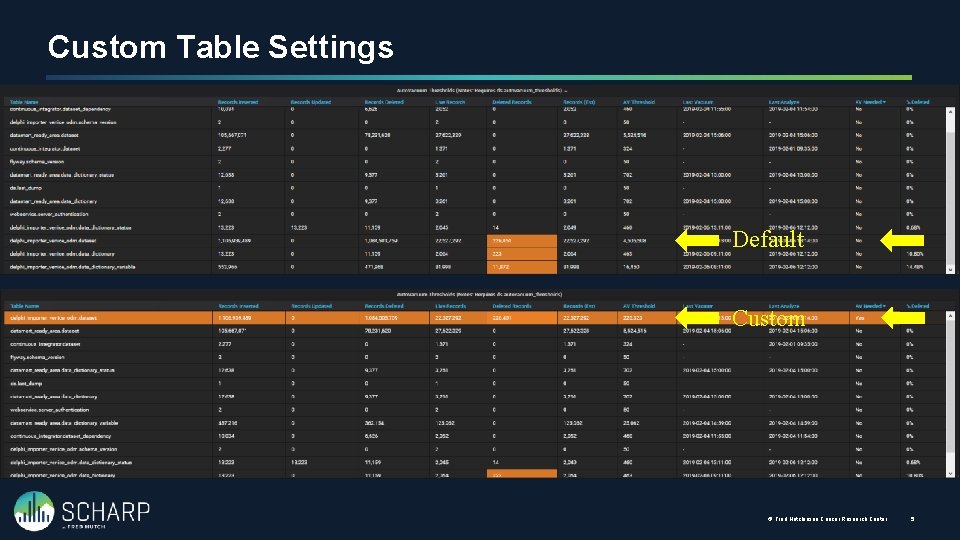
Custom Table Settings Default Custom © Fred Hutchinson Cancer Research Center 5

Auto. Vacuum Settings Viewing the server settings
Auto. Vacuum Settings • This query allows us to see the settings that Postgre. SQL is using and which file they are from. • postgresql. conf • postgresql. auto. conf SELECT current_setting('cluster_name': : text) AS cluster_name, setting, unit, category, short_desc, extra_desc, context, vartype, source, min_val, max_val, enumvals, boot_val, reset_val, sourcefile, sourceline, pending_restart FROM pg_settings; © Fred Hutchinson Cancer Research Center 5
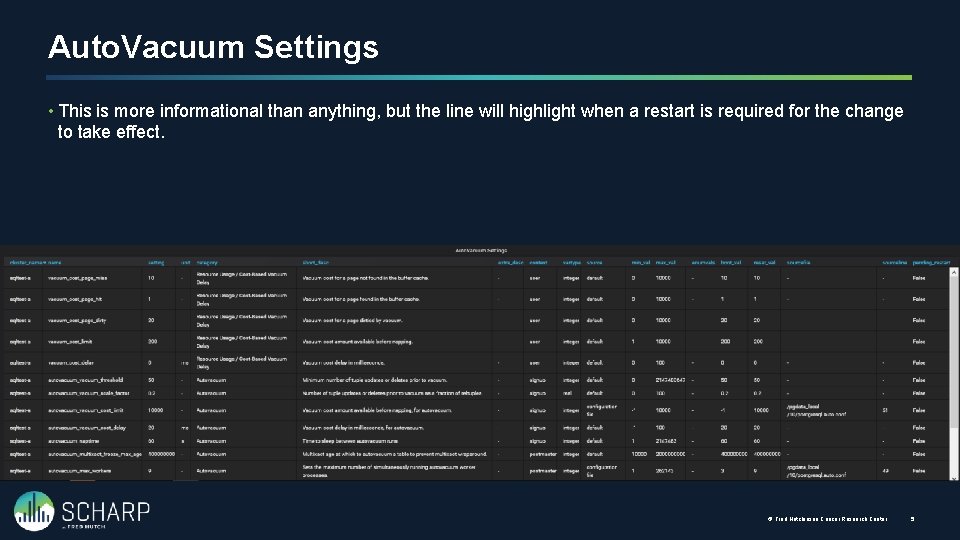
Auto. Vacuum Settings • This is more informational than anything, but the line will highlight when a restart is required for the change to take effect. © Fred Hutchinson Cancer Research Center 5

- Slides: 43