
HST Proposal Demographics Neill Reid SMO AWG December
HST Proposal Demographics Neill Reid SMO AWG December 2017 1
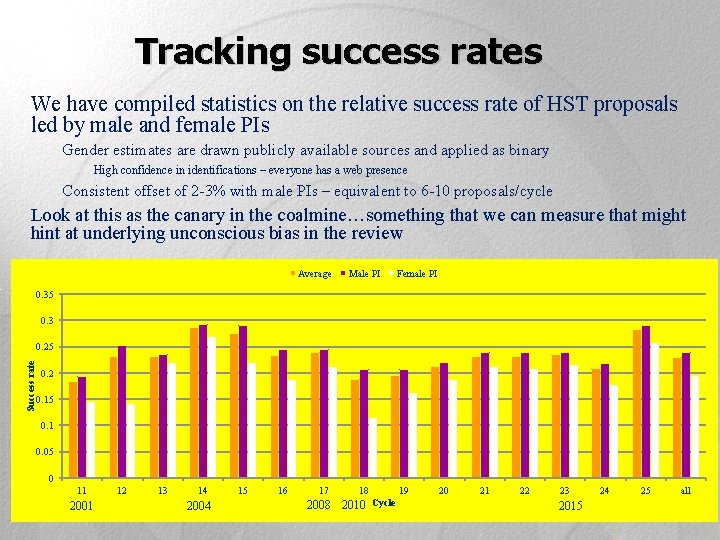
Tracking success rates We have compiled statistics on the relative success rate of HST proposals led by male and female PIs Gender estimates are drawn publicly available sources and applied as binary High confidence in identifications – everyone has a web presence Consistent offset of 2 -3% with male PIs – equivalent to 6 -10 proposals/cycle Look at this as the canary in the coalmine…something that we can measure that might hint at underlying unconscious bias in the review Average Male PI Female PI 0. 35 0. 3 Success rate 0. 25 0. 2 0. 15 0. 1 0. 05 0 11 2001 12 13 14 2004 15 16 17 AWG: 2008 18 19 Cycle December 2017 2010 20 21 22 23 2015 24 25 all 2
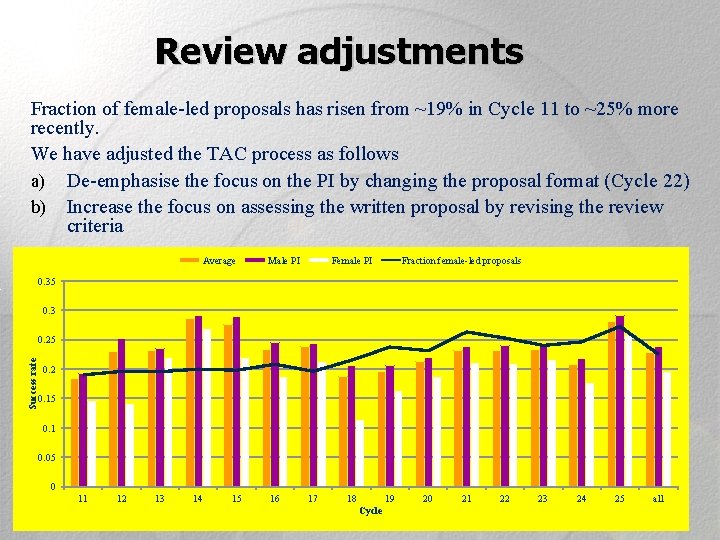
Review adjustments Fraction of female-led proposals has risen from ~19% in Cycle 11 to ~25% more recently. We have adjusted the TAC process as follows a) De-emphasise the focus on the PI by changing the proposal format (Cycle 22) b) Increase the focus on assessing the written proposal by revising the review criteria Average Male PI Female PI Fraction female-led proposals 0. 35 0. 3 Success rate 0. 25 0. 2 0. 15 0. 1 0. 05 0 11 12 13 14 15 16 17 18 19 Cycle 20 21 22 23 24 25 3 all
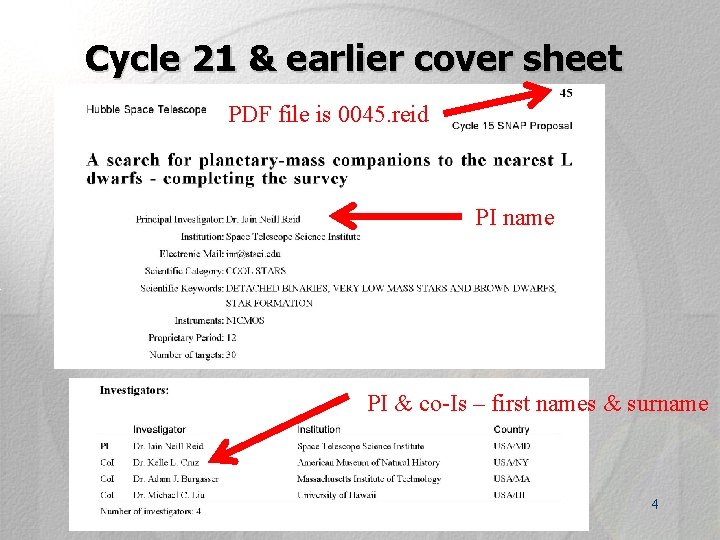
Cycle 21 & earlier cover sheet PDF file is 0045. reid PI name PI & co-Is – first names & surname 4
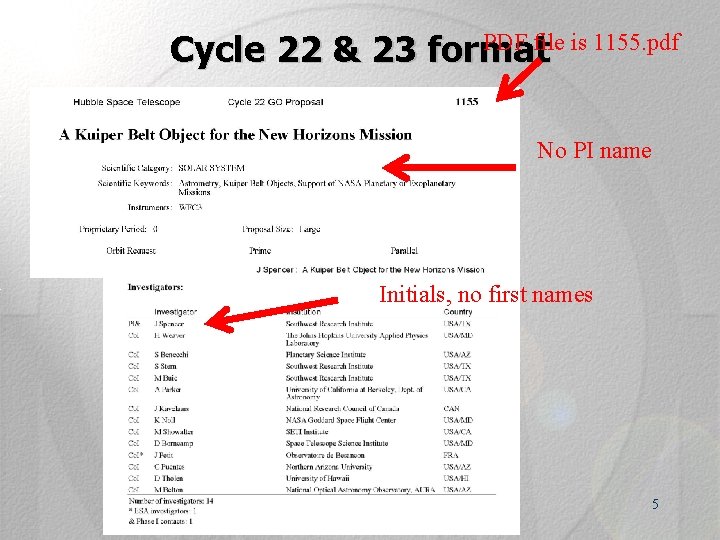
PDF file is 1155. pdf Cycle 22 & 23 format No PI name Initials, no first names 5
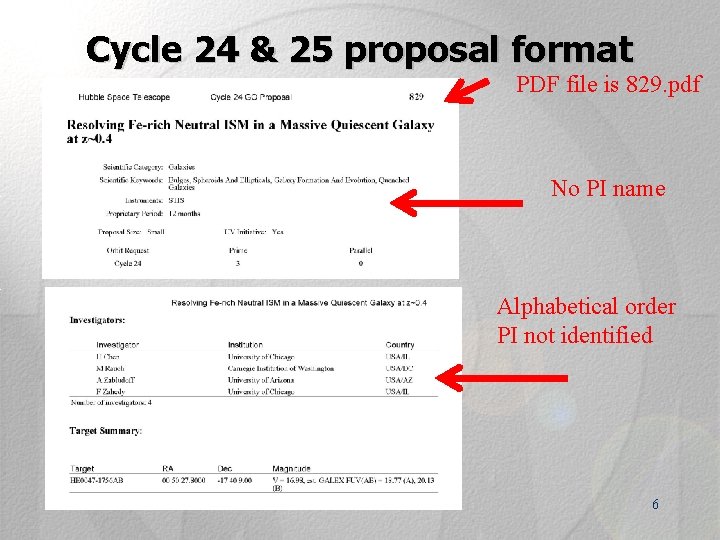
Cycle 24 & 25 proposal format PDF file is 829. pdf No PI name Alphabetical order PI not identified 6
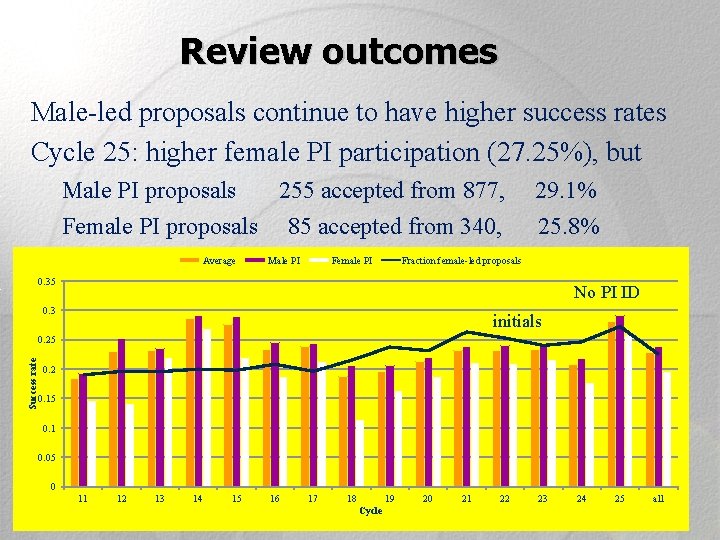
Review outcomes Male-led proposals continue to have higher success rates Cycle 25: higher female PI participation (27. 25%), but Male PI proposals 255 accepted from 877, Female PI proposals 85 accepted from 340, Average Male PI Female PI 29. 1% 25. 8% Fraction female-led proposals 0. 35 No PI ID 0. 3 initials Success rate 0. 25 0. 2 0. 15 0. 1 0. 05 0 11 12 13 14 15 16 17 18 19 Cycle 20 21 22 23 24 25 7 all
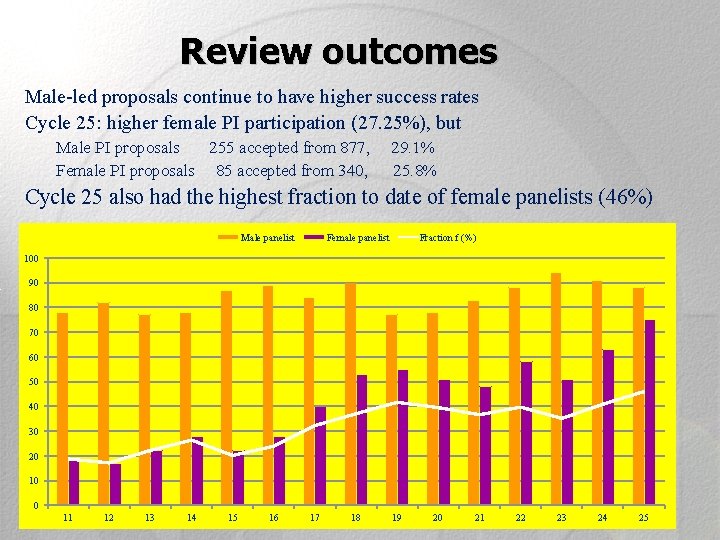
Review outcomes Male-led proposals continue to have higher success rates Cycle 25: higher female PI participation (27. 25%), but Male PI proposals 255 accepted from 877, Female PI proposals 85 accepted from 340, 29. 1% 25. 8% Cycle 25 also had the highest fraction to date of female panelists (46%) Male panelist Female panelist Fraction f (%) 100 90 80 70 60 50 40 30 20 10 0 11 12 13 14 15 16 17 18 19 20 21 22 23 24 25 8
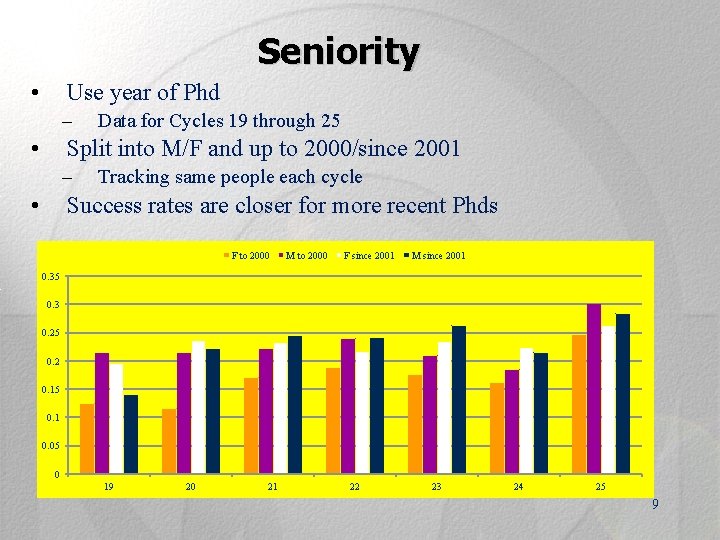
Seniority Use year of Phd • – Data for Cycles 19 through 25 Split into M/F and up to 2000/since 2001 • – Tracking same people each cycle Success rates are closer for more recent Phds • F to 2000 M to 2000 F since 2001 M since 2001 0. 35 0. 3 0. 25 0. 2 0. 15 0. 1 0. 05 0 19 20 21 22 23 24 25 9
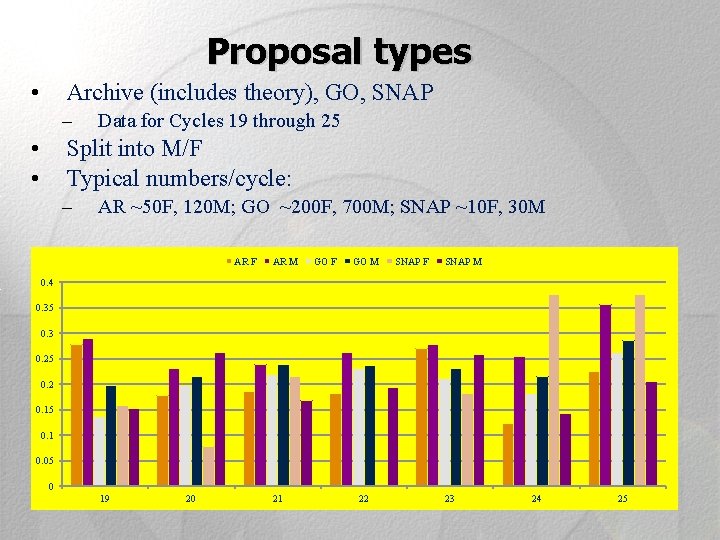
Proposal types Archive (includes theory), GO, SNAP • – Data for Cycles 19 through 25 Split into M/F Typical numbers/cycle: • • – AR ~50 F, 120 M; GO ~200 F, 700 M; SNAP ~10 F, 30 M AR F AR M GO F GO M SNAP F SNAP M 0. 4 0. 35 0. 3 0. 25 0. 2 0. 15 0. 1 0. 05 0 19 20 21 22 23 24 25 10
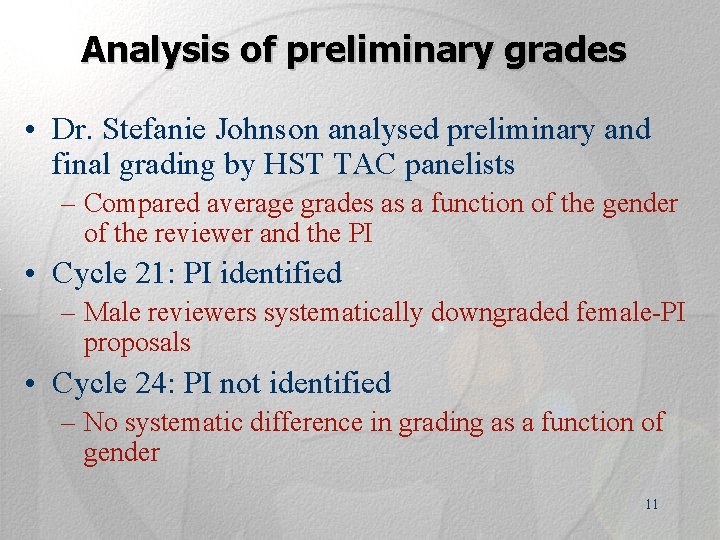
Analysis of preliminary grades • Dr. Stefanie Johnson analysed preliminary and final grading by HST TAC panelists – Compared average grades as a function of the gender of the reviewer and the PI • Cycle 21: PI identified – Male reviewers systematically downgraded female-PI proposals • Cycle 24: PI not identified – No systematic difference in grading as a function of gender 11
- Slides: 11