HSM Applications to SuburbanUrban Multilane Intersections Prediction of

HSM Applications to Suburban/Urban Multilane Intersections Prediction of Crash Frequency for Suburban/Urban Multilane Intersections - Session #9

Predicting Crash Frequency for Suburban/Urban Multilane Intersections Learning Outcomes: ► Describe the models to Predict Crash Frequency for Multilane Suburban/Urban Intersections ►Describe the Crash Modification Factors for Multilane Suburban/Urban Intersections ► Apply Crash Modification Factors to Predicted Crash Frequency for Multilane Suburban/Urban Intersections

Definition of Intersections: “the general area where two or more roadways join or cross, including the roadway and roadside facilities for traffic movements within the area. ” Intersections may be: ►signalized, ►stop controlled, and ►roundabouts

Definition of an Intersection Three Basic Elements at Approaches: 1. Perception-reaction distance; 2. Maneuver distance; and, 3. Queue-storage distance.

SPF Models for Prediction of Crash Frequency for Urban/Suburban Multilane Intersections Four types of Collisions are considered: 1) 2) 3) 4) Multiple-vehicle collisions Single-vehicle collisions Vehicle-pedestrian collisions Vehicle-bicycle collisions

SPF Models for Prediction of Crash Frequency for Urban/Suburban Multilane Intersections Nspf int = Nbimv + Nbisv Where: Nspf int = predicted number of total intersectionrelated crashes for base conditions (excludes pedestrians and bicycle related crashes) Nbimv = Predicted number of multiple-vehicle crashes per year for base conditions Nbisv = Predicted number of single-vehicle crashes per year for base conditions

SPF Models for Prediction of Crash Frequency for Urban/Suburban Multilane Intersections SPF Base Models and Adjustment Factors (CMFs) are organized by four types of Intersection Right of Way Control: 1) Three-leg intersections with STOP control on the minor road approach (3 ST) 2) Three-leg signalized intersections (3 SG) 3) Four-leg intersections with STOP control on the minor-road approaches (4 ST) 4) Four-leg signalized intersection (4 SG)

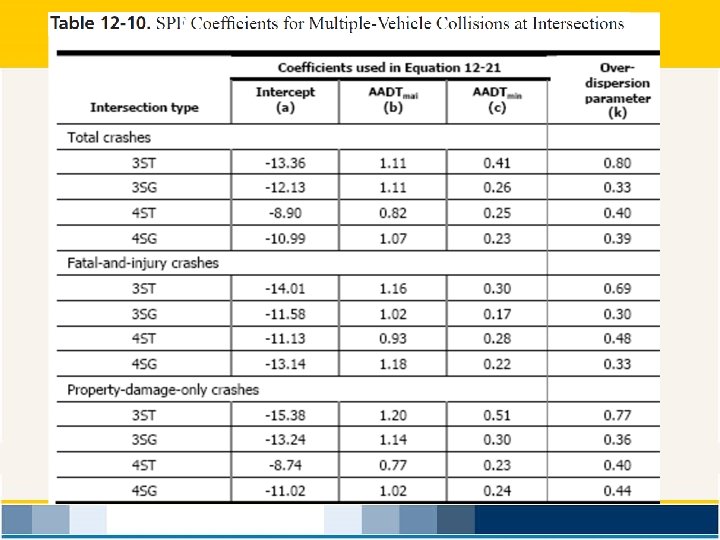
SPF Models for Prediction of Crash Frequency for Urban/Suburban Multilane Intersections Multiple-Vehicle Non. Driveway Crashes Nbimv = exp(a + b ln(AADTmaj) + c ln(AADTmin)) Where: ► Nbimv = expected number of multiple vehicle intersectionrelated crashes per year for base conditions ► AADTmaj = annual average daily traffic volume for the major road (vpd) ► AADTmin = annual average daily traffic volume for the minor road (vpd) ► a, b, and c = regression coefficients from Table 12 -14

SPF Models for Prediction of Crash Frequency for Urban/Suburban Multilane Intersections Nbimv = exp(a + b ln(AADTmaj) + c ln(AADTmin))

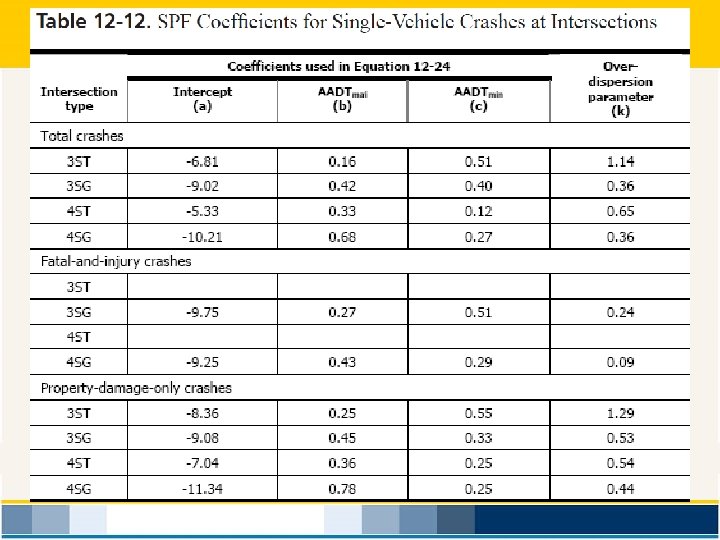
SPF Models for Prediction of Crash Frequency for Urban/Suburban Multilane Intersections Single-Vehicle Non. Driveway Crashes Nbisv = exp(a + b ln(AADTmaj) + c ln(AADTmin)) Where: ► Nbisv = expected number of single vehicle intersectionrelated crashes per year for base conditions ► AADTmaj = annual average daily traffic volume for the major road (vpd) ► AADTmin = annual average daily traffic volume for the minor road (vpd) ► a, b, and c = regression coefficients from Table 12 -16

SPF Models for Prediction of Crash Frequency for Urban/Suburban Multilane Intersections Nbisv = exp(a + b ln(AADTmaj) + c ln(AADTmin))

Prediction Crash Frequency for an Urban Multilane Intersection: EXAMPLE Four-Leg Signalized Intersection: Ø 25, 000 AADT and 5, 000 AADT Nspf int = Nbimv + Nbisv Where: Nbimv = Predicted number of multiple-vehicle crashes per year for base conditions Nbisv = Predicted number of single-vehicle crashes per year for base conditions

Prediction Crash Frequency for an Urban Multilane Intersection – Example: Four-Leg Signalized Intersection: Ø 25, 000 AADT and 5, 000 AADT Nbimv = exp(a + b ln(AADTmaj) + c ln(AADTmin)) Nbimv = exp(-10. 99 + 1. 07 ln(25, 000)) + 0. 23 ln(5, 000) = exp(-10. 99 + 10. 83 + 1. 959) = exp(1. 804) = 6. 08 crashes per year

Prediction Crash Frequency for an Urban Multilane Intersection – Example: Four-Leg Signalized Intersection: Ø 25, 000 AADT and 5, 000 AADT Nbisv = exp(a + b ln(AADTmaj) + c ln(AADTmin)) Nbisv = exp(-10. 21 + 0. 68 ln(25, 000)) + 0. 27 ln(5, 000) = exp(-10. 21 + 6. 89 + 2. 30) = exp(-1. 024) = 0. 36 crashes per year

Prediction Crash Frequency for an Urban Multilane Intersection Example: Four-Leg Signalized Intersection: Ø 25, 000 AADT and 5, 000 AADT Nspf int = Nbimv + Nbisv Nspf int = ______ 6. 08 + ____ 0. 36 = 6. 44 crashes per year

Applying Severity Index to Urban Suburban Multilane Intersections Example: Four Approach Signalized Intersection with 25, 000 AADT on Major and 5, 000 AADT on minor; Fatal and Injury crashes are 5 of 12 total crashes a. Compute the actual Severity Index (SI) SI 4 sg = Fatal + Injury Crashes = 5/12 = 0. 42 Total Crashes

Applying Severity Index to Urban Suburban Multilane Intersections b. Compute Predicted Fatal + Injury Crashes Nbimv = exp(-13. 14 + 1. 18 ln(25, 000)) + 0. 22 ln(5, 000) = 1. 98

Applying Severity Index to Urban Suburban Multilane Intersections Nbisv = exp(-13. 14 + 1. 18 ln(25, 000)) + 0. 22 ln(5, 000) = 0. 09

Applying Severity Index to Urban Suburban Multilane Intersections Example: Four Approach Signalized Intersection with 25, 000 AADT on Major and 5, 000 AADT on minor; Fatal and Injury crashes are 5 of 12 total crashes a. Compute the actual Severity Index (SI) SI 4 sg = Fatal + Injury Crashes = 5/12 = 0. 42 Total Crashes b. Compute the Predicted Severity Index (SI) SI 4 sg = Fatal + Injury Crashes = (1. 98+0. 09)/6. 44 Total Crashes = 0. 321 ► Actual Severity is greater than Predicted Severity

Predicting Crash Frequency for Urban/Suburban At-Grade Intersections Nbi = Nspf int (CMF 1 i x CMF 2 i. . CMFni) Where: ► Nbi = Predicted number of total roadway segment crashes per year with CMFs applied ► Nspf int = Predicted number of total roadway segment crashes per year for base conditions ► CMF 1 i CMF 2 i, . . CMFni = Crash Modification Factors for intersections

CMF’s for Urban Multilane Intersections ► Left-Turn Lanes ► Left-Turn Signal phasing ► Right Turn Lanes ► Right Turn on Red ► Lighting ► Red Light Camera Photo Enforcement

CMF 1 i for Presence of Left-Turn Lanes at Urban/Suburban Multilane Intersections: --- For STOP-Controlled Intersections: CMF applies only on uncontrolled major-road approaches

CMF 1 i for Left Turn Lane on one approach for a three-Leg Intersection:

CMF 1 i for Left Turn Lane on one approach for a four-Leg Intersection:

CMF 1 i for Left Turn Lane on two approaches for a four-Leg Intersection:

CMF 2 i for Type of Left-Turn Signal Phasing at Urban/Suburban Multilane Intersections: If several approaches have left-turn phasing: ► CMF values for each approach should be multiplied together ► CMF 2 approaches protected = 0. 94 x 0. 94 = 0. 88

CMF 3 i for Presence of Right-Turn Lanes at Urban/Suburban Multilane Intersections: --

CMF 4 i for Prohibiting Right-Turn On Red at Urban/Suburban Multilane Intersections: CMF 4 i = (0. 98)nprohib Where, CMF 4 i = CMF for the effect of prohibiting right turns on red on total crashes nprohib = number of signalized intersection approaches for which right turn on red is prohibited - Example: For 2 approaches, n=2 CMF 4 i = (0. 98)n = (0. 98)2 = 0. 96

CMF 5 i for Lighting at Urban/Suburban Multilane Intersections: Where: CMF 5 i = 1 - 0. 38 Pni CMF 5 i = CMF for the effect of lighting on total crashes Pni = proportion of total crashes for unlighted intersections that occur at night
")
CMF 5 i for Lighting Example: For 4 Approach Signalized Intersection Signalized (4 SG) with no lighting: CMF 5 i = 1 - 0. 38 pnr = 1 - 0. 38 x 0. 235 ) = 0. 9107 = 1. 00 as the base condition is unlit Example: For 4 Approach Signalized Intersection Signalized (4 SG) with lighting: CMF 5 i = 1 - 0. 38 pnr = 1 - 0. 38 x 0. 235 = 0. 9107

CMF 6 i for Red Light Running Automated Enforcement:

Applying CMF’s to Urban Multilane Intersection: Example Four-Leg Signalized Intersection: • 25, 000 AADT and 5, 000 AADT • Lt & Rt Turn Lanes on Major Approaches • Protected Left-Turn Phasing on Major Road • Lighted Nspf int = 6. 44 crashes/yr 0. 81 CMF 1 i = _______ CMF 2 i = _____ 0. 88 1. 00 CMF 4 i = _____ 1. 00 CMF 5 i = _____ 1. 00 0. 911 CMF 6 i = _____ CMF 3 i = _____

Applying CMF’s to Urban Multilane Intersection: Example Four-Leg Signalized Intersection: • 25, 000 AADT and 5, 000 AADT • Lt & Rt Turn Lanes on Major Approaches • Protected Left-Turn Phasing on Major Road • Lighted Nbi = Nspf int (CMF 1 i x CMF 2 i. . CMF 6 i) = 6. 44 (0. 81 x 0. 884 x 1. 00 x 0. 911 x 1. 00) = 4. 2 crashes per year

Predicting Crash Frequency for Urban/Suburban Intersections Consdieration for Pedestrians and Bicyclists Npredicted int = (Nbi + Npedi + Nbikei) Ci Where: Nint = Predicted number of total intersection crashes per year after application of CM F’s Nbi = Predicted number of total intersection crashes per year (excluding ped and bike crashes) Npedi = Predicted number of vehicle-ped crashes per year Nbikei = Predicted number of vehicle-bicycle collisions per year Ci = calibration factor for a particular geographical area

Prediction of Crash Frequency for Vehicle. Pedestrian Collisions at Urban/Suburban Intersections: Two Separate Procedures for pedestrians based on Intersection Type: Ø Signalized Intersections • Npedi = Npedbase(CMF 1 p x CMF 2 p x CMF 3 p) Ø Stop – Controlled Intersections • Npedi = Nbi x fpedi

Prediction of Vehicle-Pedestrian Crash Frequency for Signalized Urban/Suburban Intersections: Signalized Intersections Npedi = Npedbase (CMF 1 p x CMF 2 p x CMF 3 p) Where, Npedbase = predicted number of vehicle pedestrian collisions per year for base conditions CMF 1 p … CMF 3 p = CMFs for vehiclepedestrian collisions

Prediction of Vehicle-Pedestrian Crash Frequency for Signalized Urban/Suburban Intersections: Npedi = Npedbase (CMF 1 p x CMF 2 p x CMF 3 p) CMF 1 p -- accounts for the presence of bus stops (Table 12 -28) CMF 2 p -- accounts for the presence of schools (Table 12 -29) CMF 3 p -- accounts for the number of alcohol establishments (Table 12 -30)

Prediction of Vehicle-Pedestrian Crash Frequency for Signalized Urban/Suburban Intersections: Npedbase = exp [a + b ln(ADTtot) + c ln(AADTmin/AADTmaj) + d ln(Ped. Vol) + e (nlanesx)] Where, AADTtot = Sum of AADT for major and minor roads (vpd) Ped. Vol = Sum of daily pedestrian volumes crossing each intersection leg (pedestrians/day) Nlanesx = Maximum # of traffic lanes crossed by peds in one movement a, b, c, d, e = regression coefficients, Table 12 -14

Prediction of Vehicle-Pedestrian Crash Frequency for Signalized Urban/Suburban Intersections: Values for a, b, c, d, & e regression Coefficients

Estimates of Pedestrian Crossing Volumes:

Prediction of Vehicle-Pedestrian Crash Frequency for Signalized Urban/Suburban Intersections: Example: Four-Leg Signalized Intersection: ► 25, 000 AADT and 5, 000 AADT ► Pedestrian Volume (crossing all legs) = 235 peds/day; ► Four lanes each Approach on Major Road; two on minor ► Left Turn Lanes on major road approaches Npedbase = exp [a + b ln(ADTtot) + c ln(AADTmin/AADTmaj) + d ln(Ped. Vol) + e (nlanesx)] = exp [-9. 53 + 0. 40 ln(30, 000) + 0. 26 ln(5000/25000) + 0. 45 ln(235) + 0. 04(5 )] Npedbase = 0. 042 crashes per year

Pedestrian CMFs for Signalized Urban/Suburban Intersections:

Prediction of Veh-Ped Crash Frequency for an Urban Multilane Intersection: EXAMPLE Four-Leg Signalized Intersection: ► 25, 000 AADT and 5, 000 AADT ► Pedestrian Volume (crossing all legs) = 235 peds/day ► Four lanes each Approach on Major Road; two on minor ► Left Turn Lanes on major road approaches ► within 1, 000 ft ( Two bus stops + a School + 2 Alcohol Sales) Npedi = Npedbase (CMF 1 p x CMF 2 p x CMF 3 p) Npedbase = 0. 042 crashes per year Npedi = 0. 042 (2. 78 x 1. 35 x 1. 12) = 0. 177 crashes per year

Prediction of Vehicle-Bicycle Crash Frequency for Urban/Suburban Intersections: For Bicyclists: Nbikei = Nbi x fbikei Ø Nbi = Predicted number of total roadway segment crashes per year Ø fpedi = Bicycle safety adjustment factor, Table 12 -34

Prediction of Crash Frequency for Vehicle-Bicycle Collisions at an Urban/Suburban Intersection Example: Four-Leg Signalized Intersection ► 25, 000 AADT and 5, 000 AADT ► Pedestrian Volume = 235 peds/day ► Two lanes each direction on Major Road; one lane in each direction on minor ► Left turn lanes on major road and minor Nbi = Nspf int x 0. 65 = 6. 44 x 0. 65 = 4. 20 crashes/yr Nbikei = Nbi x fbikei = 4. 20 x 0. 015 = 0. 063 crashes per year

Predicting Total Crash Frequency for Urban/Suburban At-Grade Intersections Example: Four-Leg Signalized Intersection: ► 25, 000 AADT and 5, 000 AADT ► Pedestrian Volume = 235 peds/day ► Two lanes each direction on Major Road + Left Turn Lane ► Two Bus Stops within 1, 000 feet; one school ► Two Convenient Store in SE Quadrant that sells alcohol Nint = (Nbi + Npedi + Nbikei) Ci = (4. 20 + 0. 177 + 0. 063) x 1. 0 = 4. 44 crashes per year

Application of Islands to Improve Pedestrian Safety Pedestrian Islands Benefits: ► Separate conflicts & decision points ► Reduce crossing distance (reduces the # of lanes crossed in CMF for Pedestrians) ► Improve signal timing ► Reduce crashes ► Reducing # of lanes crossed Reduces Ped Crash Frequency

Right-Turn Slip Lane - Details Cut through medians and islands for pedestrians 2: 1 length/width ratio 55° to 70° between vehicular flows. 25’ to 40’ radius depending on design vehicle Crosswalk one car length back Long radius followed by short 150 to 275’ radius Bicycle lane

Prediction of Vehicle-Pedestrian Crash Frequency for Stop–Controlled Urban/Suburban Intersections: Npedi = Nbi x fpedi ► Nbi = Predicted number of total roadway segment crashes per year ► fpedi = Pedestrian safety adjustment factor, Table 12 -16

Prediction Crash Frequency for an Urban Multilane Intersection – EXAMPLE: Four-Leg Stop Controlled Intersection: Ø 25, 000 AADT and 5, 000 AADT Nbimv & bisv= exp(a + b ln(AADTmaj) + c ln(AADTmin)) Nbimv = exp(-8. 9 + 0. 82 ln(25, 000)) + 0. 25 ln(5, 000) = 4. 63 crashes per year Nbisv = exp(-5. 33 + 0. 33 ln(25, 000)) + 0. 12 ln(5, 000) = 0. 38 crashes per year Nspf int = 4. 63 + 0. 38 = 5. 01 crashes per year

Prediction of Vehicle-Pedestrian Crash Frequency for Stop–Controlled Urban/Suburban Intersections: For a 4 -approach stop controlled suburban intersection with Nbi = 5. 01 Npedi = Nbi x fpedi = 5. 01 x 0. 022 = 0. 110

Predicting Crash Frequency for Suburban/Urban Multilane Intersections Learning Outcomes: ► Described the models to Predict Crash Frequency for Multilane Suburban/Urban Intersections ►Described the Crash Modification Factors for Multilane Suburban/Urban Intersections ► Applied Crash Modification Factors to Predicted Crash Frequency for Multilane Suburban/Urban Intersections

Predicting Crash Frequency for Suburban/Urban Multilane Intersections Questions and Discussion:
- Slides: 55