HR Metrics Database Presentation to WIG HR Metrics

HR Metrics Database Presentation to WIG

HR Metrics Database • • Background Progress Report Examples Next Steps

Background • • HR Metrics Report How can we collect the data more efficiently? How can we make more use of the data? Explore the possibility of of creating a basic HR datamart • Waltham Forest & Haringey volunteered to provide data and expertise

Progress Report • Visits to sunny Waltham Forest & Haringey over the summer & collected sets of data • Defined file layouts and built data transformation scripts • Data loaded into Access – one row person period • Standard formulas applied • Transformed into OLAP cube using Cognos Transformer

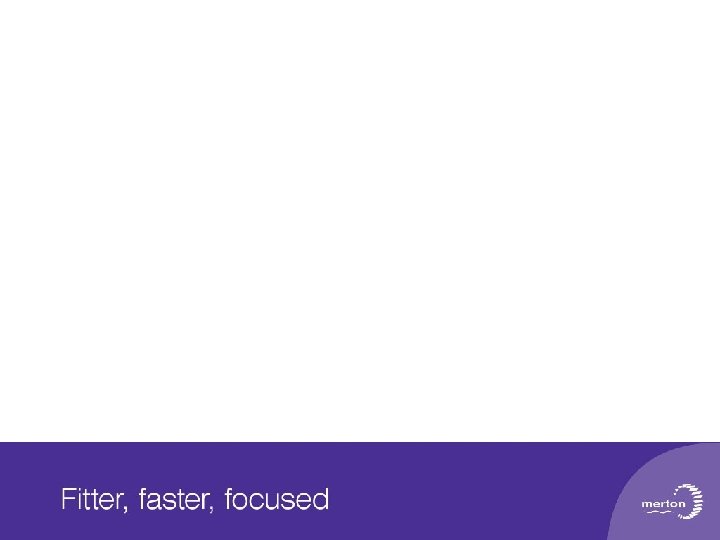
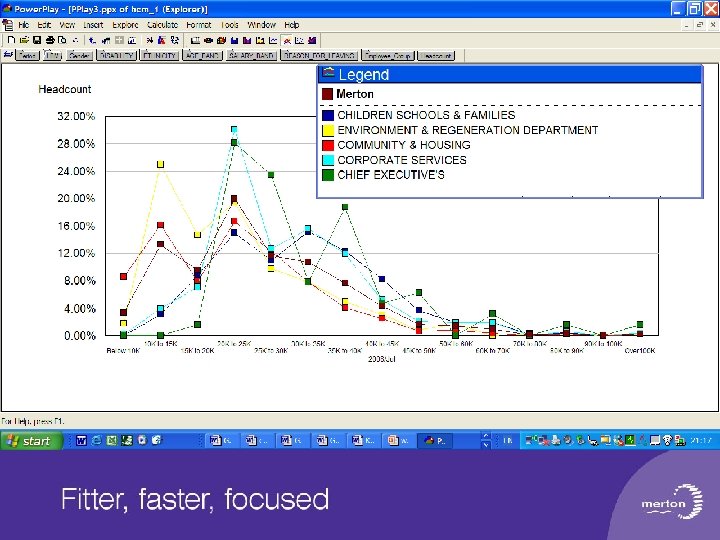
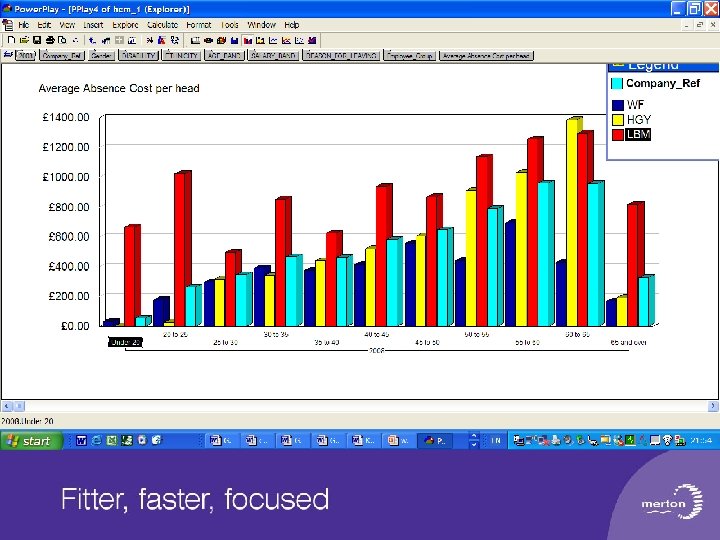
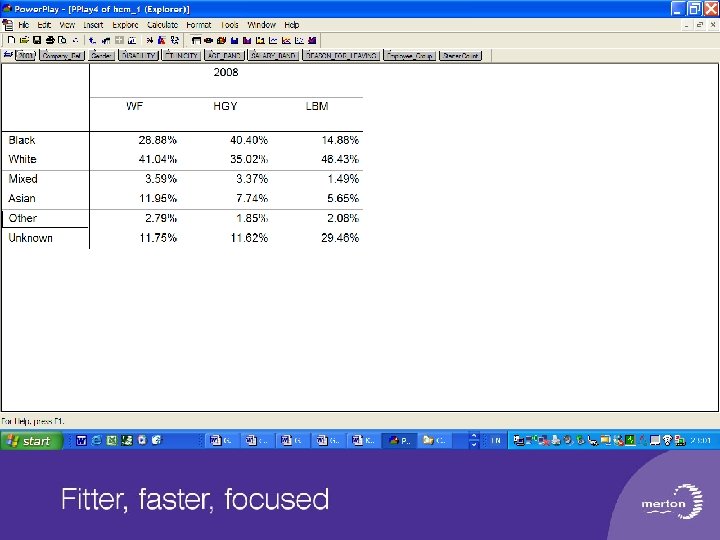
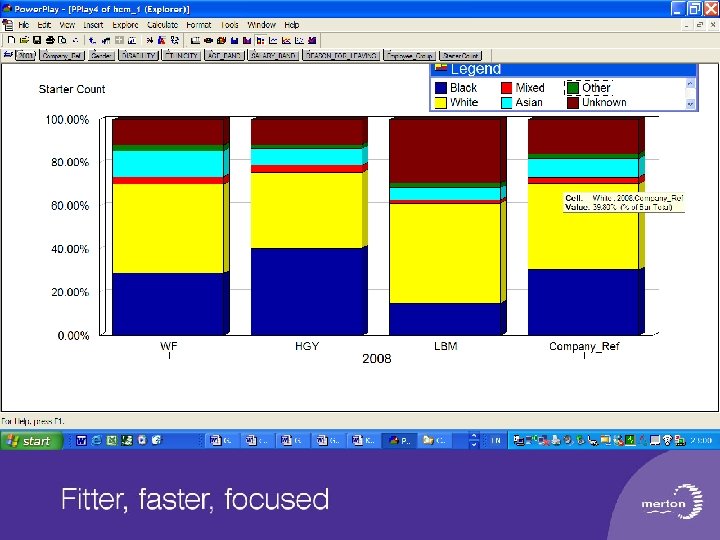
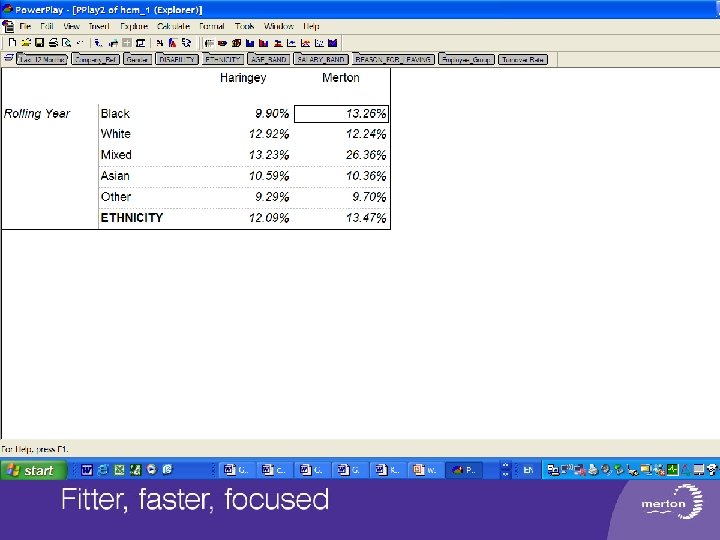
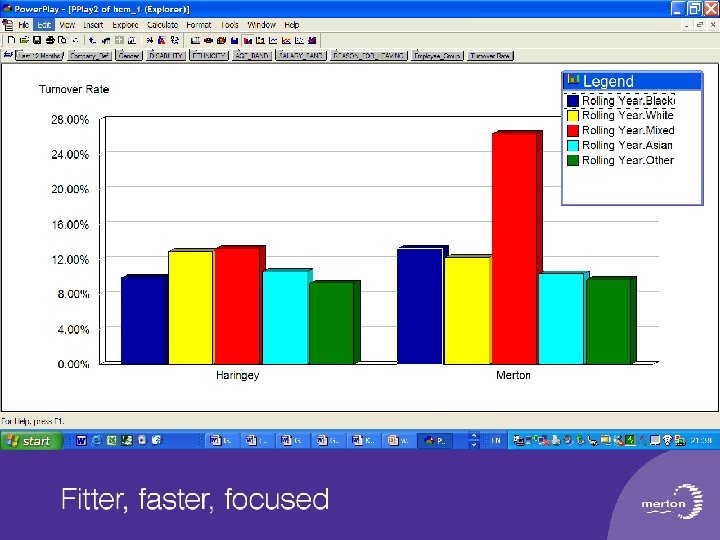
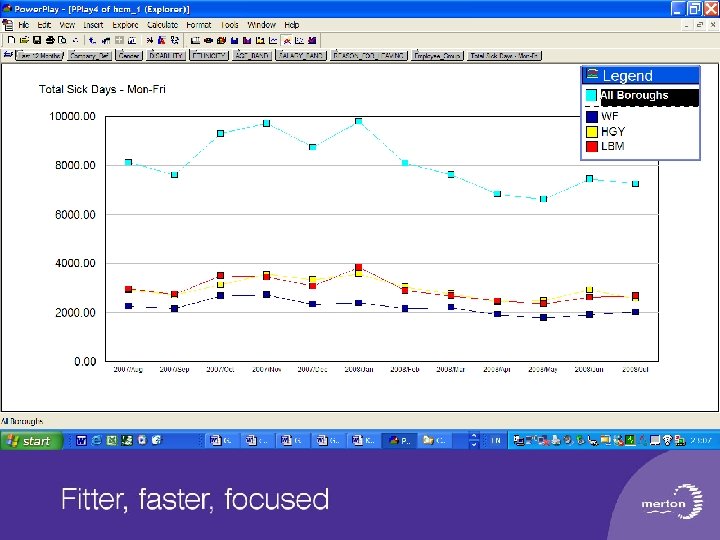
Examples • Unable to set-up live demo • Slides produced using data provided by Leon & Tessa • Cognos Powerplay used as reporting layer • Still some issues with the data and work still to be done on adding to the dimensions and measures

Measures & Dimensions • • • Dimensions Time Organisation Gender Ethnicity Age Band Length of Service Salary Band Employee Group • • • Measures FTE / Headcount Gross Pay (Total / Avg. ) Average Age Sick Days Sickness Cost Sick Days per FTE Turnover Rate Starter / Leaver Count

Next Steps • Firm up the process • Add Absence reasons, top 5% flag and occupational groups • More checking & testing • Document process • Collect data from more boroughs • Look at options for software
 • Management Information will be the lifeblood of workforce")
The Challenge… (a personal view) • Management Information will be the lifeblood of workforce planning • We need to see the possibilities of what it can provide. Spend more time using the data than designing reports. • We need to be aiming to make the information more accessible for line managers – this means simpler and more standardisation

Any Questions?
- Slides: 18