
How WIMS is Used for Monitoring Renewable Energy
How WIMS is Used for Monitoring Renewable Energy and Energy KPIs at MMSD Tanya Gregg, P. G. Systems Monitoring Data Analyst Milwaukee Metropolitan Sewerage District Special thanks to Sid Arora (MMSD) Milwaukee Metropolitan Sewerage District
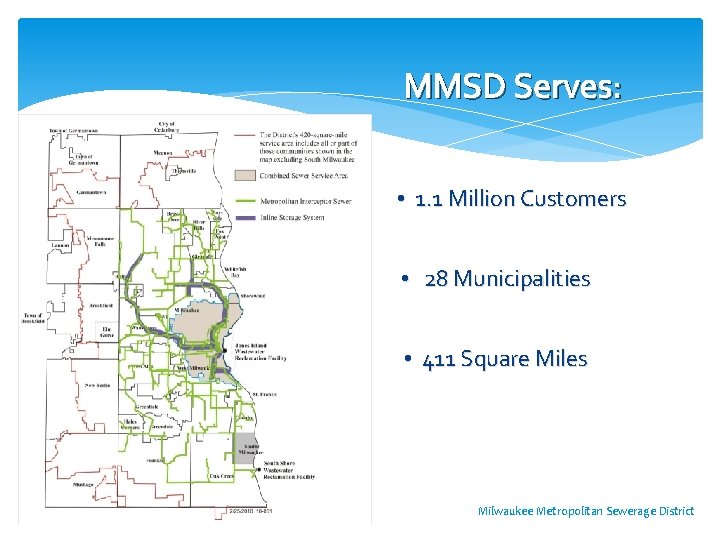
MMSD Serves: • 1. 1 Million Customers • 28 Municipalities • 411 Square Miles Milwaukee Metropolitan Sewerage District
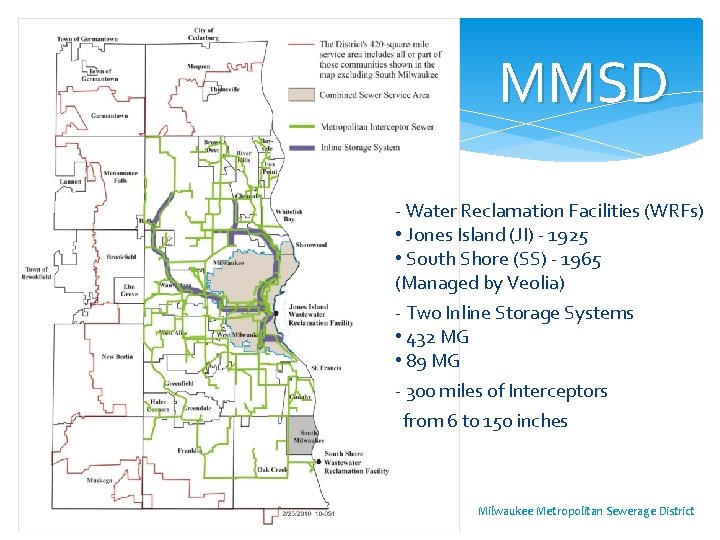
MMSD - Water Reclamation Facilities (WRFs) • Jones Island (JI) - 1925 • South Shore (SS) - 1965 (Managed by Veolia) - Two Inline Storage Systems • 432 MG • 89 MG - 300 miles of Interceptors from 6 to 150 inches Milwaukee Metropolitan Sewerage District
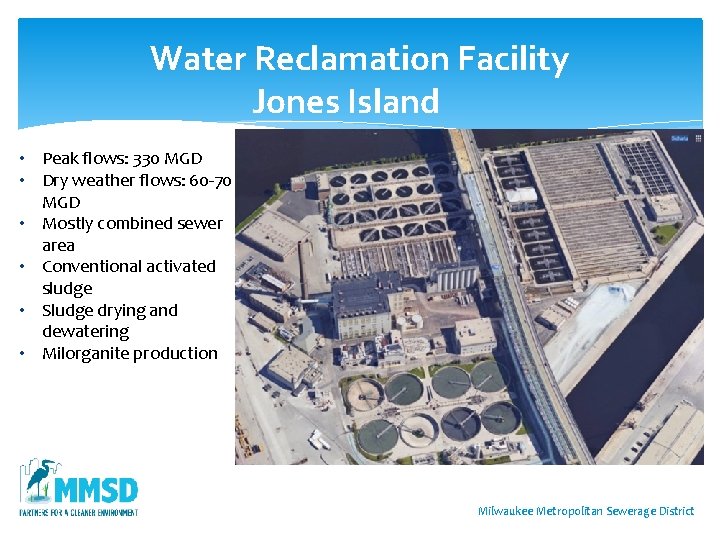
Water Reclamation Facility Jones Island • Peak flows: 330 MGD • Dry weather flows: 60 -70 MGD • Mostly combined sewer area • Conventional activated sludge • Sludge drying and dewatering • Milorganite production Milwaukee Metropolitan Sewerage District
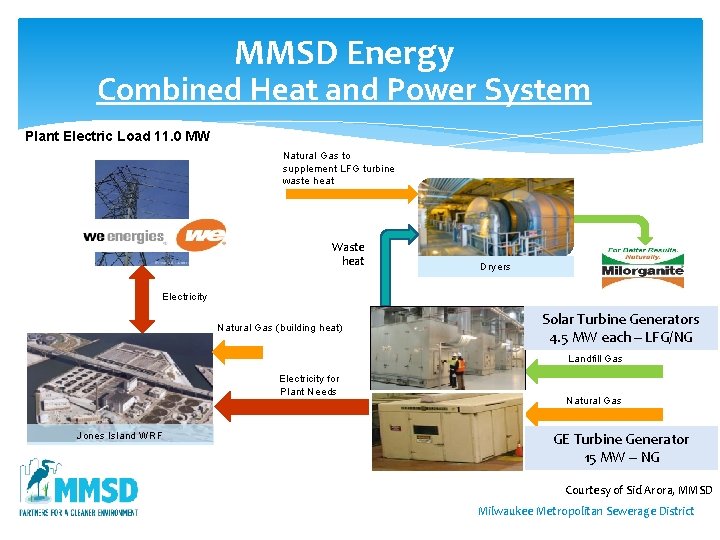
MMSD Energy Combined Heat and Power System Plant Electric Load 11. 0 MW Natural Gas to supplement LFG turbine waste heat Waste heat Dryers Electricity Natural Gas (building heat) Solar Turbine Generators 4. 5 MW each – LFG/NG Landfill Gas Electricity for Plant Needs Jones Island WRF Natural Gas GE Turbine Generator 15 MW – NG Courtesy of Sid Arora, MMSD Milwaukee Metropolitan Sewerage District
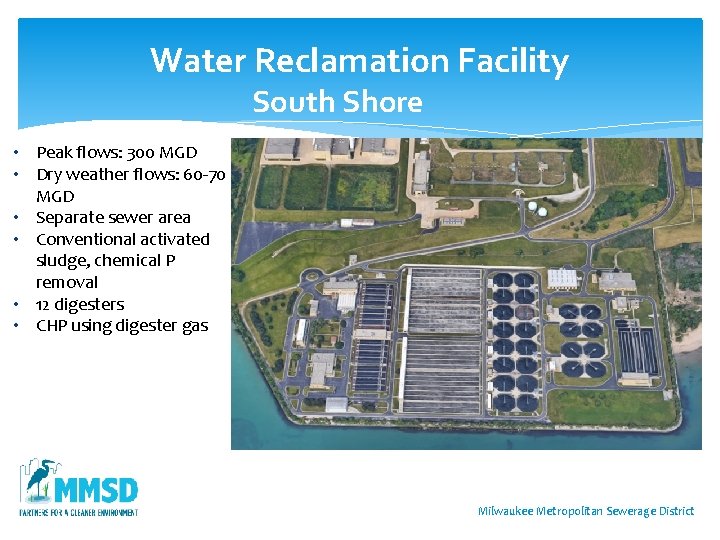
Water Reclamation Facility South Shore • Peak flows: 300 MGD • Dry weather flows: 60 -70 MGD • Separate sewer area • Conventional activated sludge, chemical P removal • 12 digesters • CHP using digester gas Milwaukee Metropolitan Sewerage District
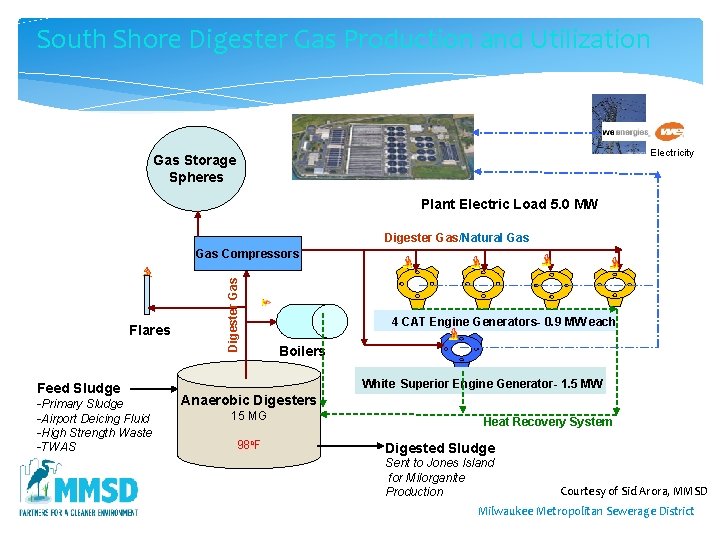
South Shore Digester Gas Production and Utilization Electricity Gas Storage Spheres Plant Electric Load 5. 0 MW Digester Gas/Natural Gas Flares Feed Sludge -Primary Sludge -Airport Deicing Fluid -High Strength Waste -TWAS Digester Gas Compressors 4 CAT Engine Generators- 0. 9 MW each Boilers White Superior Engine Generator- 1. 5 MW Anaerobic Digesters 15 MG 98 o. F Heat Recovery System Digested Sludge Sent to Jones Island for Milorganite Production Courtesy of Sid Arora, MMSD Milwaukee Metropolitan Sewerage District
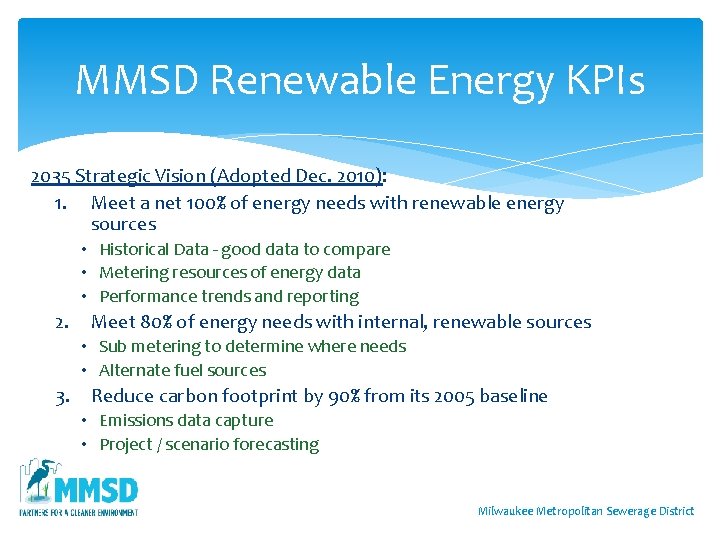
MMSD Renewable Energy KPIs 2035 Strategic Vision (Adopted Dec. 2010): 1. Meet a net 100% of energy needs with renewable energy sources • Historical Data - good data to compare • Metering resources of energy data • Performance trends and reporting 2. Meet 80% of energy needs with internal, renewable sources • Sub metering to determine where needs • Alternate fuel sources 3. Reduce carbon footprint by 90% from its 2005 baseline • Emissions data capture • Project / scenario forecasting Milwaukee Metropolitan Sewerage District
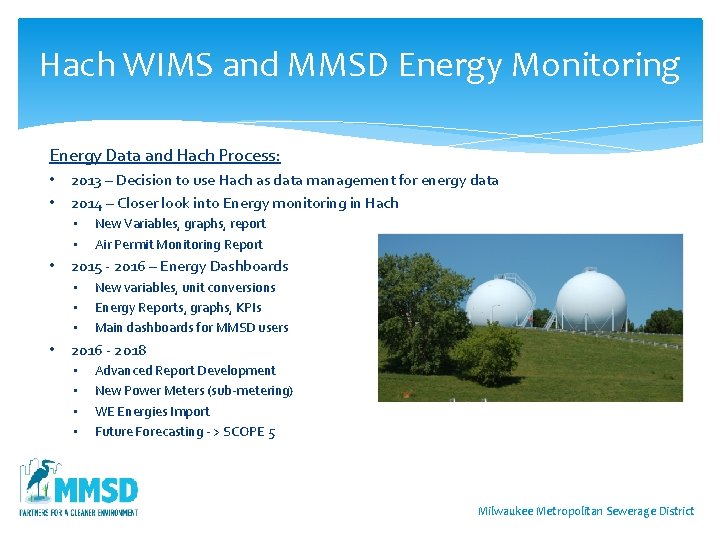
Hach WIMS and MMSD Energy Monitoring Energy Data and Hach Process: • 2013 – Decision to use Hach as data management for energy data • 2014 – Closer look into Energy monitoring in Hach • • New Variables, graphs, report Air Permit Monitoring Report • 2015 - 2016 – Energy Dashboards • • • New variables, unit conversions Energy Reports, graphs, KPIs Main dashboards for MMSD users • 2016 - 2018 • • Advanced Report Development New Power Meters (sub-metering) WE Energies Import Future Forecasting - > SCOPE 5 Milwaukee Metropolitan Sewerage District
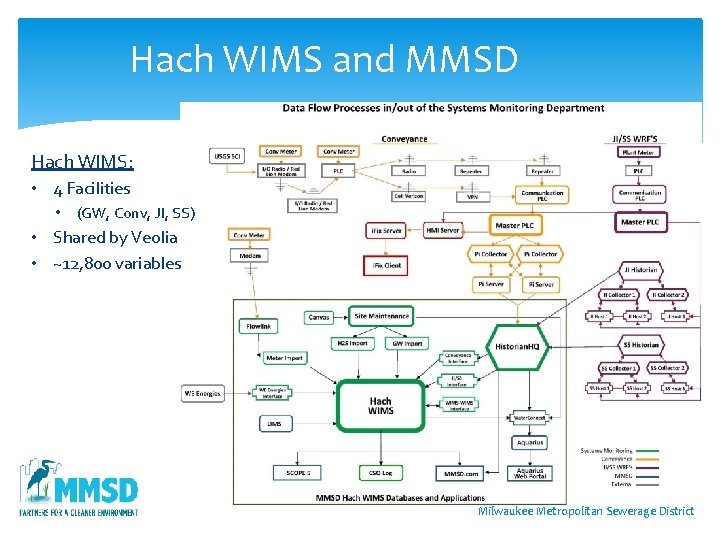
Hach WIMS and MMSD Hach WIMS: • 4 Facilities • (GW, Conv, JI, SS) • Shared by Veolia • ~12, 800 variables Milwaukee Metropolitan Sewerage District
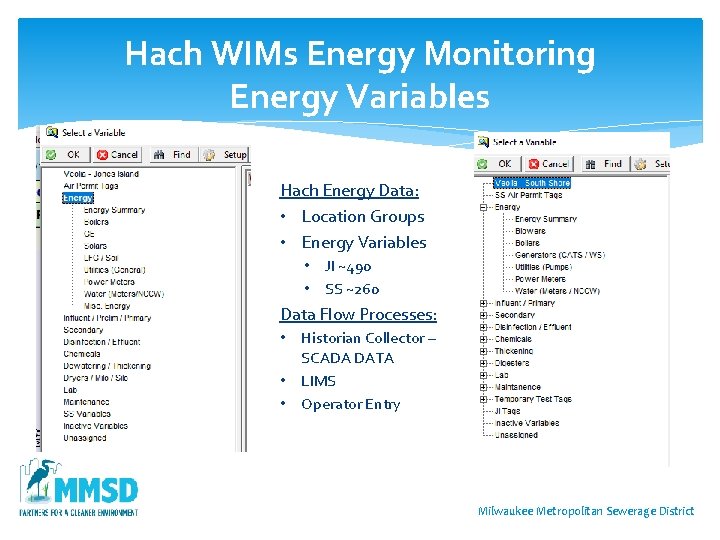
Hach WIMs Energy Monitoring Energy Variables Hach Energy Data: • Location Groups • Energy Variables • JI ~490 • SS ~260 Data Flow Processes: • Historian Collector – SCADA DATA • LIMS • Operator Entry Milwaukee Metropolitan Sewerage District
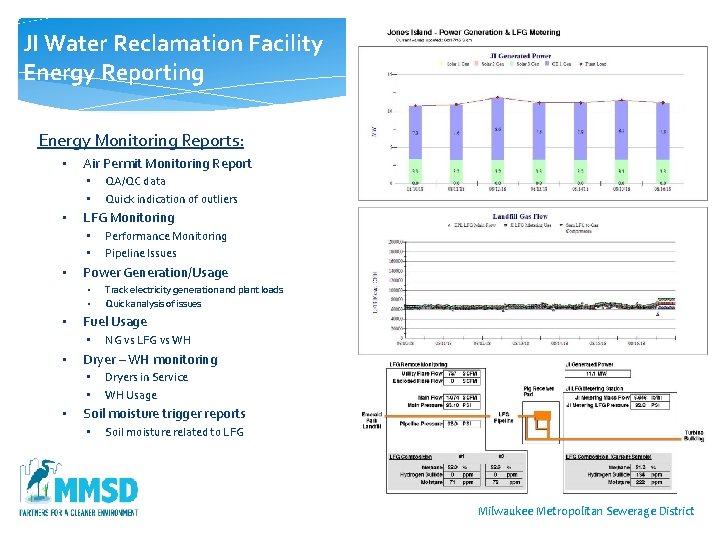
JI Water Reclamation Facility Energy Reporting Energy Monitoring Reports: • Air Permit Monitoring Report • • • LFG Monitoring • • • NG vs LFG vs WH Dryer – WH monitoring • • • Track electricity generation and plant loads Quick analysis of issues Fuel Usage • • Performance Monitoring Pipeline Issues Power Generation/Usage • • • QA/QC data Quick indication of outliers Dryers in Service WH Usage Soil moisture trigger reports • Soil moisture related to LFG Milwaukee Metropolitan Sewerage District
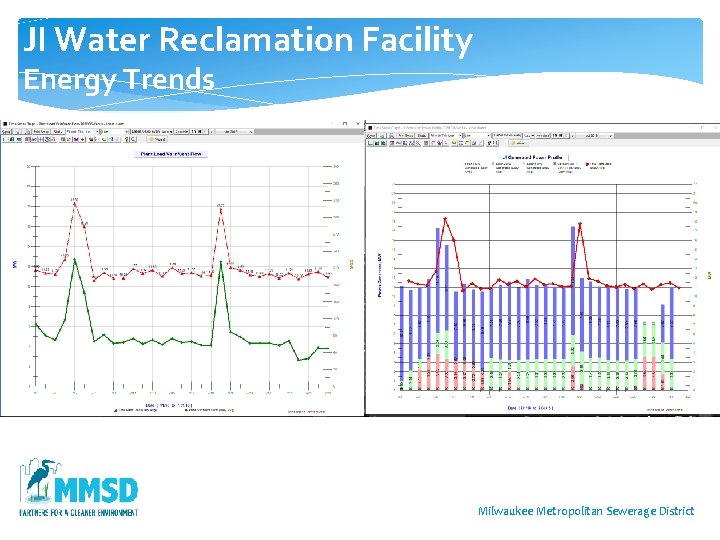
JI Water Reclamation Facility Energy Trends Milwaukee Metropolitan Sewerage District
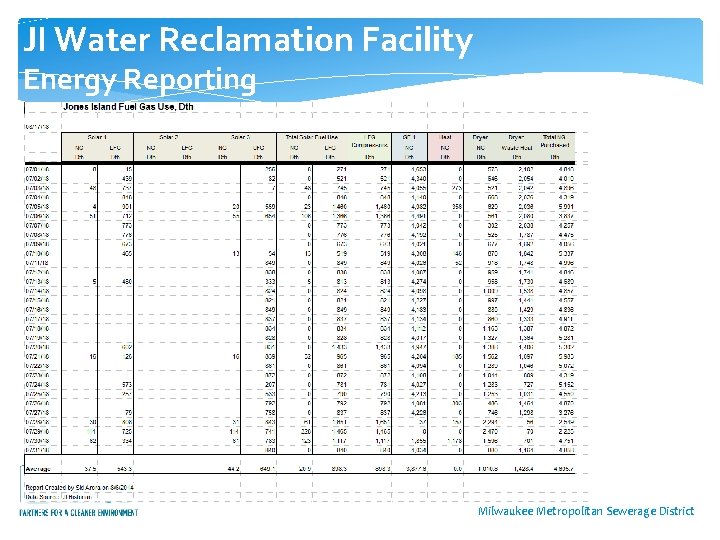
JI Water Reclamation Facility Energy Reporting Milwaukee Metropolitan Sewerage District
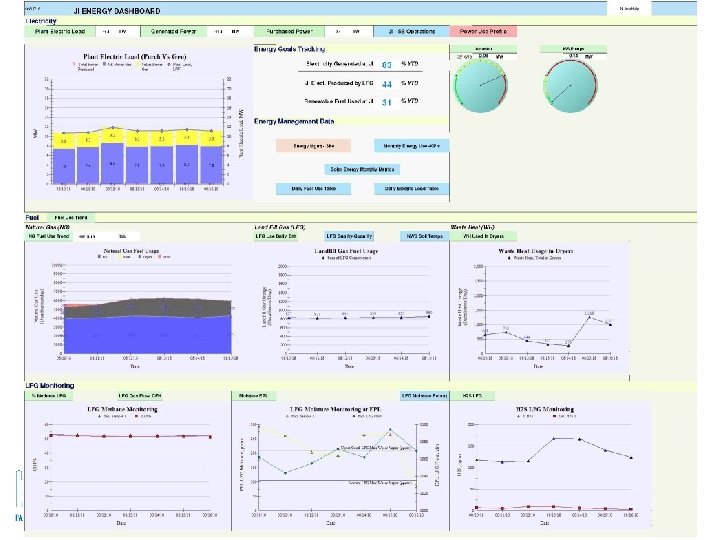
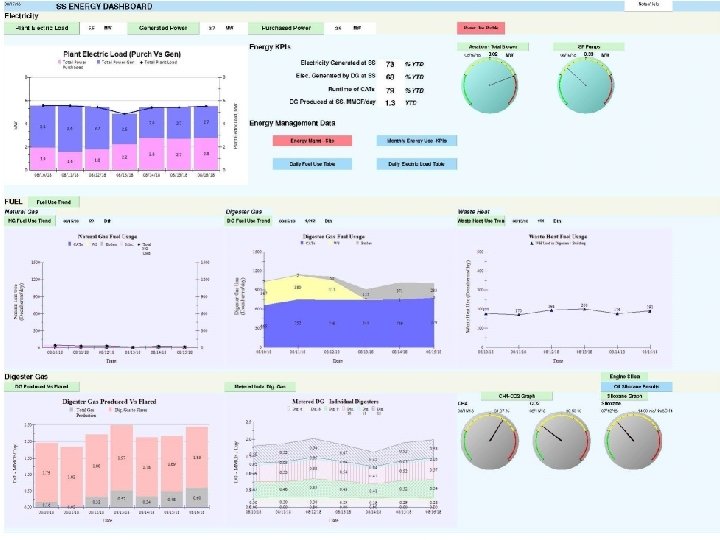
JI Energy Dashboard Milwaukee Metropolitan Sewerage District
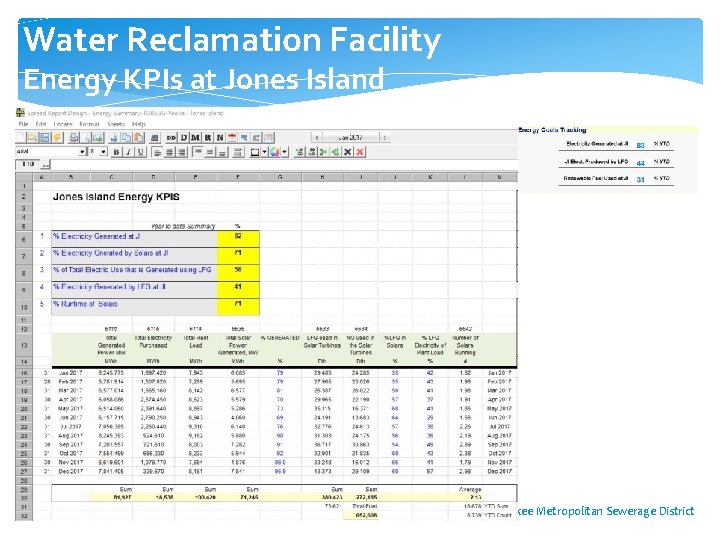
Water Reclamation Facility Energy KPIs at Jones Island Milwaukee Metropolitan Sewerage District
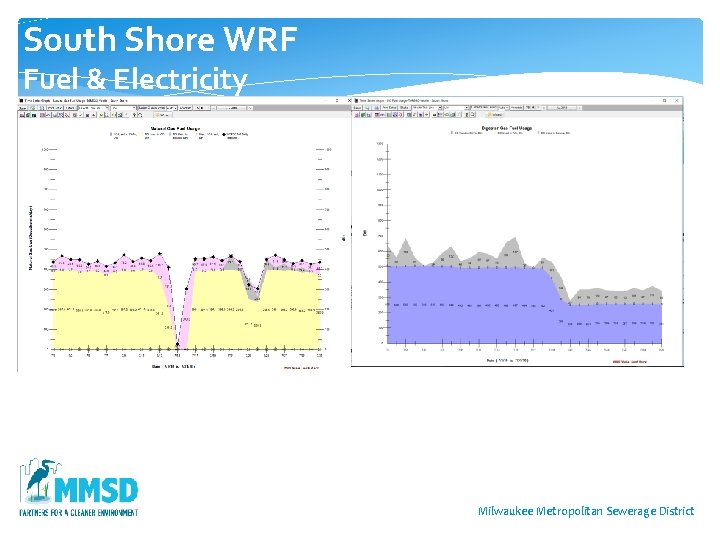
South Shore WRF Fuel & Electricity Milwaukee Metropolitan Sewerage District
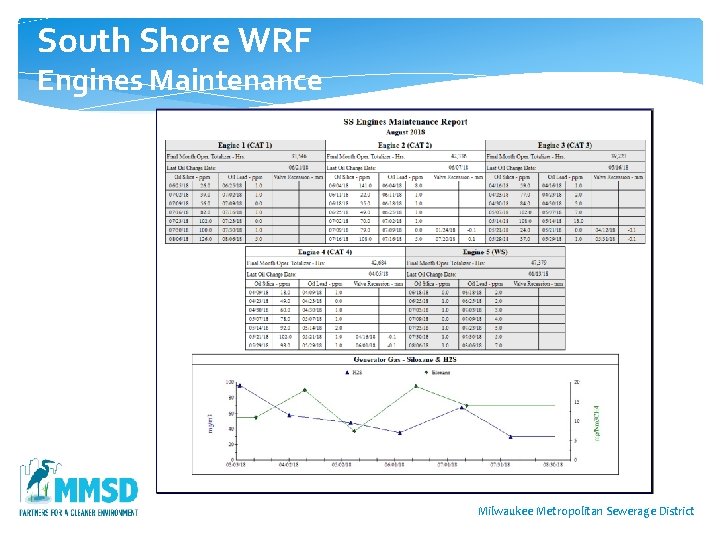
South Shore WRF Engines Maintenance Milwaukee Metropolitan Sewerage District
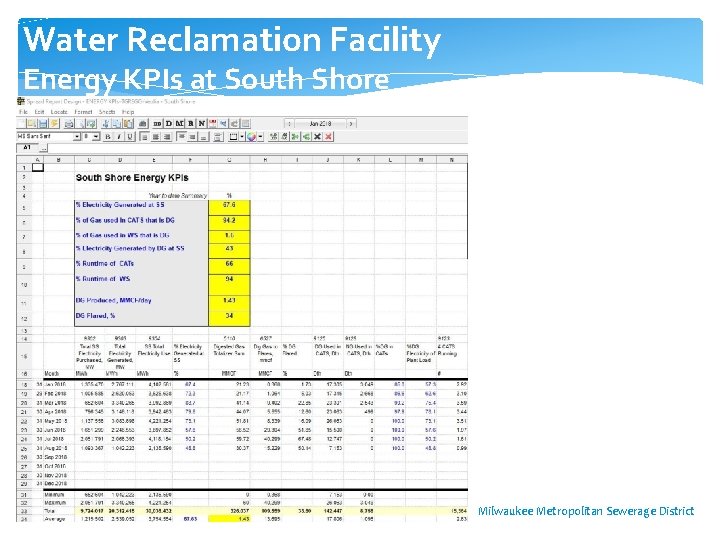
Water Reclamation Facility Energy KPIs at South Shore Milwaukee Metropolitan Sewerage District
Hach WIMS and MMSD Energy Monitoring Next Steps Energy Data and Hach Process: • 2018 & Beyond • • Future Forecasting - > SCOPE 5 & other applications Individual process unit KPI development Identify projects/processes for cost and energy savings Identify Energy reduction considerations Hach WIMS: • 2018 & Beyond • • WE Energies Import Vehicle fuel consumption import Hach Trends / Reporting for long-term KPI Report development Milwaukee Metropolitan Sewerage District
Thank you! Questions? ? ? Milwaukee Metropolitan Sewerage District
- Slides: 22