HOW TO TEST AND DEBUG ASP NET APPLICATIONS

HOW TO TEST AND DEBUG ASP. NET APPLICATIONS. Naga Krishna Ganta Presentation ID: 10 CSCI 5633 -1
HOW TO USE THE EXCEPTION ASSISTANT 1. If you run an application with debugging and an exception occurs, the application enters break mode and the Exception Assistant displays a dialog box. 2. The Exception Assistant provides the name and description of the exception, and it points to the statement in the program that caused the error. It also includes a list of troubleshooting tips that you can click on to display more information. 3. The information provided by the Exception Assistant is often all you need to determine the cause of an error
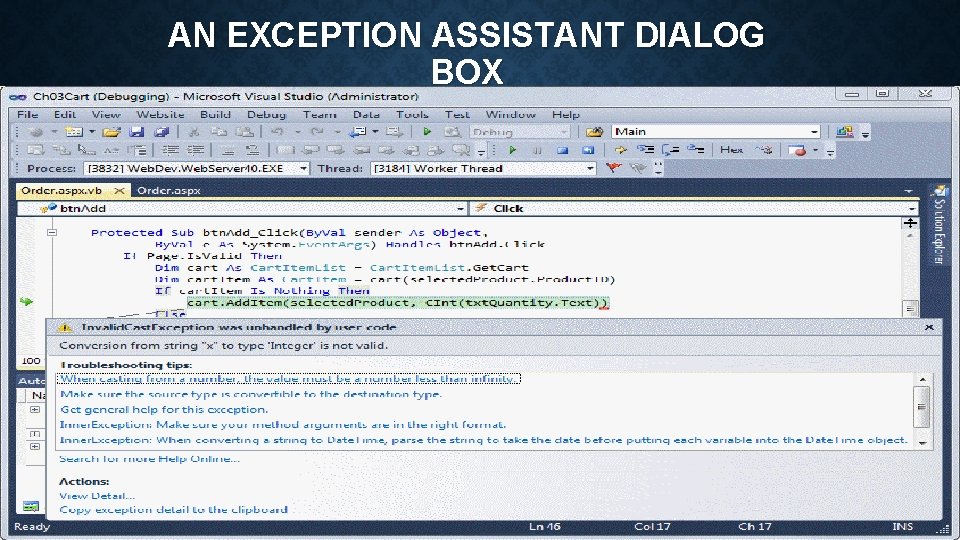
AN EXCEPTION ASSISTANT DIALOG BOX
HOW TO USE THE PAGE INSPECTOR 1. The Page Inspector lets you view the HTML that's generated for the controls on a form. This is easier than running the application in a browser and viewing its source code. The Page Inspector also shows the CSS that's used to format each HTML element. 2. When you use the Page Inspector, you can test the application by entering values and using the controls. Then, you can see how your operations affect the HTML. 3. If you change the aspx or CSS code, the changes are immediately reflected in the Page Inspector. You can also check or uncheck a CSS rule to see its effect on the page.
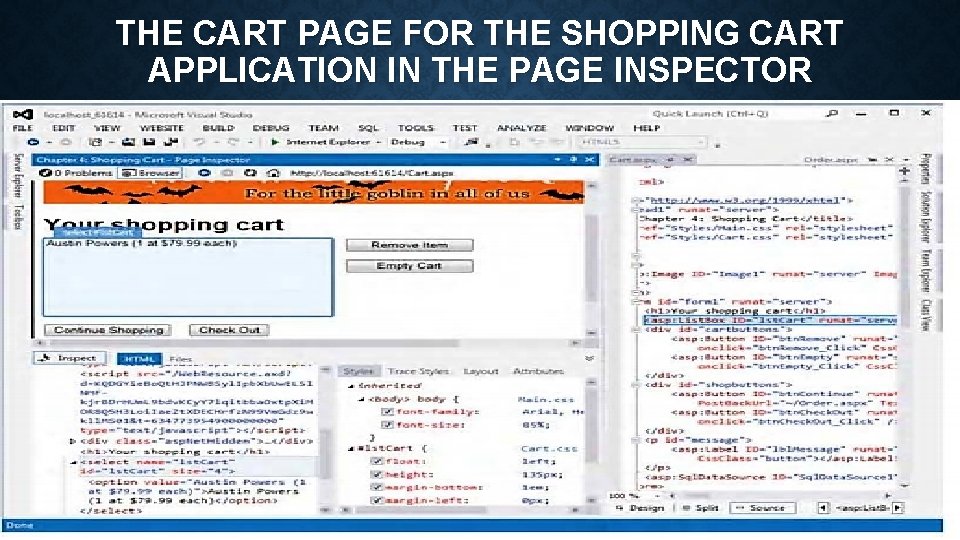
THE CART PAGE FOR THE SHOPPING CART APPLICATION IN THE PAGE INSPECTOR
HOW TO USE THE DEBUGGER • The topics that follow introduce you to the basic techniques for using the Visual Studio debugger to debug an ASP. NET application. Note that these techniques are almost identical to the techniques you use to debug a Windows application. If you've debugged Windows applications, then, you shouldn't have any trouble debugging web applications.

HOW TO USE BREAKPOINTS • A breakpoint is an intentional stopping or pausing place in a program, put in place for debugging purposes. • When ASP. NET encounters a breakpoint, it enters break mode before it executes the statement on which the breakpoint is set. Note, however, that can't set breakpoints on blank lines.
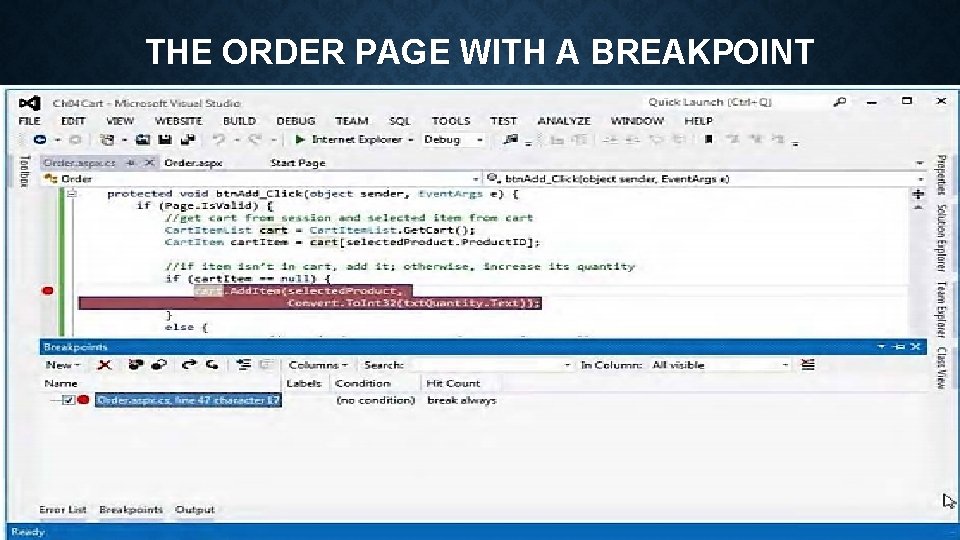
THE ORDER PAGE WITH A BREAKPOINT
HOW TO SET AND CLEAR BREAKPOINTS 1. To set a breakpoint, click in the margin indicator bar to the left of the statement at which you want the break to occur. The statement will be highlighted and a breakpoint indicator (a large dot) will appear in the margin. You can set a breakpoint before you run an application or while you're debugging the application. 2. To remove a breakpoint, click the breakpoint indicator. To remove all breakpoints at once, use the DEBUG~ Delete All Breakpoints command. 3. To disable all breakpoints, use the DEBUG-+ Disable All Breakpoints command. You can later enable the breakpoints by using the DEBUG+Enable All Breakpoints command. 4. To display the Breakpoints window, use the DEBUG~ Windows~ Breakpoints command. Then, you can use this window to go to, delete, enable, disable, label, or filter breakpoints.
HOW TO USE TRACEPOINT • A tracepoint is a special type of breakpoint that lets you perform an action. When ASP. NET encounters a tracepoint, it performs the action. Then, it continues execution if the Continue Execution option is checked or enters break mode if it isn’t. • You typically use tracepoints to print messages to the Output window. A message can include text, values, and special keywords.
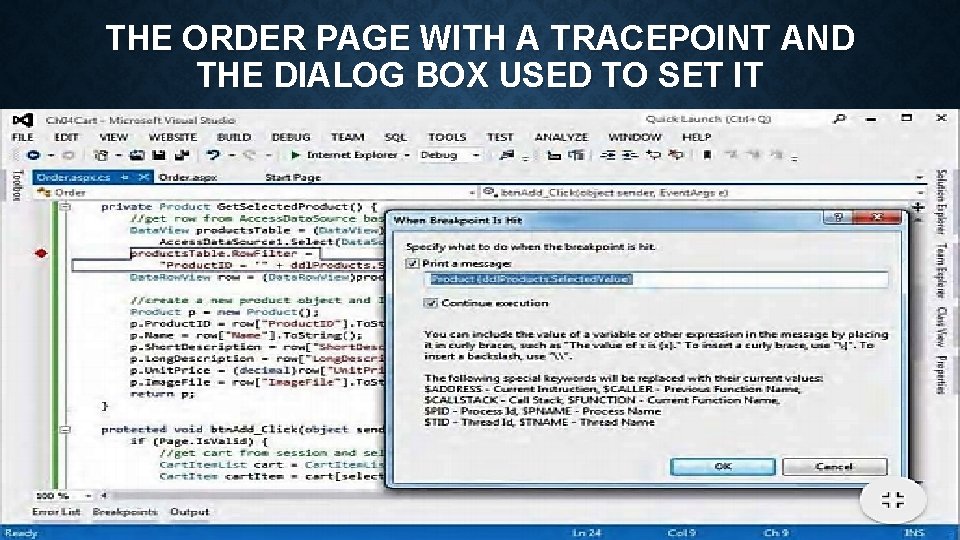
THE ORDER PAGE WITH A TRACEPOINT AND THE DIALOG BOX USED TO SET IT
HOW TO WORK IN BREAK MODE 1. When you enter break mode, the debugger highlights the next statement to be executed. 2. To display the value of a variable or property in a data tip, position the mouse pointer over the variable or property in the Code Editor window. 3. To display the members of an array, structure, or object in a data tip, position the mouse pointer over it to display its data tip, and then point to the plus sign in the data tip.
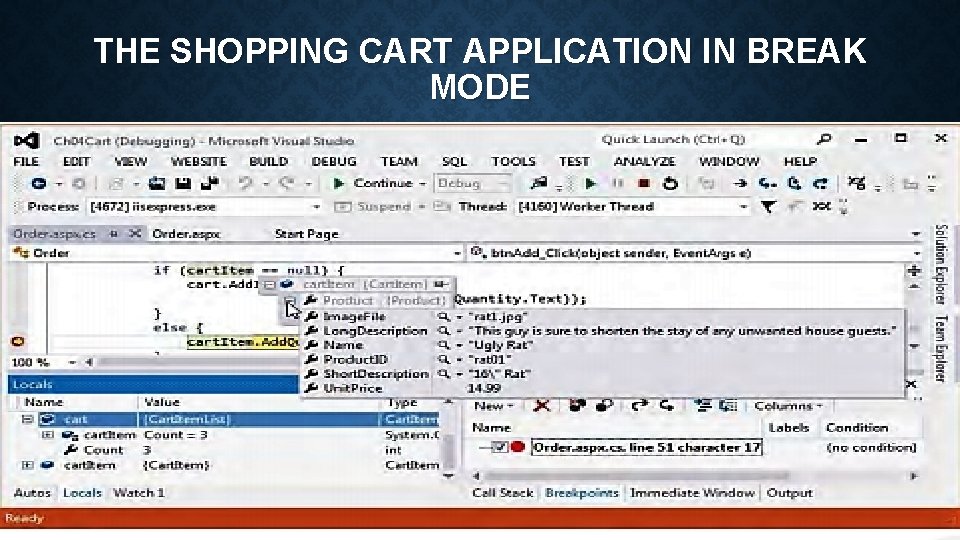
THE SHOPPING CART APPLICATION IN BREAK MODE
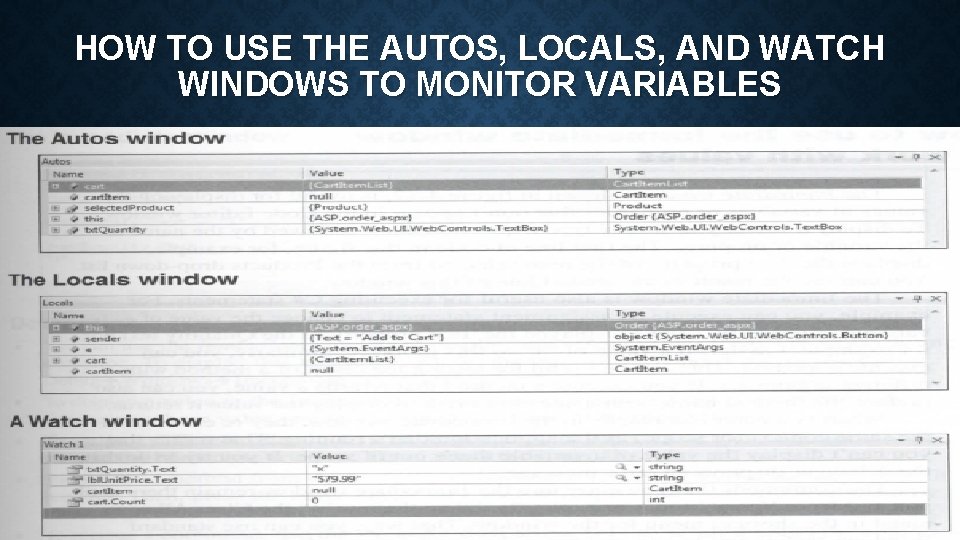
HOW TO USE THE AUTOS, LOCALS, AND WATCH WINDOWS TO MONITOR VARIABLES
1. The Autos window displays information about variables in the current statement and the previous statement. 2. The Locals window displays information about the variables within the scope of the current method. 3. The Watch windows let’s you view the values of variables and expressions you specify, called watch expressions. You can display up to four Watch windows.
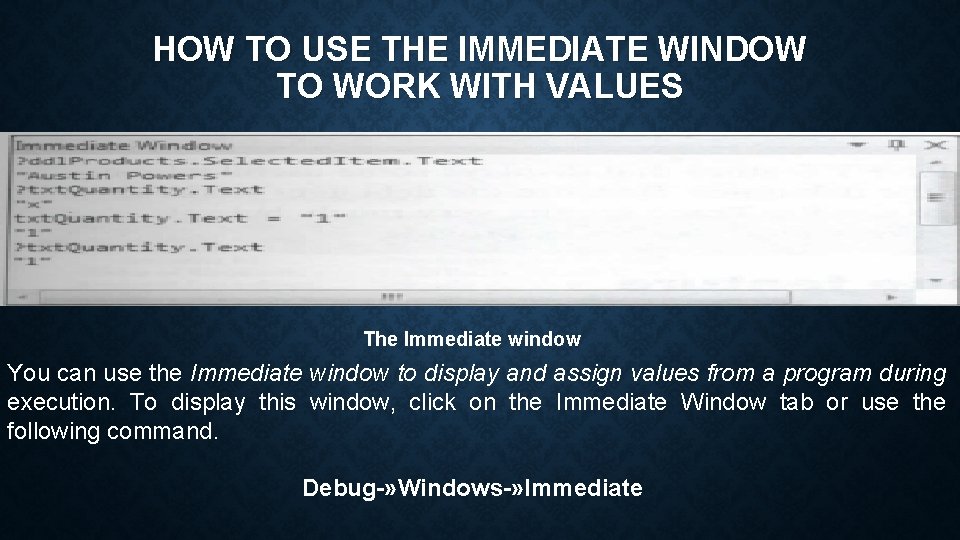
HOW TO USE THE IMMEDIATE WINDOW TO WORK WITH VALUES The Immediate window You can use the Immediate window to display and assign values from a program during execution. To display this window, click on the Immediate Window tab or use the following command. Debug-» Windows-» Immediate
HOW TO USE THE TRACE FEATURE 1. The ASP. NET Trace feature traces the execution of a page and displays trace information and other information at the bottom of that page. 2. To activate the trace feature for a page, you add a Trace attribute to the Page directive at the top of the aspx file for the page and set its value to True as shown above. 3. The trace information is divided into several tables that provide specific types of trace Information.
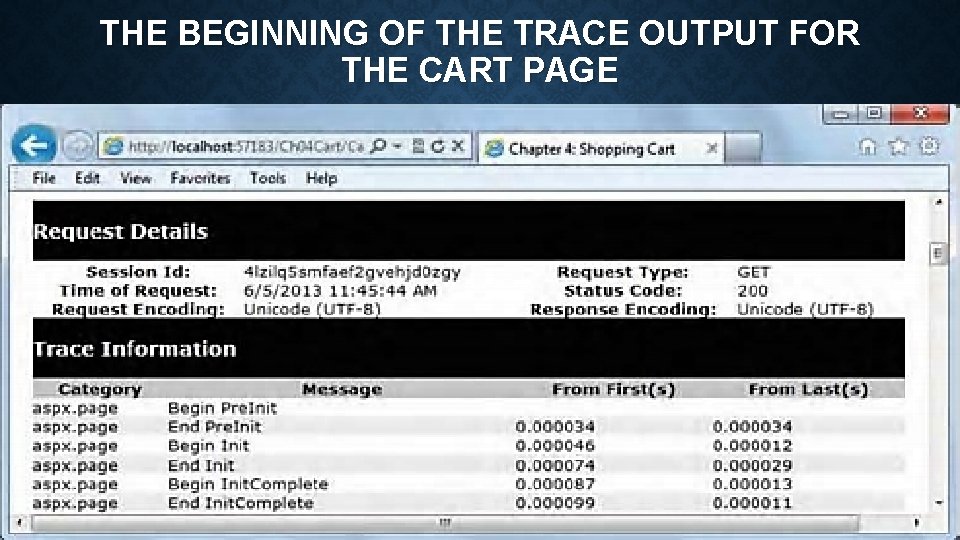
THE BEGINNING OF THE TRACE OUTPUT FOR THE CART PAGE
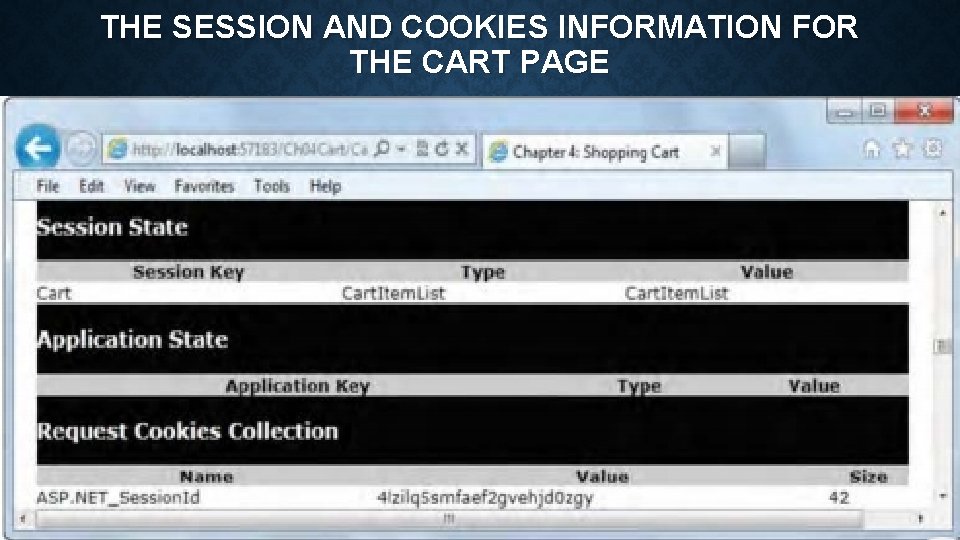
THE SESSION AND COOKIES INFORMATION FOR THE CART PAGE
HOW TO CREATE CUSTOM TRACE MESSAGES 1. You can use the Trace. Context object to write your own messages to the trace output. The Trace. Context object is available through the Trace property of a page. 2. Use the Write method to write a basic text message. Use the Warn method to write a message in red type. 3. Trace messages are written only if tracing is enabled for the page. To determine whether tracing is enabled, you use the ls. Enabled property of the Trace. Context object
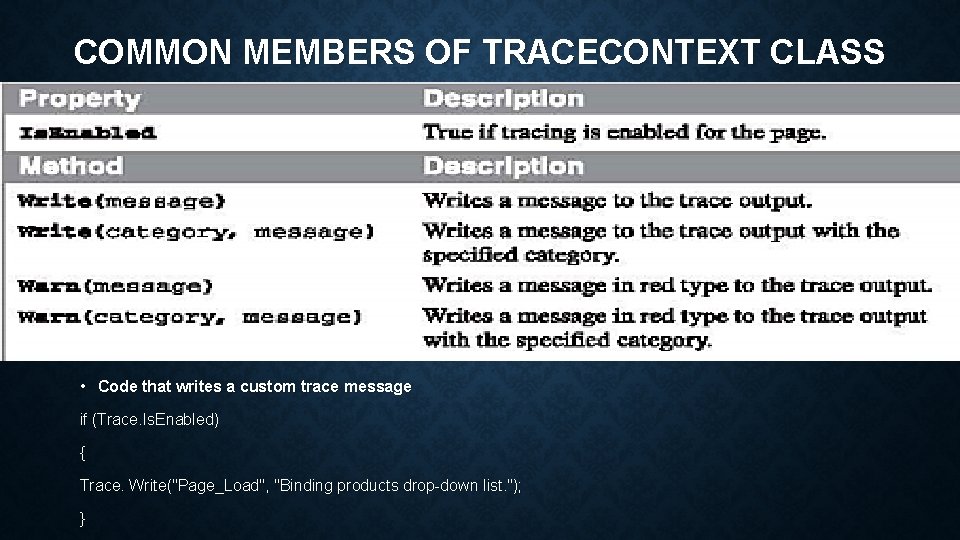
COMMON MEMBERS OF TRACECONTEXT CLASS • Code that writes a custom trace message if (Trace. Is. Enabled) { Trace. Write("Page_Load", "Binding products drop-down list. "); }

Thank you

Queries? ? ?
- Slides: 23