HOW TO MEASURE PROGRESS IN THE PROVISION OF


 2. % of severe PWH")
 • M (proportion missing) = (O) observed prevalence (number of patients")
 Observed 20 Obs - Expected 20 =0")
 BETTER 0 Observed 15 Obs - Expected 20 -5 -5 -10")
, year 2013")

 Severe PWH = 50% Non-severe PWH")
 75 Severe PWH = 75% Non-severe PWH WORSE 50 25 BETTER")


 2. % of severe PWH")


- Slides: 25
HOW TO MEASURE PROGRESS IN THE PROVISION OF CARE FOR HEMOPHILIA Alfonso Iorio J Stonebraker, M Brooker, M Soucie. A workgroup of the Data and Demographics committee
Disclosures for A. Iorio Shareholder Grant / Research Support None Funds managed via Institution (Bayer, Baxter, Bio. Gen, Novo. Nordisk) Consultant Funds managed via Institution (Pfizer, Bayer, Biogen, Novo. Nordisk, Octapharma) Employee Mc. Master University Paid Instructor None Speaker bureau None Other PI of the WAPPS project, co-investigator of PROBE Chair of the Data&Demographics Committee WFH, CFGD RG Cochrane Collaboration Editor
Background • “ 20% of PWH receive 80% of the hemophilia care provided” • Jones (1995): 80% of PWHA have NO access to f. VIII therapy. • Jones and Robillard (2003): the 90 s 80% estimates was neither – Backed up by any worldwide demographic information on hemophilia nor – Accompanied by any good information on which countries presented the best opportunities for development
Aim of project • General: identifying indicators of coverage /quality of the health care for PWH • Specific: demographic measures for crosssectional and longitudinal evaluation
Status of the project Definition of indicators Protocol definition Mock table definition Data “collection” Report to the D&D and MAB
Methods Data extraction from Global Survey and demographic sources Exploratory calculations Proposed interpretation
Male population year 2013
PWH year 2013
Selected indicators 1. Rate of Missing PWH (0 -E) 2. % of severe PWH 3. Survival of PWH
Missing (0 -E) • M (proportion missing) = (O) observed prevalence (number of patients [age 5 -18] / number of males [age 5 -18] - (E) expect incidence (as cases x 100, 000 males) • (O) will be calculated using the number of patient in the age band 5 -18 from the WFH global survey and the number of males will be extracted from a reliable source for the corresponding year, e. g. – – • CIA world fact – https: //www. cia. gov/library/publications/the-world-factbook/ UN population - http: //esa. un. org/unpd/wpp/Excel-Data/population. htm) (E) will be estimated from established registries (UK, Canada, Australia, France, UDC, Italy). For the current estimate we have summed the upper limit of the confidence intervals for HA (18. 8) and HB (4. 3) from Stonebraker et al papers (refs), and assumed the prevalence to be 23. 1 per 100, 000 males. Number of patients in developing world registries (Iran, South Africa – Taiwan, Japan) will also be considered as a benchmark.
Missing (0 -E) Observed 20 Obs - Expected 20 =0
Missing (0 -E) BETTER 0 Observed 15 Obs - Expected 20 -5 -5 -10 WORSE
Rate of “Missing” PWH (x 100, 000 males), year 2013
% of severe PWH • % PROPORTION OF SEVERE HEMOPHILIACS • • R s/t (ratio severe/total) = number severe patients (s) / (total number of patients)(t) * 100 • • The true value of this indicator is unknown; it will be higher when less mild and moderate than severe patients are identified and contribute to the total number of patients; values will be lower (e. g. 50 to 20%), when more mild and moderate than severe patients are identified and contribute to the total number of patients. A reference norm will be estimated from high quality registry data
Missing (0 -E) Severe PWH = 50% Non-severe PWH
Missing (0 -E) 75 Severe PWH = 75% Non-severe PWH WORSE 50 25 BETTER
% severe PWH year 2013
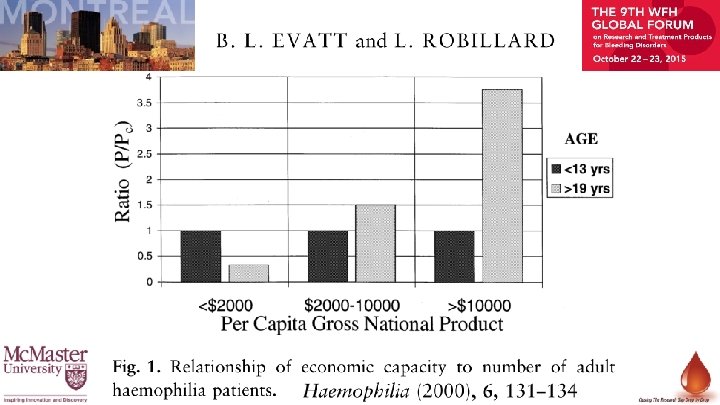
Estimating survival in PWH • Ratio of old to young hemophiliacs • Ratio of the prevalence of Hemophilia in the age band 19 -44 (older) and prevalence in the age band 5 -18 (younger), where the rates are calculate as hemophilia patients x 100, 000 males in the age band. • If the old/young ratio in hemophilia is similar to the old/young ratio in the general population for the country the ratio of these two ratios (hemophilia ratio/general population ratio) will be close to one. If mortality is higher in hemophilia then this ratio will be less than 1.
Survivability: Ratio of hemophilia versus general population Adult/young PWH prevalence 1. 5 =1 Adult/Young males 1. 5 Adult PWH prevalence Young 20 20
Survivability: Ratio of hemophilia versus general population Adult/young PWH BETTER ? 2 1. 92 = 0. 85 Adult/Young males 2. 25 1 0. 5 WORSE
Survivability: Ratio of hemophilia versus general population Adult/young PWH 1. 5 Adult/Young males 1. 5
Selected indicators 1. Rate of Missing PWH (0 -E) 2. % of severe PWH 3. Survival of PWH
Conclusion We have described 3 simple demographic indicators of health care for hemophilia Longitudinal analysis Exploratory calculations Proposed interpretation
Thanks Question time