HOW TO LIE CHEAT MANIPULATE AND MISLEAD Information


- Slides: 22
HOW TO LIE, CHEAT, MANIPULATE, AND MISLEAD!
Information Age We are known as the information age because of how important data and statistics are in our lives Literacy is more crucial than ever, needing to understand the massive amount of information being thrown at us, primarily on the web
Statistics is the science of making effective use of numerical data It deals with: Collection Analysis Interpretation of data
Collection of Data In order to analyze and interpret data, we must first collect it The data collected is known as a sample The sample is collected from a population
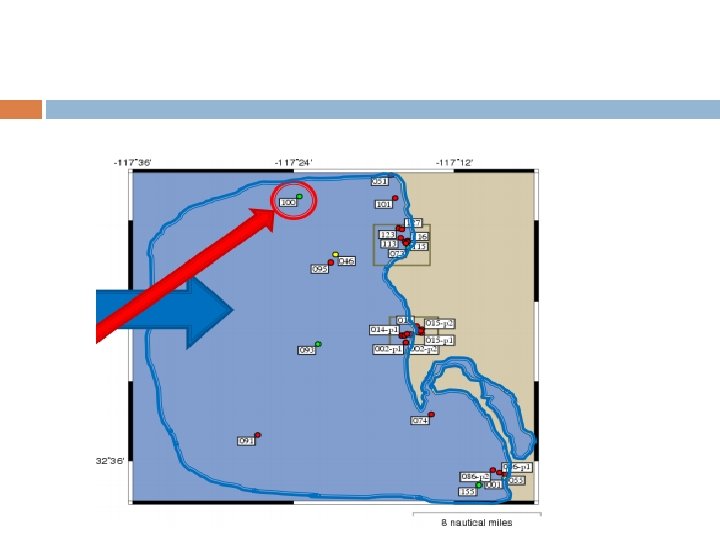
Ocean Temperature Sample Let’s say we want to analyze the San Diego ocean temperatures Our population was the ocean off the coast of San Diego Our sample was the temperatures recorded by Buoy 100 over the last 9 years
Deception If were to claim that the results were representative of Cali coastal waters, So. Cal coastal waters, and San Diego coastal water, this would be biased sampling We could use this to manipulate, cheat, or mislead the general public
Biased Sampling Different types of biased sampling include: Area bias Self-Selection bias Leading Question bias Social desirability bias
Area Bias Going back to the California coast example would be an example of perpetrating area bias The area of your sample needs to be representative of the study population When reading news stories or scientific articles, make sure to check for area bias
Further Area Bias: World Wildlife Fund has written on the threats posed to polar bears from global warming According to them, about 20 distinct polar bear populations exist, accounting for app. 20, 000 polar bears worldwide Out of these, only 2 groups are decreasing 10 populations are stable 2 are increasing 6 are unknown
Self-Selection Bias In self-selection bias, a participant’s decision to participate may be correlated with traits that affect the study, making the participants a nonrepresentative sample Example, setting up a booth at the mall asking about grooming habits People who respond are probably more likely to be those who primp in the morning than those who look like trash
Leading Question Bias Do you think that teachers are paid too little given the amount of hours that go into teaching (planning, grading, etc. . )? Yes. They should earn more. No. They should not. I don’t care. The tone of the question suggest what the answer should be
Social Desirability Bias If you ask people in a survey about how often they shower, or how often they recycle, your data will be biased by the fact that nobody wants to admit to only showering 1 -2 x a week
Adding in a sampling bias into your data collection is an important tool if you want to lie, cheat, manipulate, or mislead with your study results
Analyzing Data analysis is a process of gathering, modeling, and transforming data with the goal of highlighting useful information, suggesting conclusions, and supporting decision making
Other ways to lie, cheat, manipulate What if you were a real-estate agent trying to convince people to move into a certain neighborhood You could tell the potential buyer with perfect honesty that the average income in the neighborhood is: 150 k 35 k 10 k
150 k is the mean of all the families in the neighborhood 35 k is the median 10 k is the mode
Graphical Displays A surefire way to lie, cheat, manipulate, or mislead with ease The Principals of Graphical Excellence are: Well-designed Substance, Complex presentation of interesting data stats, and design ideas communicated with clarity, precision, and efficiency Gives the viewer the greatest number of ideas in the shortest time with the least ink in the smallest space
Bar Charts
Volume Charts are even MORE FUN!