How to Interpret an ECG Chapter 22 ECG


 • Entirely")


- Slides: 68
How to Interpret an ECG Chapter 22
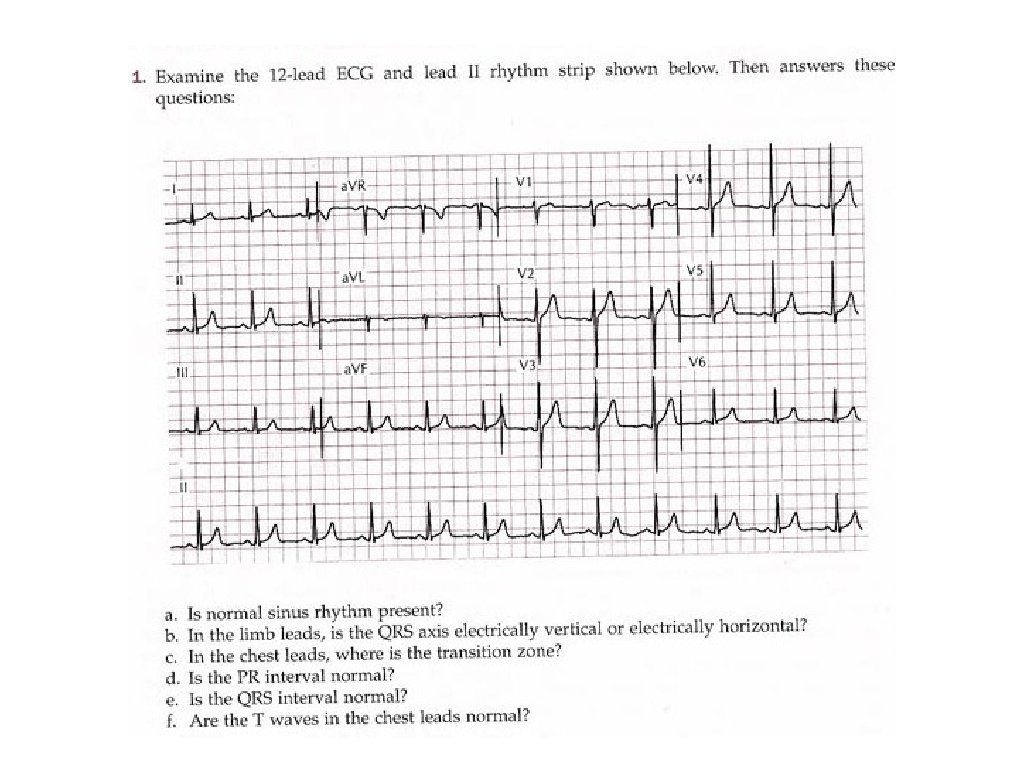
ECG Analysis • • Standardization Heart Rate Rhythm PR interval P wave QRS complex (width, interval, and voltage) Axis
Standardization
ECG Paper • Standardization mark • 10 mm vertical deflection = 1 m. Volt
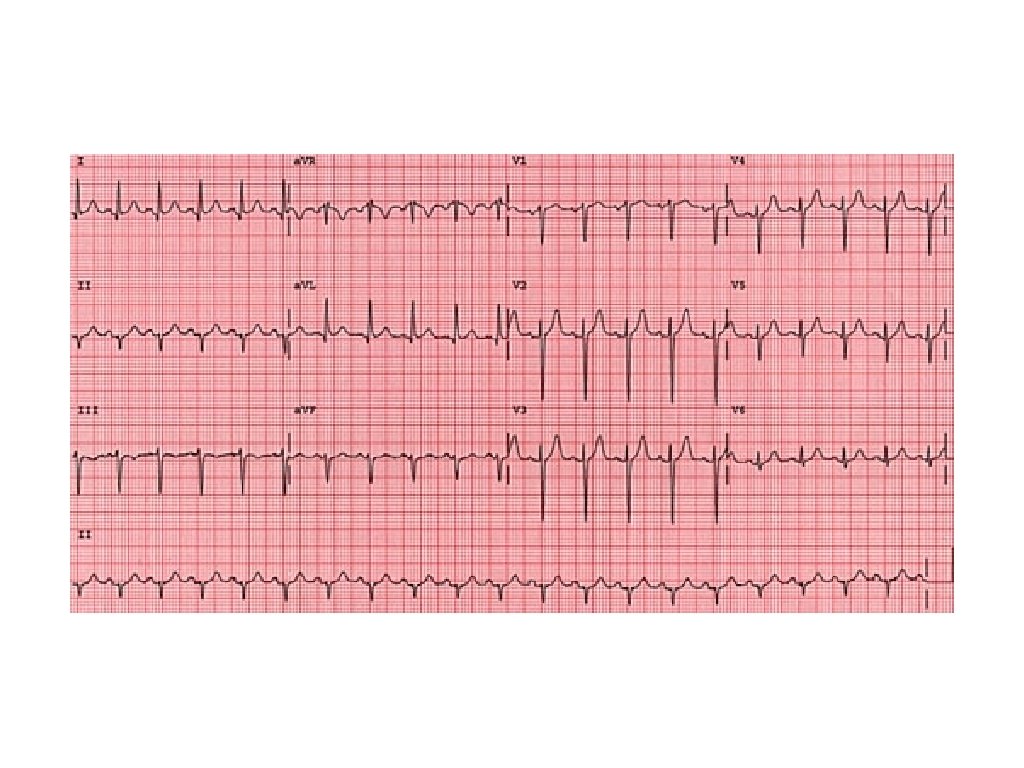
Heart Rate • RR interval • PP interval
Heart Rate Calculation 1500 divided by the number of small boxes between two R waves 300 divided by the number of large boxes between two R waves • most accurate • take time to calculate 1 lg sq = 300 bpm • only use with regular 2 lg sq = 150 bpm rhythms • quick • not too accurate • only use with regular rhythm • less precise 10 multiplied by the • use with irregular number of R waves in 6 rhythms seconds • very quick 3 lg sq = 100 bpm 4 lg sq = 75 bpm 5 lg sq = 60 bpm 6 lg sq = 50 bpm
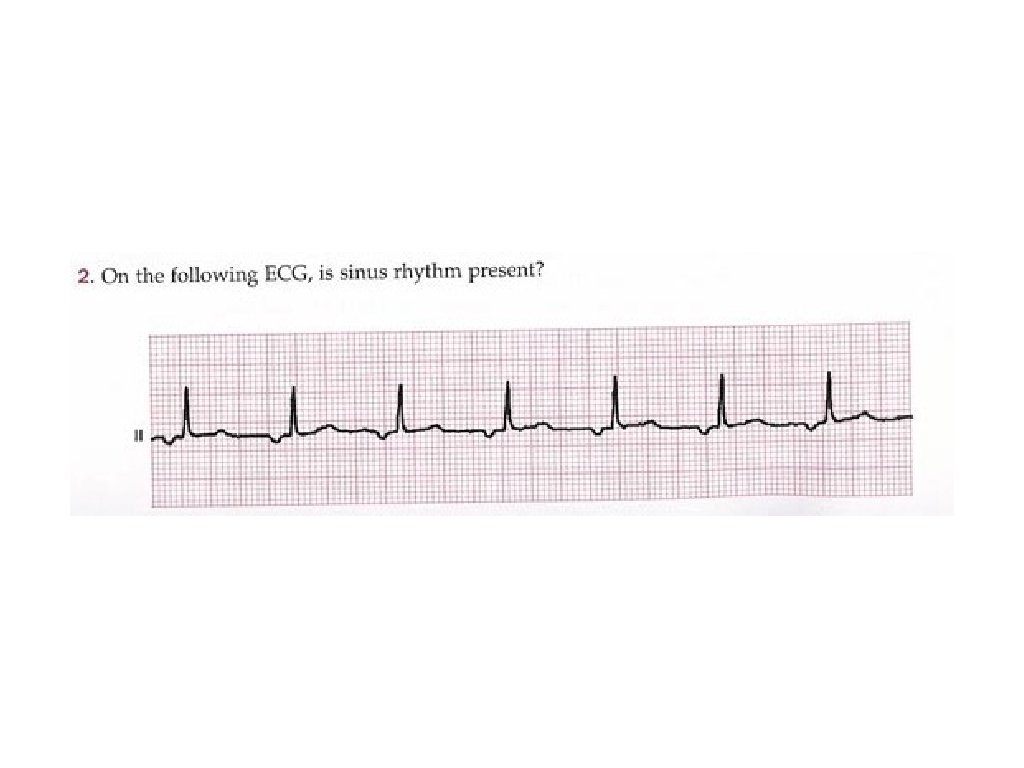
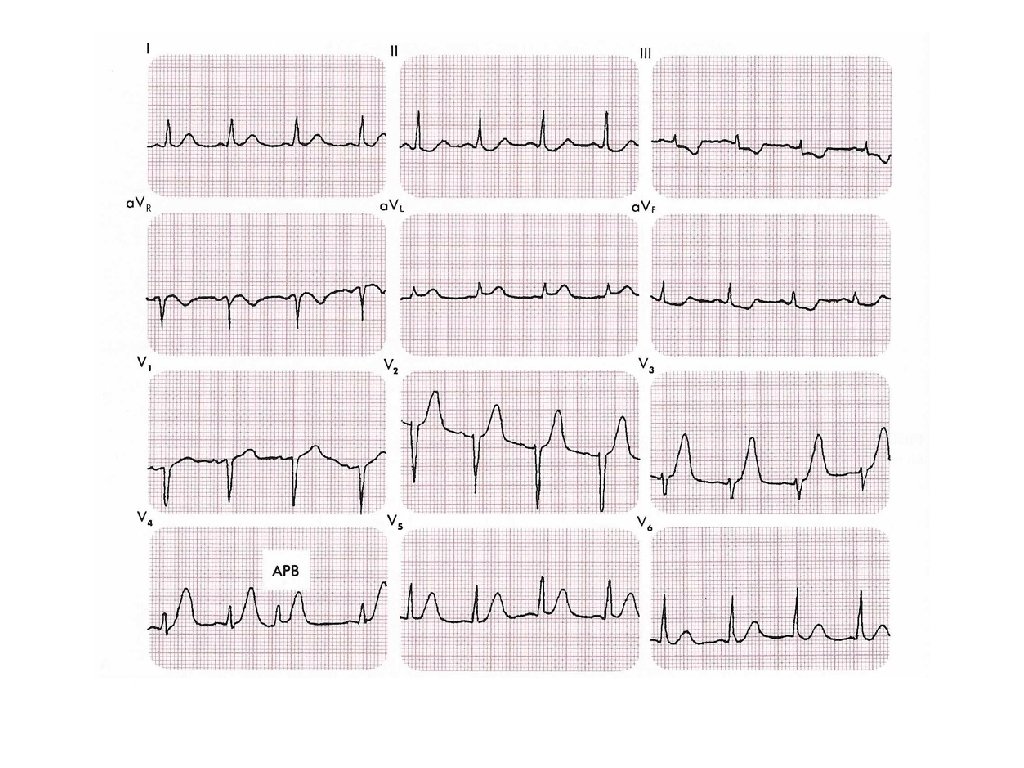
Rhythm • Sinus rhythm with extra beats (e. g. APB or VPB) • Entirely ectopic beats: • atrial fib, v-tach, junctional rhythm • AV dissociation rhythm (e. g. second or third degree heart block)
PR Interval • Long PR interval = first degree AV block • Short PR interval = WPW • Short PR interval with inverted P waves = ectopic atrial or junctional pacemaker
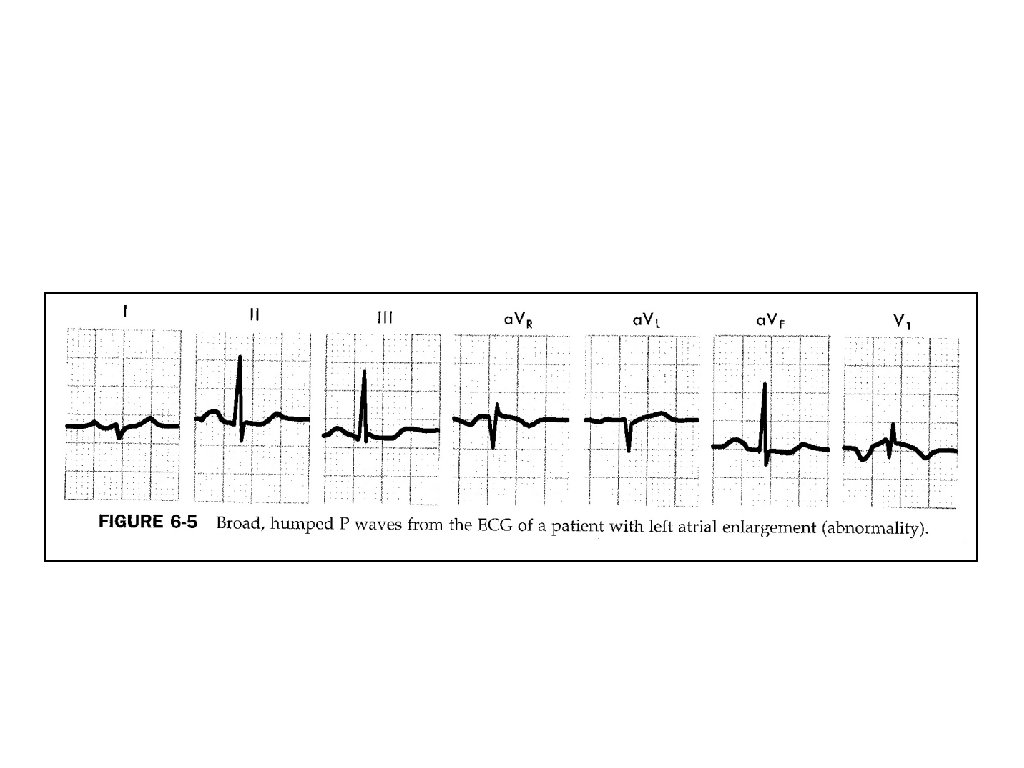
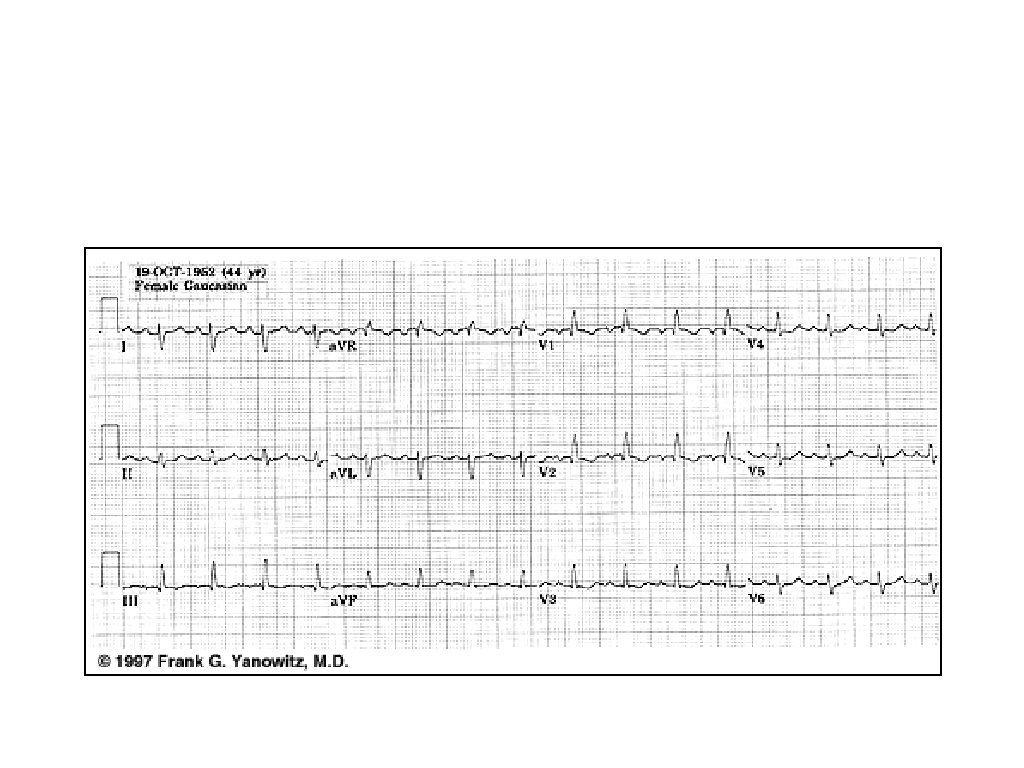
P wave • Tall = RAE • Wide = LAE
ECG Waves • P wave • atrial depolarization • ≤ 2. 5 mm in amplitude • < 0. 12 sec in width • PR interval (0. 12 - 0. 20 sec. ) • time of stimulus through atria and AV node • prolonged interval = first-degree heart block
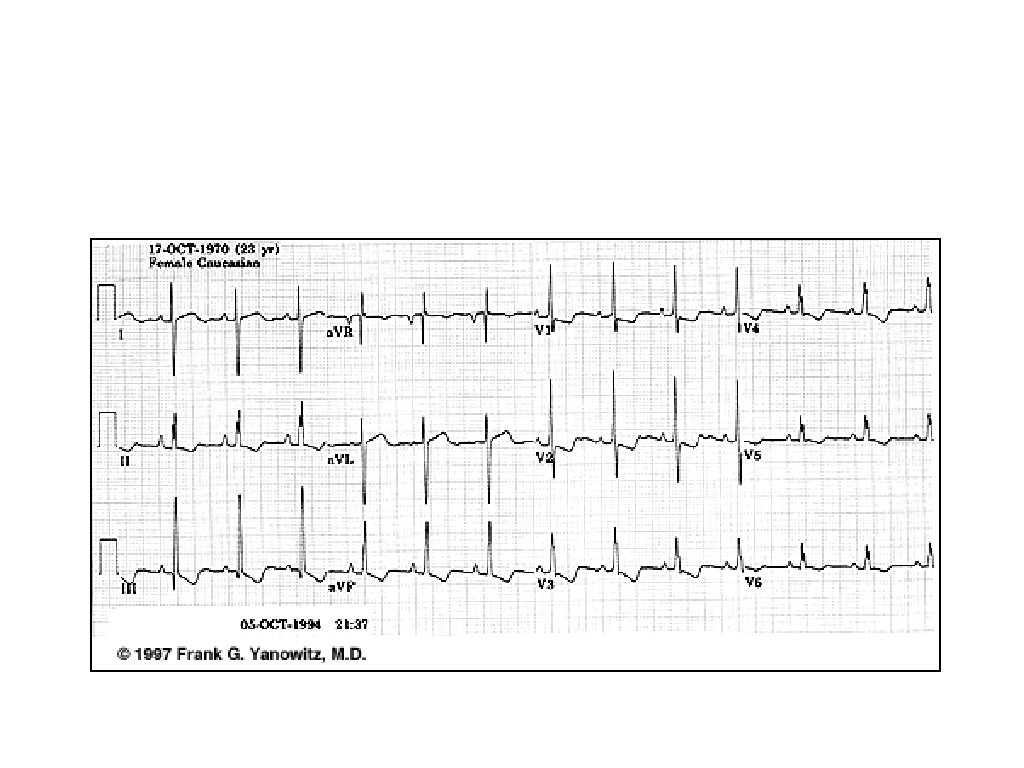
Right Atrial Abnormality • Tall P waves in any of the following leads: • II, III, a. VF or sometimes V 1.
• Left Atrial Abnormality Leads I and/or II may show notched P waves • • • (second hump due to delayed depolarization of the left atrium) (P mitrale: mitral valve disease) V 1 may show a bi-phasic P wave • • negative part is > 0. 4 sec. or 1 mm in depth (right atria is anterior to the left atria)
QRS Width • Wide • RBBB or LBBB • Premature ventricular beats • WPW
ECG Waves • QRS • width usually 0. 12 second or less
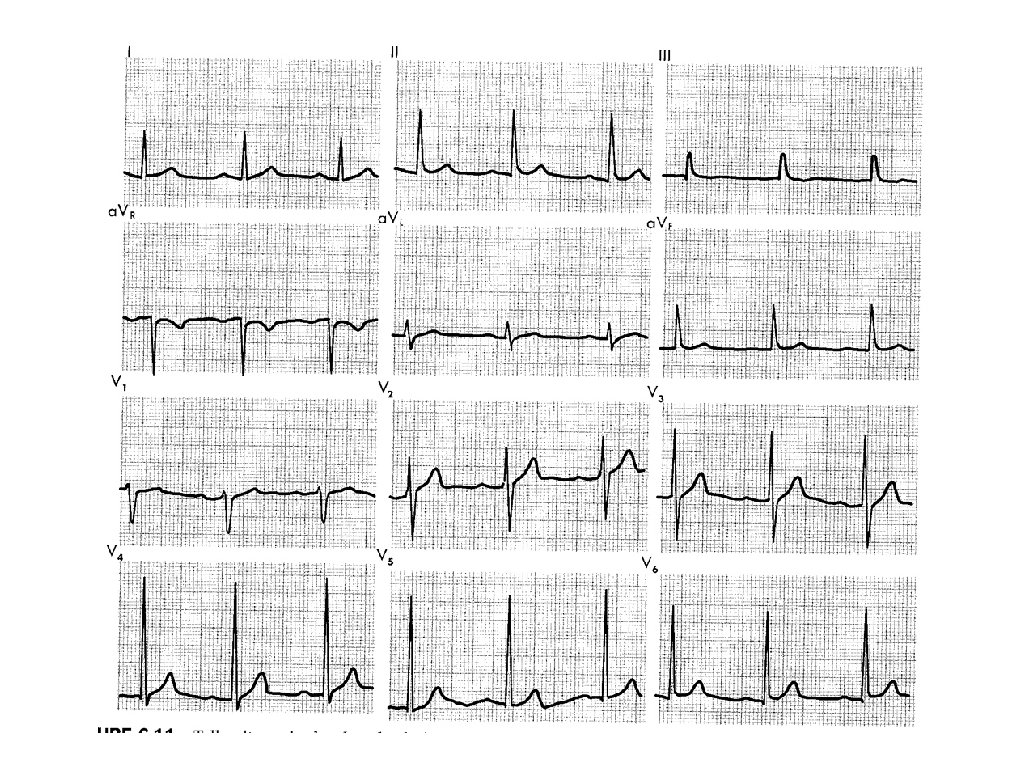
Normal QRS V 6? V 1? Fig. 4 -6 V 1? V 6?
Normal QRS • Septal r wave • Septal q wave
QT Interval • Long • Short
ECG Waves • Rate Corrected QT Interval • QTc = QT divided by square root of RR • normal is less than or equal to 0. 44 sec.
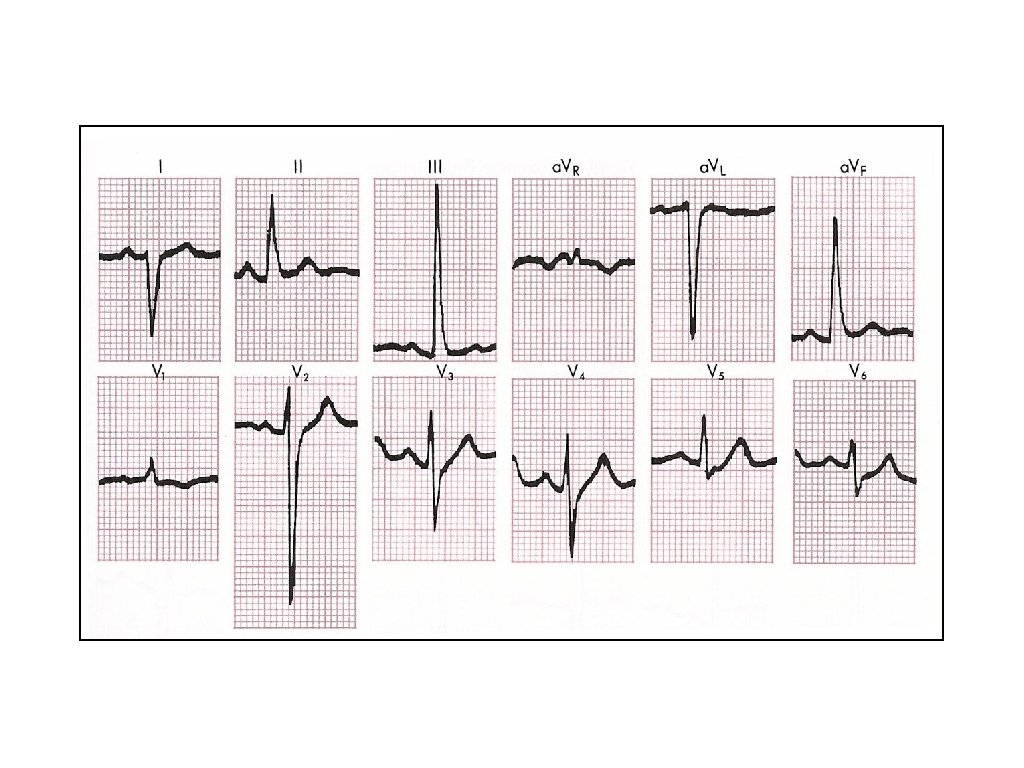
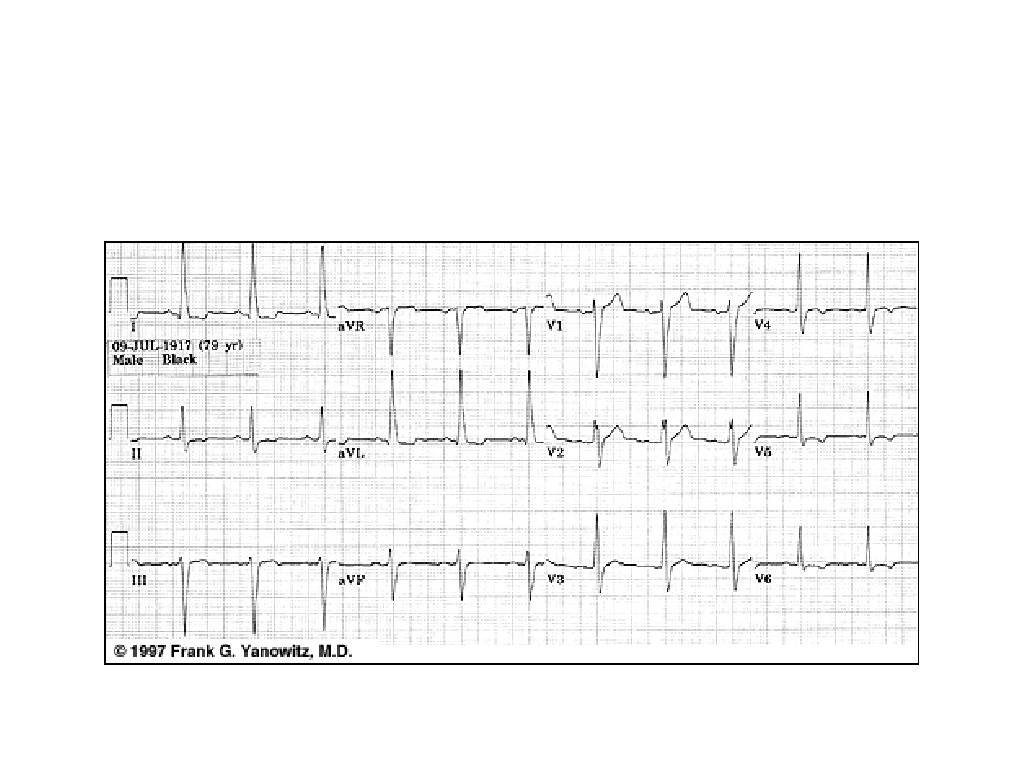
QRS Voltage • RVH • LVH
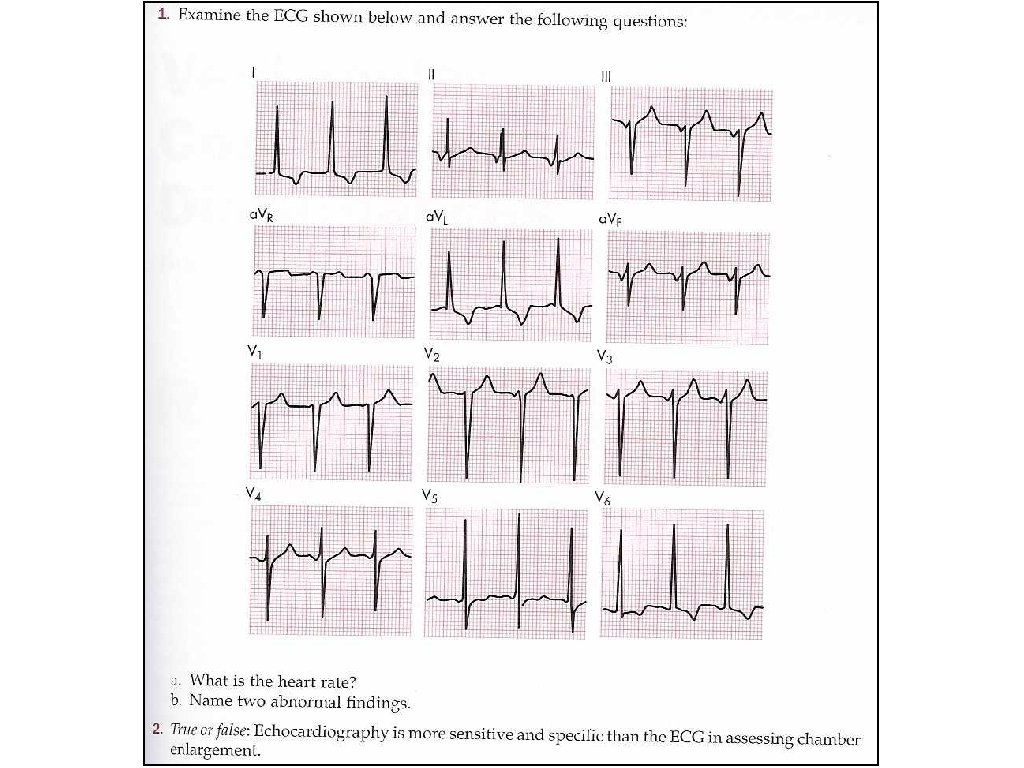
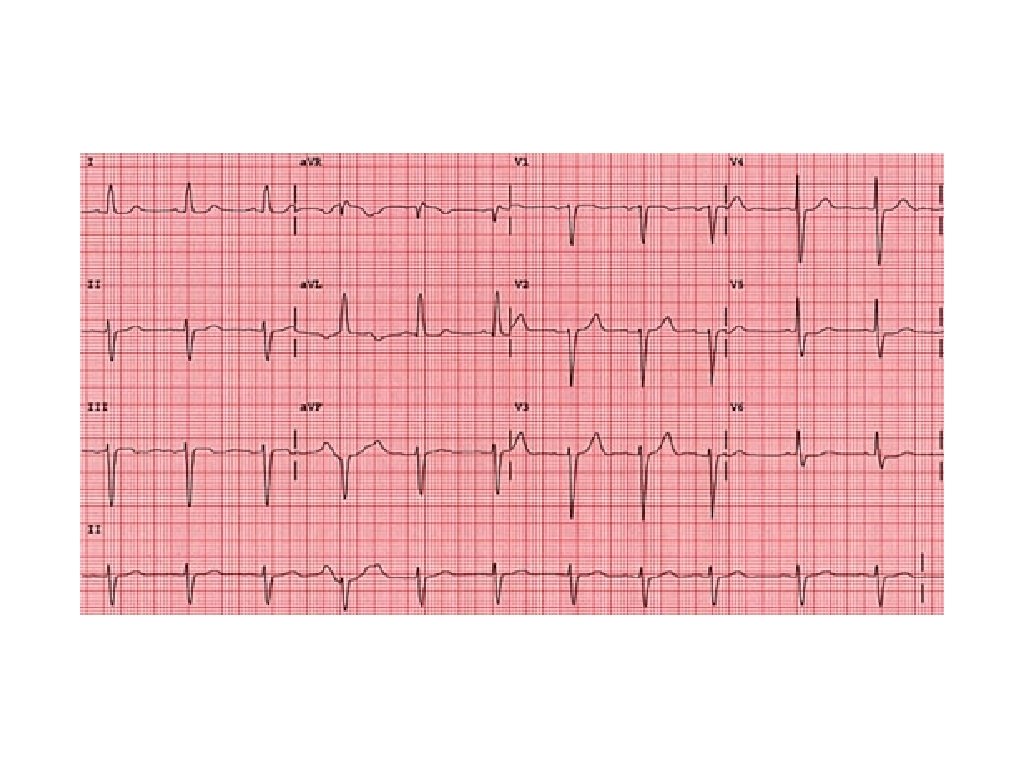
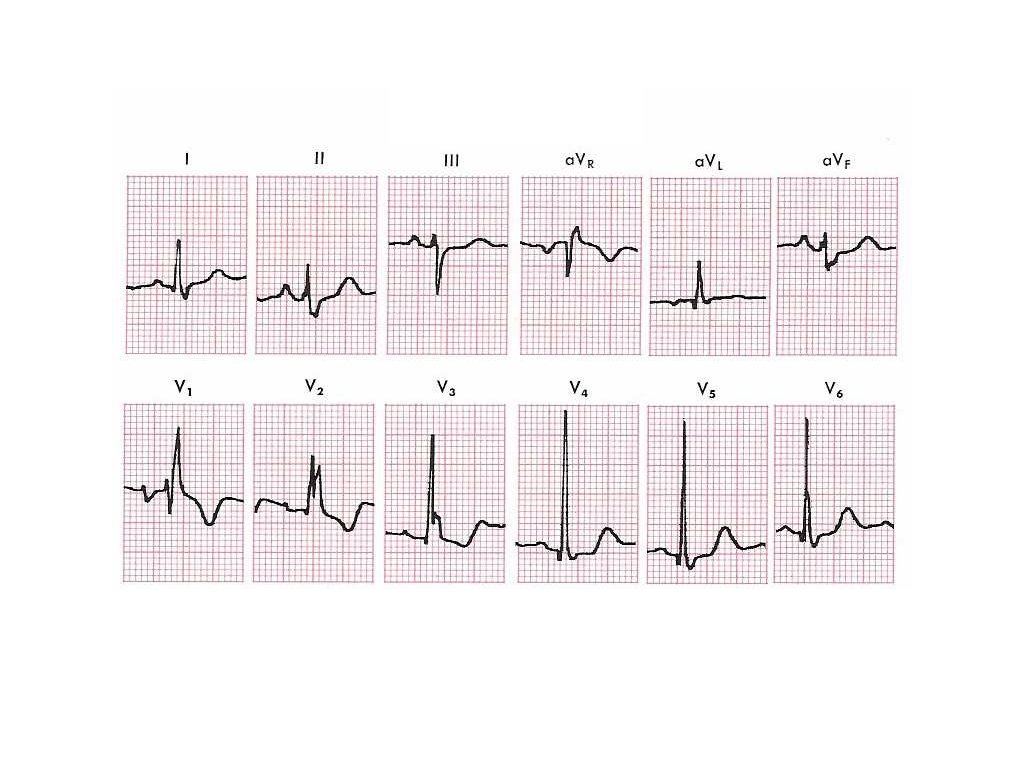
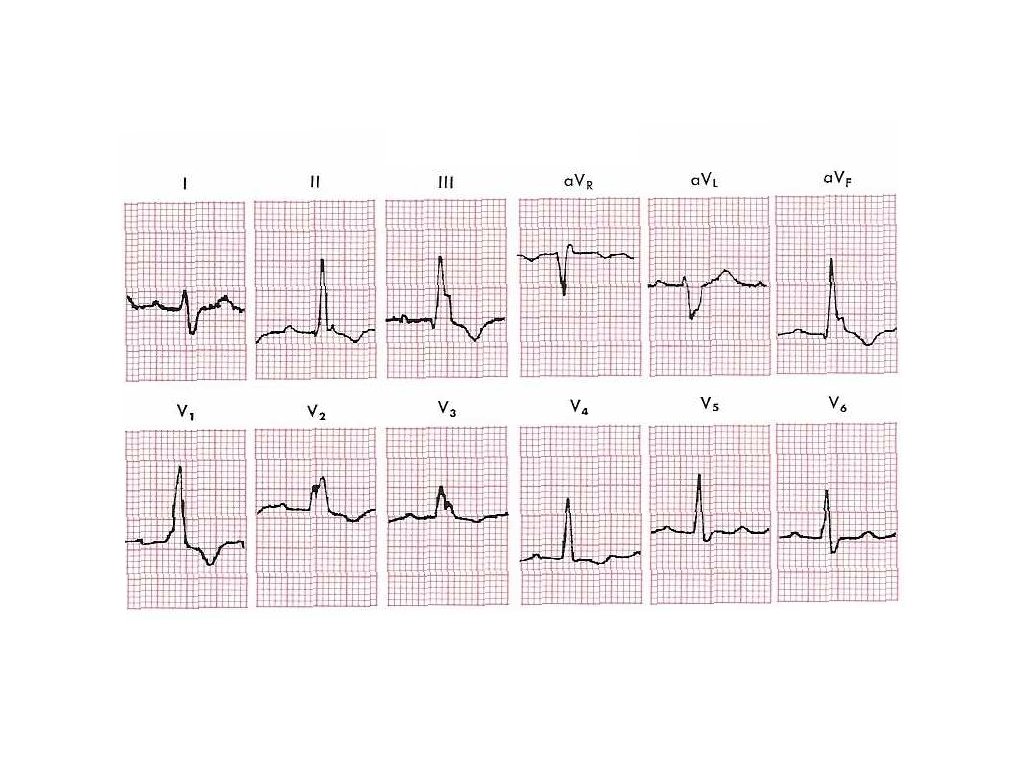
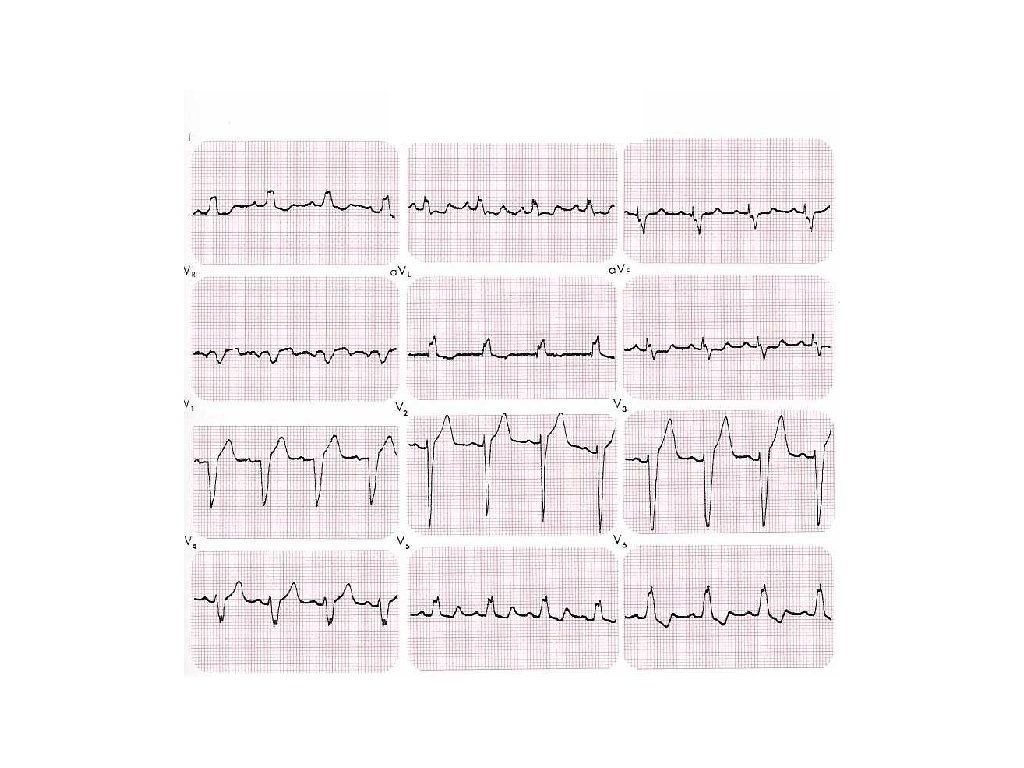
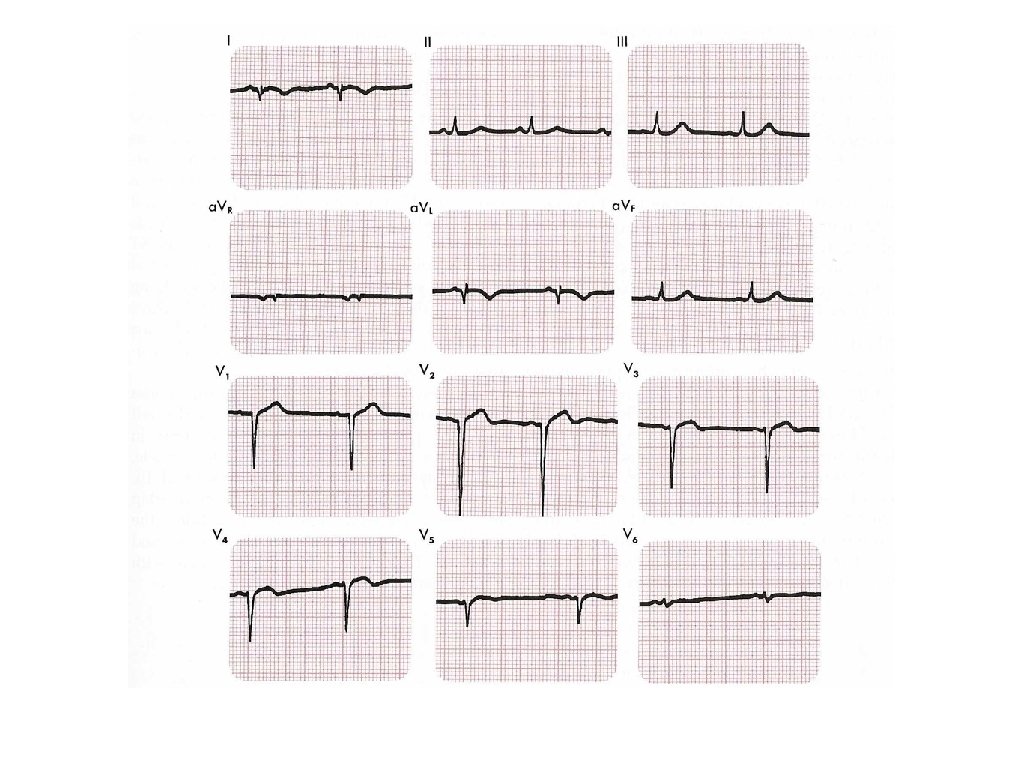
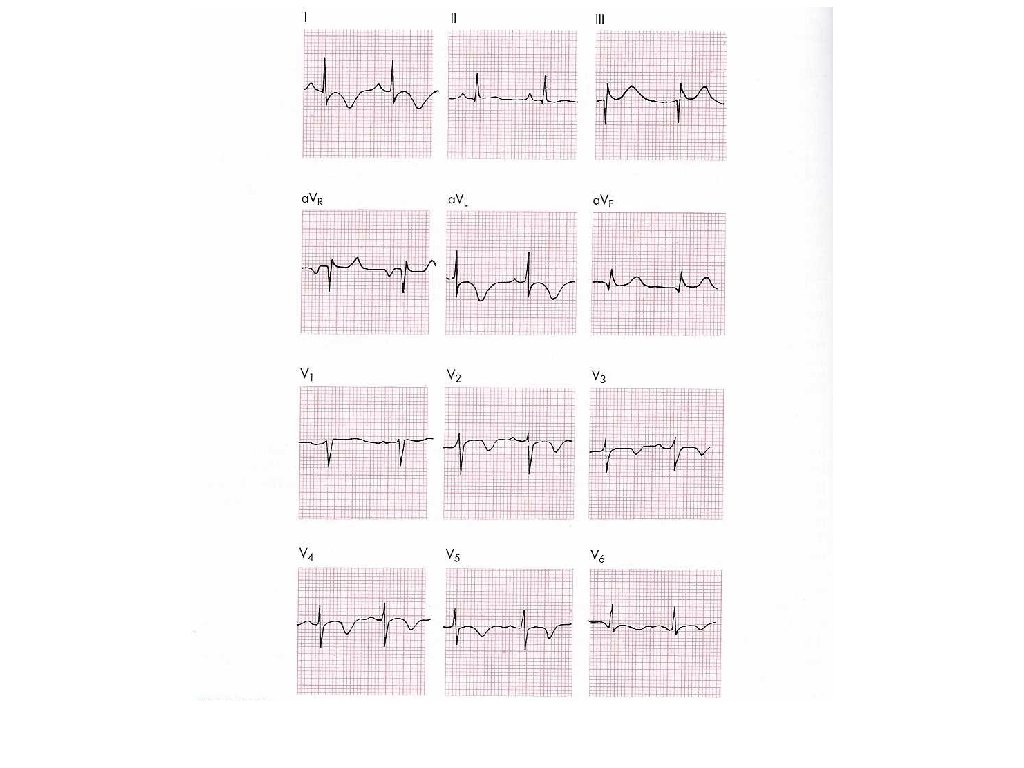
Right Ventricular Hypertrophy 1. In V 1, R wave is greater than the S wave 1. Just a tall wave in V 1 2. In V 1, T wave inversion (reason unknown) 3. Right axis deviation
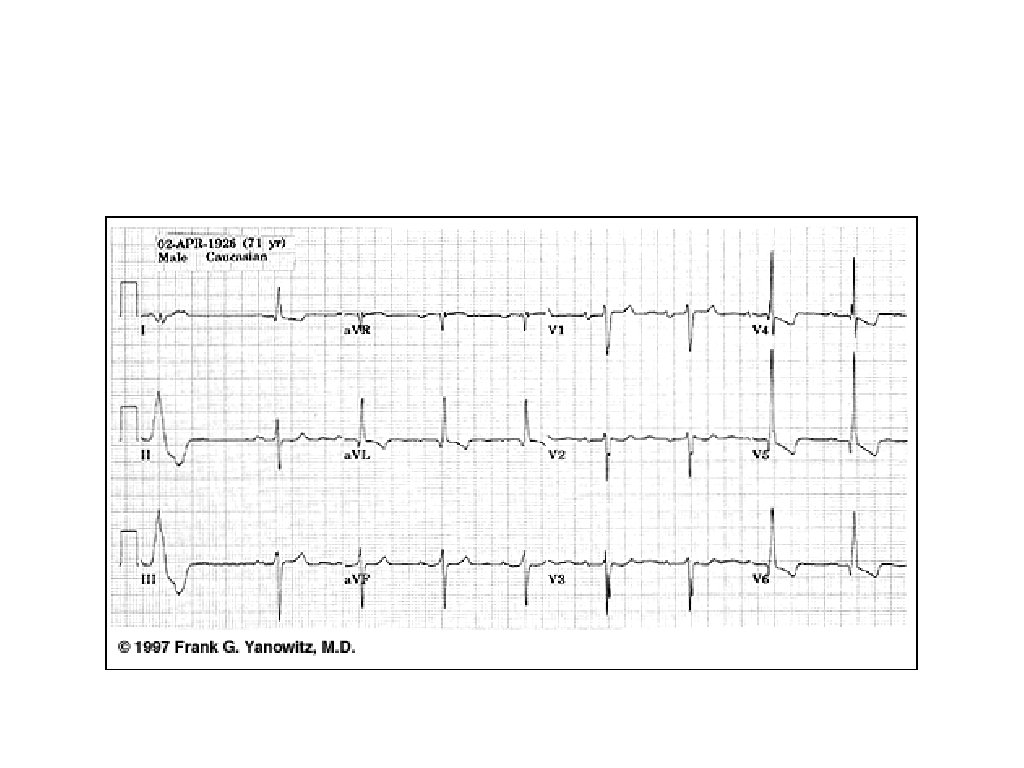
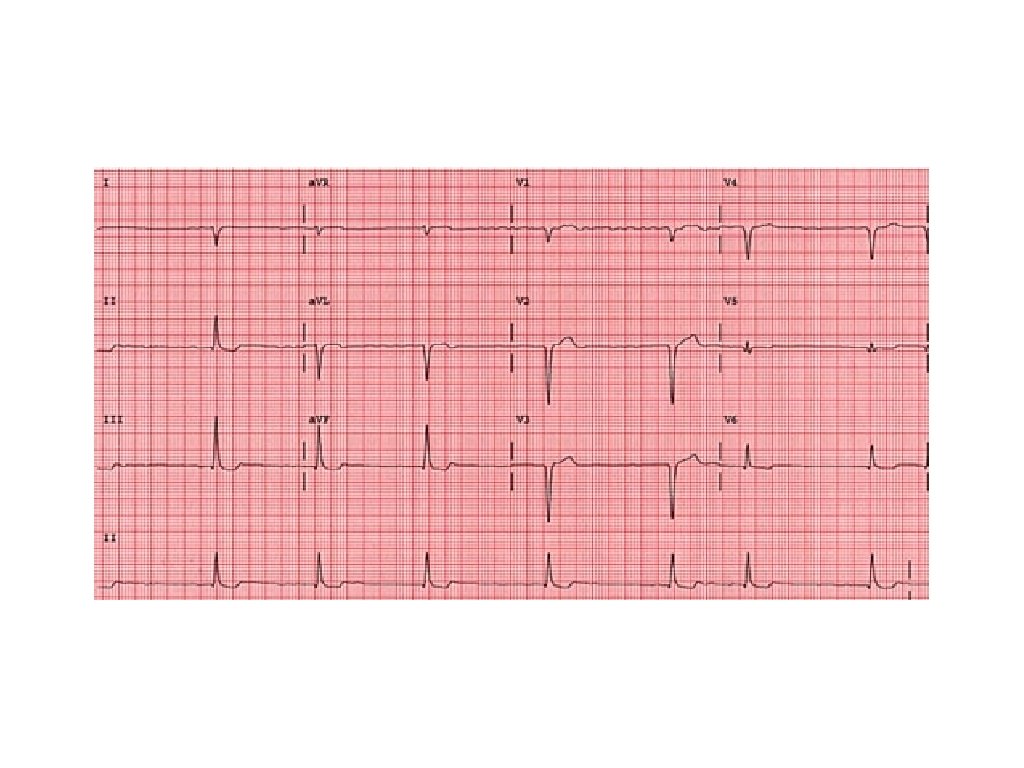
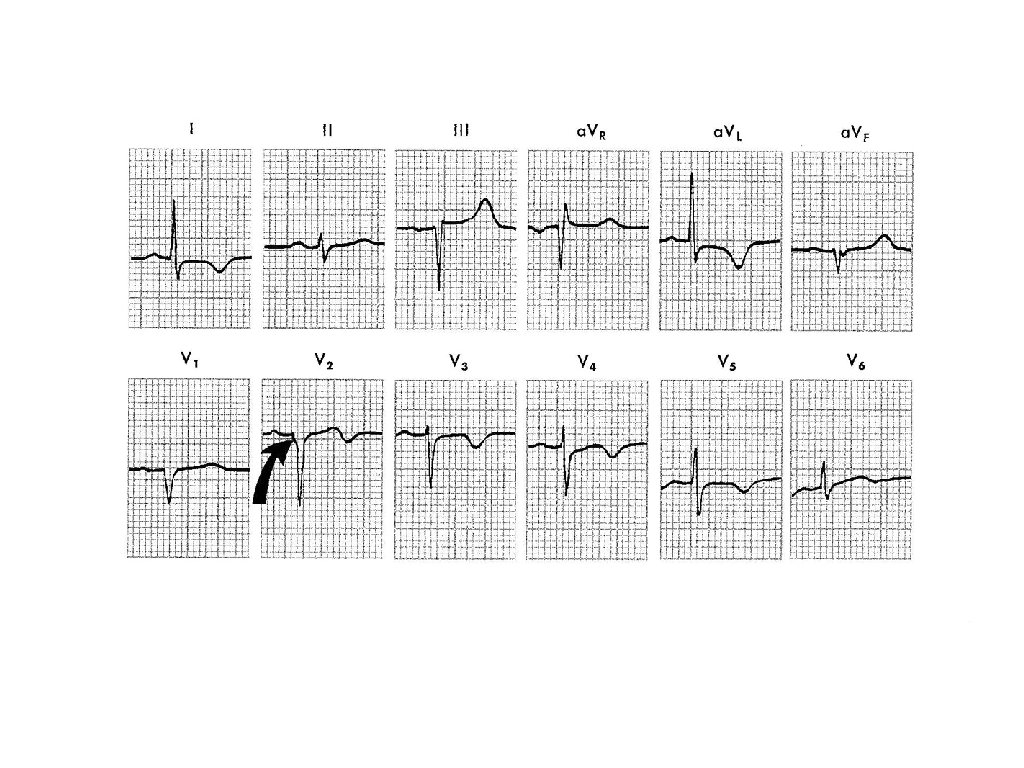
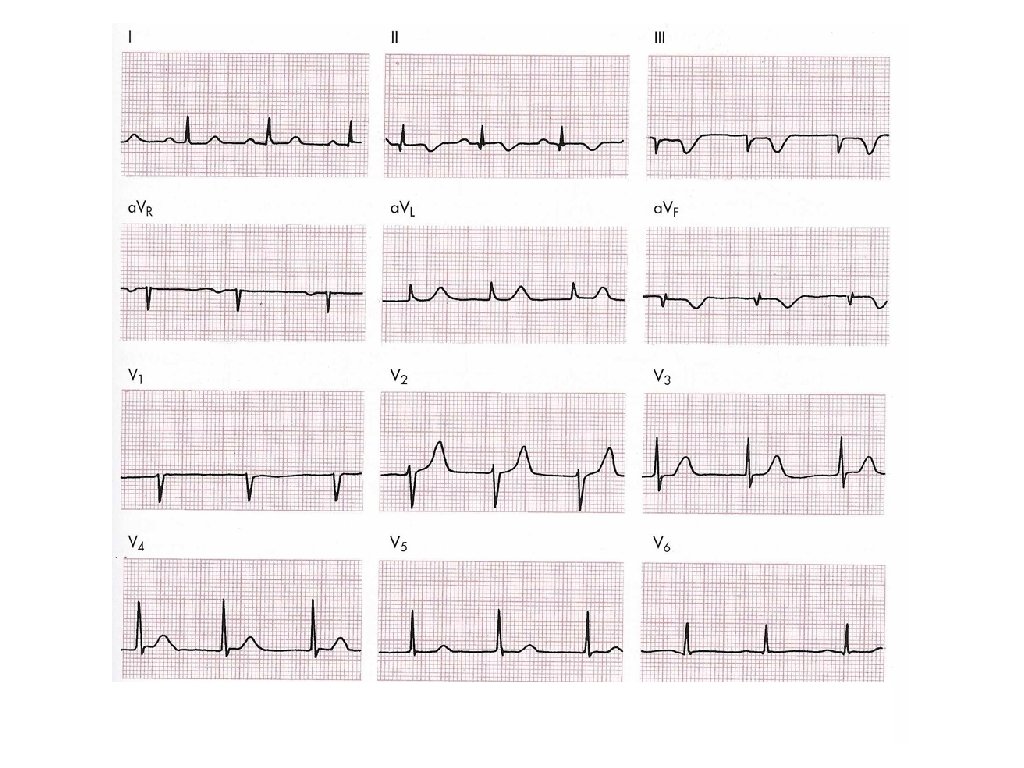
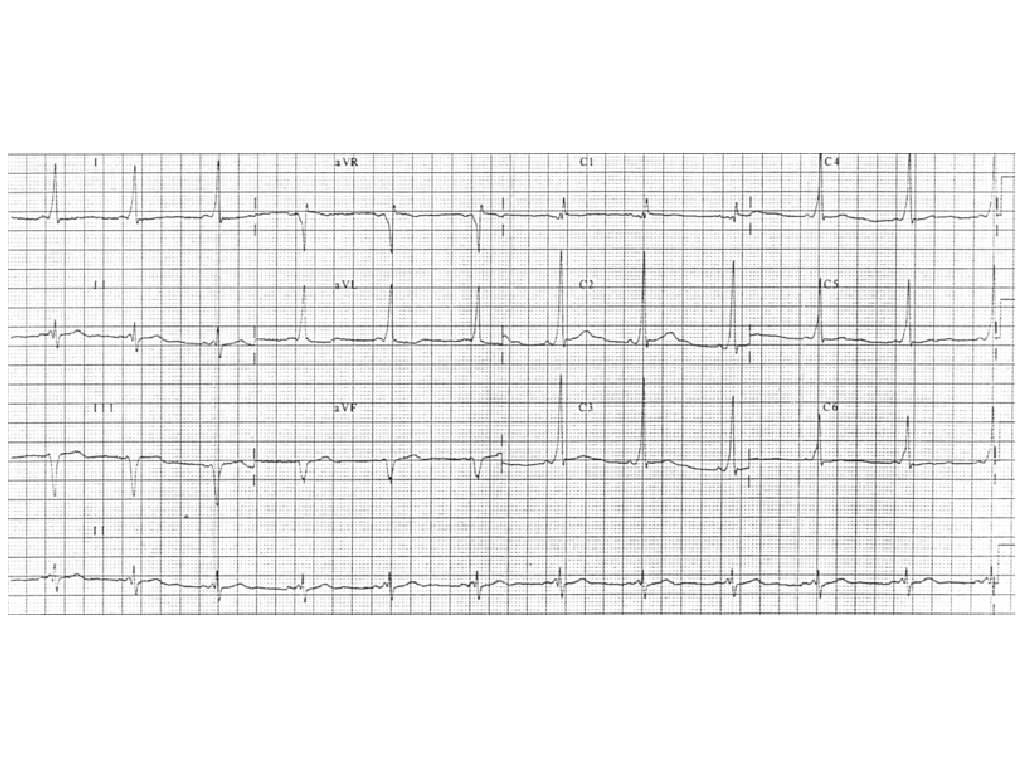
Left Ventricular Hypertrophy • If S wave in V or V 2+ R wave in V 5 or V 6 ≥ 35 mm (not specific indicator). 1 • R wave > 11 (or 13) mm in a. V • • • ST segment changes Left axis deviation Left atrial abnormality L or I
Mean QRS Axis
Normal versus Deviation
R Wave Progression
Transition Zone
Abnormal Q Waves
Normal Q Waves septal Q waves w/ horz. axis large Q waves QS waves septal Q waves w/ vert. axis septal Q waves w/ horz. axis QS waves septal Q waves w/ vert. axis septal Q waves
Abnormal Q Waves • Abnormal • Greater than 0. 04 sec • - or • 25% of the R wave amplitude • One-third or greater the height of the entire QRS complex • • Normal variant for Q waves to be in a. VF, III and a. VL Normal for QS waves to be in V 1 and V 2
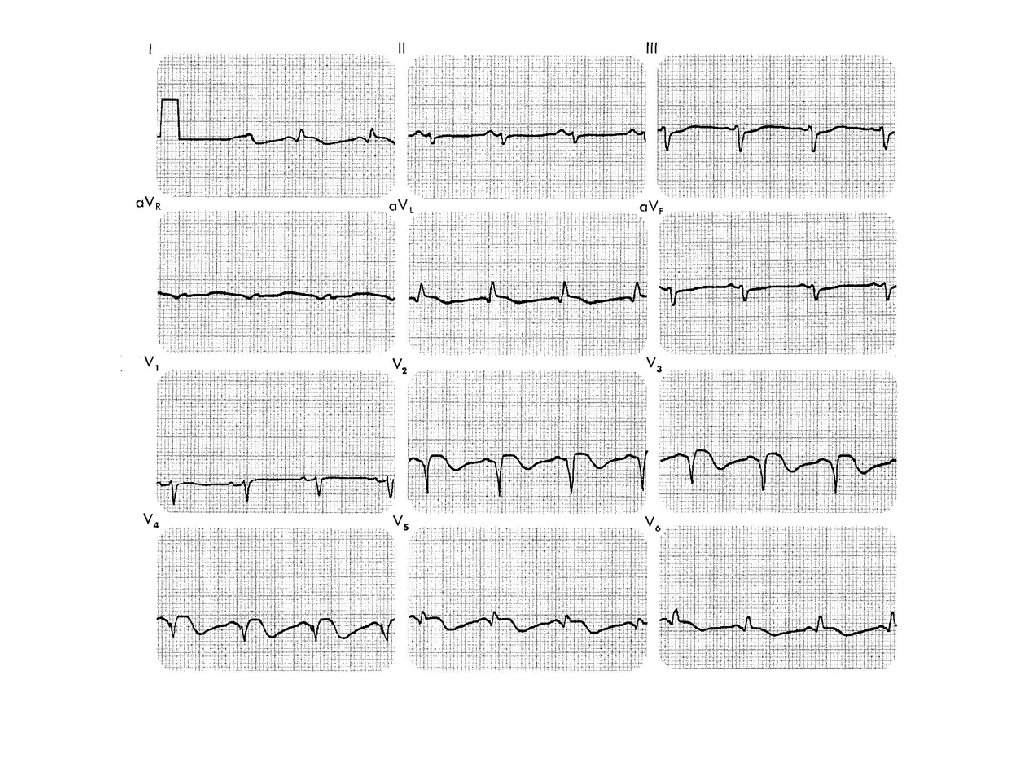
Transmural Ischemia and Infarction • ST segment elevation & Tall T waves • T wave inversion • Abnormal Q waves
ST Segments
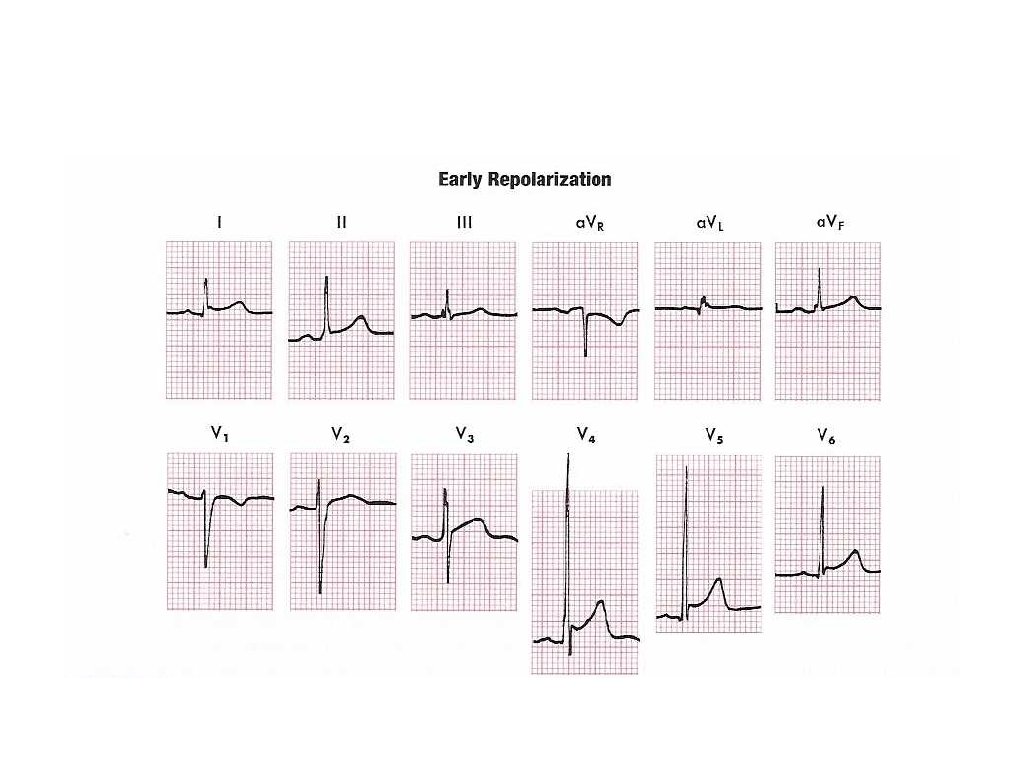
• • ECG Waves J point: • • end of QRS wave beginning of ST segment • • • beginning of ventricular repolarization normally isoelectric (flat) changes, elevation or depression, may indicate pathological condition
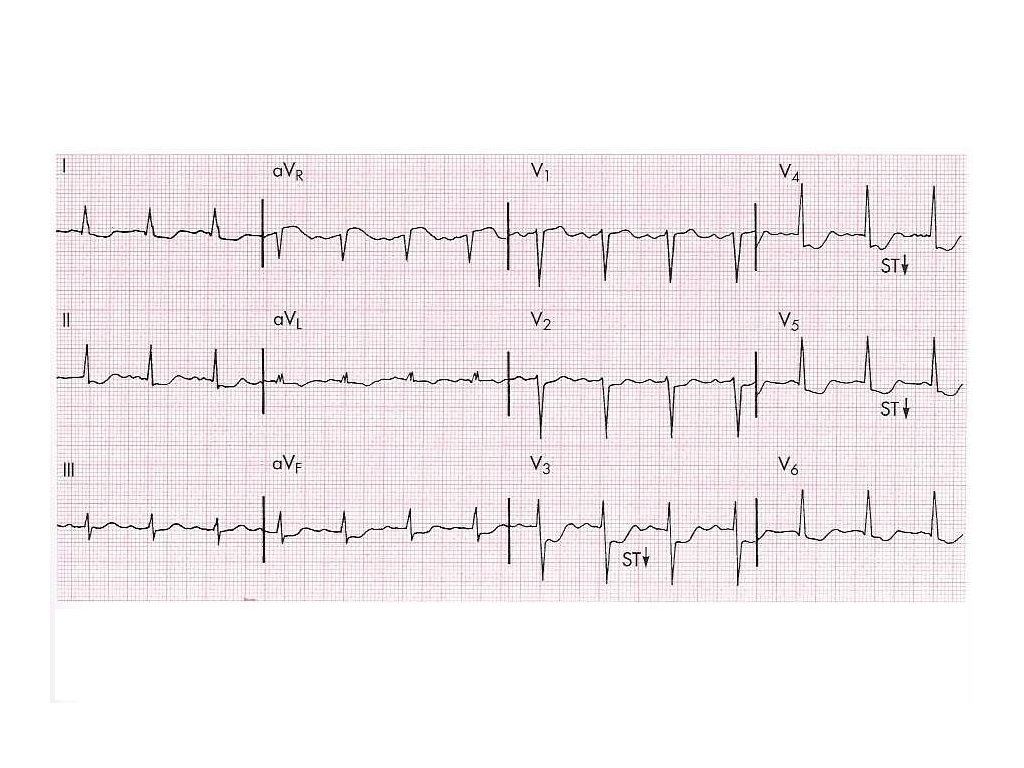
Subendocardial Ischemia • ST segment depression criteria • 1 mm or more • horizontal or downward • lasts 0. 08 seconds • depression of only the J point with rapid upward sloping are considered normal.
Subendocardial Ischemia • Inner layer • St Segment depression • Anterior leads (I, a. V and V 1 -V 6) • Inferior leads (II, III, and a. V ) • May see ST segment elevation in a. V L F R
T Waves
ECG Waves • T wave • normally upright in lead II, and V 3 -V 6 • negative in a. V and maybe III R
U Waves
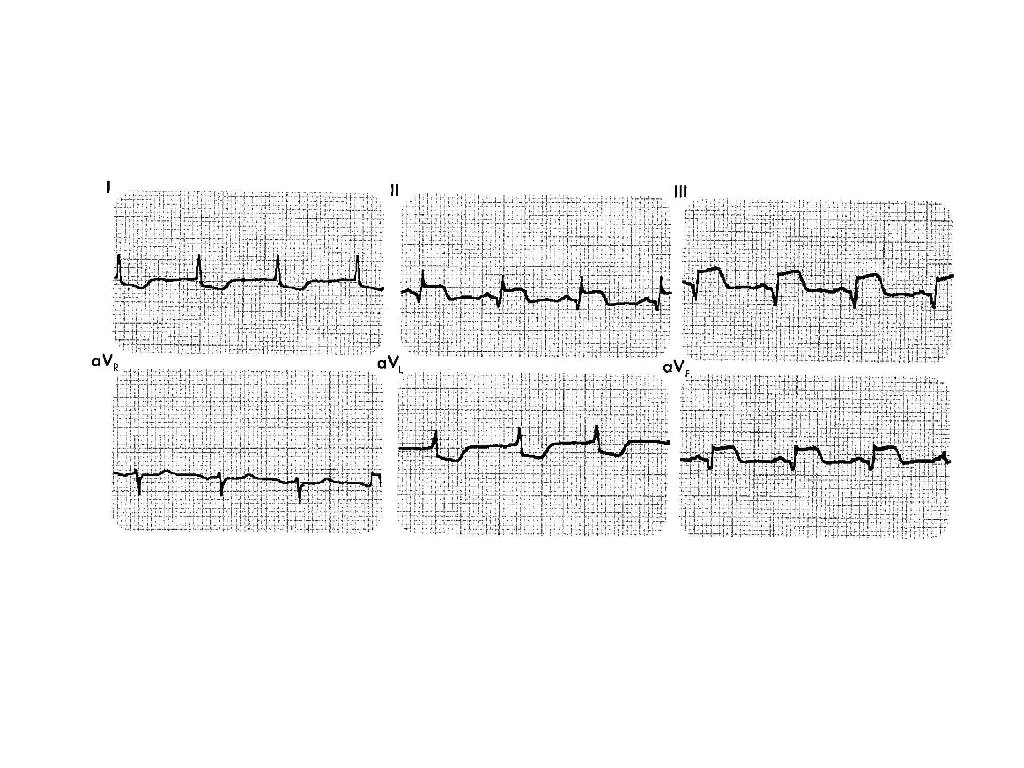
Axis deviation ? ?
Axis deviation ?
Axis deviation ?
Web Sites • ASSIGNMENT. http: //www. fammed. wisc. edu/medstude nt/pcc/ecg. html • • http: //library. med. utah. edu/kw/ecg_outline/Lesson 2/inde x. html http: //www. madsci. com/manu/indexekg. htm