How to Easily Create 1 2 3 INFOGRAPHIC


- Slides: 24
How to Easily Create 1 2 3 INFOGRAPHIC S in Power. Point No designer or design software required! With step-bystep instructions & notes along th e way. 1 2 3
TABLE OF CONTENTS ABOUT THE TEMPLATES ……………… 3 2 QUICK POWERPOINT TIPS……………. 4 TEMPLATE 1: Step-by-Step……………… 5 TEMPLATE 2: Informational……………. . 9 TEMPLATE 3: Data-Based. ……………… 14 CONNECTING THE SLIDES……………… 19 CONCLUSION & ADDITIONAL RESOURCES……. 23
ABOUT THE TEMPLATES Infographics are becoming a popular tool that marketers use to capture the attention of their target audiences. You’ve seen them shared on blogs and social media sites, and their visual appeal is indisputable. They break down information in digestible chunks and provide context around specific themes, thus helping readers understand key concepts faster. So you want to create your own infographic, don’t you? These three templates will give you a solid foundation of how to achieve that without any sophisticated software tool. Start creating graphics like a design wiz! NOTE: While the infographics are spread out over various slides, the last slide in this presentation shows exactly how you can piece the slides together with a free online tool.
2 QUICK TIPS FOR DESIGNING IN POWERPOINT Right clicking on any image, textbox, or shape will open up various options for you to change the appearance of the respective object— whether that be shading, colors, fills, outline, or styles. Be open to playing around seeing what you discover. When inserting images for your graphic, you might find yourself irked when the images have white backgrounds while your infographic does not. Either give the image a border to make it fit, or use the transparent tool in your toolbar. Simply click “Transparent color, ” and then click the background of your image.
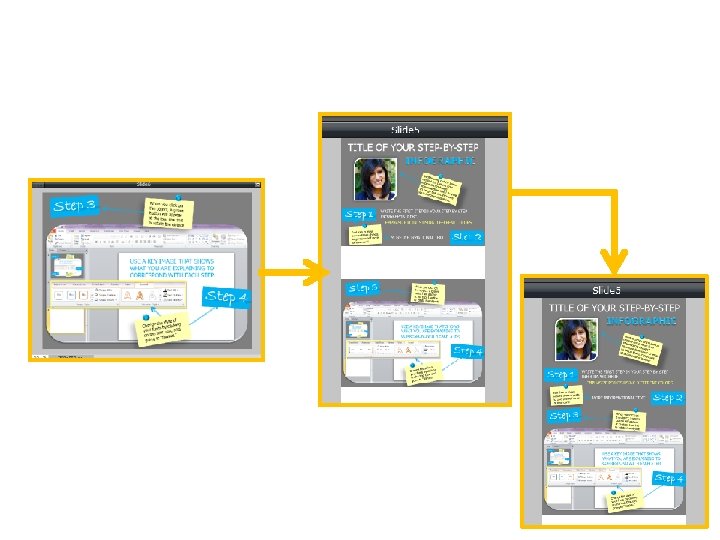
TEMPLATE 1 Step-by-Step Infographic Template Your content should benefit your audience – that’s a basic inbound marketing principle. But instead of using your normal method of teaching, why not try visualizing the process in a step-bystep infographic? This will help attract more people to your site and tell a story in a creative way.
TITLE OF YOUR STEP-BY-STEP INFOGRAPHIC Wan t who to pimp o c infor reated th ut the pe m r i Show ation to s conten son t from d show case the esign? m he r enco an imag e tha e! Or mpa s t grap hic is ses wha t the abou t. Step 1 Feel free to move s around these object re to give yourself mo or less room. WRITE THE FIRST STEP IN YOUR STEP-BY-STEP INFOGRAPHIC HERE. EMPHASIZE POINTS USING DIFFERENT COLORS MORE INFORMATIONAL TEXT Step 2
Step 3 When you click on the object, a gre en button will app ear at the top. Use this to rotate the ob ject. USE A KEY IMAGE THAT SHOWS WHAT YOU ARE EXPLAINING TO CORRESPOND WITH EACH STEP. Step 4 le of y t s e h et Chang s by clicking nt your fo xt box, and te on the “format. ” o going t
BE SURE YOUR LAST STEP IN THIS STEP-BY-STEP GUIDE FEELS CONCLUSIVE. SOURCES: Hub. Spot, Powerpoint Step 5 Feel free to ad d more steps by copying and pasting the “ste p” object. Attrib u sour te your c you es when u imag se quote s es a nd d , ata. Love our infographic template? Be sure to grab our free template for creating stellar marketing ebooks too! http: //bitly. com/Template. MKTGebook Consider a call including. -to-action this Replace h image wit logo. your own
TEMPLATE 2 Informational Infographic Template Over time, you’ve likely accumulated a lot of information. It might be expertise on a certain subject or simply a blog post that performed well for your company. Try transforming that information into a visual form and bring it to life once more. You’ll be surprised at how receptive people are to infographics.
TITLE OF Highlight the k ey points of your story with imag es in place of thes e images. SECTION 1 Introduce your topic, reveal what you will be showing, and explain why what you’re illustrating is important. Click on the wo rd “infographic” a nd then use the purple diamon d to adjust the shap e’s curve.
SECTION 2 Explain this point in a few sentences. An infographic doesn’t necessarily mean you aren’t allowed to use words. Here’s Hub. Spotter Karen Rubin showing the world that she’s been Hub. Spotted. We love our customers so much, we have them crowd surf! Extend this infographic by duplicating the Power. Point sli des & adding more sections. Unicorns love Hub. Spot too. Use different shapes to paste info/images into to improve the wa y you tell a story.
SECTION 3 Explain this section in a few sentences concisely and clearly. nge a h c can You lor of any o e the c you past e imag wer. Point o into P the r s. unde t” option a “Form ay, you w age m i That e re th ensu d goes in you f with your along colors. brand You can simply copy and paste simple images (found through creative commons or i. Stock) and use them to relay a point in an aesthetic manner.
SECTION 4 Nothing wrong with simply having a block of text to explain a particular section! You can always add images around it if you please. Just be sure to have some form of a conclusion. Love our infographic template? Be sure to grab our free social media publishing calendar! http: //bitly. com/SMPub. Template Pote n inclu tially d CTA e a mini. this Replace h image wit logo. your own
TEMPLATE 3 Data-Packed Infographic Template Ah yes, numbers. Data is immensely important in not only quantitative decisions, but in emphasizing the importance (or irrelevance) of certain practices and/or behaviors. But sometimes it’s hard to present and message those statistics. Try putting all that data into an infographic and truly illustrate the power behind those numbers.
TITLE OF INFOGRAPHIC SUBTITLE OF THIS INFOGRAPHIC ic stat or s a b a e Us art the fact to st ic and infograph iewers. engage v Have an introduction to explain what data you are about to share, and how or why you collected it. 89% of marketers are maintaining or increasing their inbound budgets.
TITLE OF THE GRAPH Describe the graph and what it shows. 6 Change the c olors of your graph by dou ble clicking on each line. You may need to reins ert this graph in order to ch ange its data in excel. 5 4 Series 1 3 Series 2 Series 3 2 Be su re sourc to add e attribu tio all dat ns for a you use. 1 0 Category 1 Category 2 Category 3 Category 4
USE SHAPES TO ILLUSTRATE A STORY 41% of B 2 B companies using Facebook have acquired a customer from it. ange the h c n a c You storyis h t r o f s shape epending d d o h t e telling m ou could Y. a t a d on the birds if r e t it w T use. g Twitter in s s u c is d Don’t be afraid to add written context to go along with any graphs or Smart. Art you include in your infographic. 62% of B 2 C companies using Facebook have acquired a customer from it. 51% of Facebook fans are more likely to buy the brands they ‘like. ’
TITLE OF THE GRAPH Describe the graph and what it shows. 6 Understand that for this template, the graphs you use will be contingent upon the data you are sharing. Feel free to add or remove as fit for you. 5 4 Call out a specific data point where relevant. 3 2 1 0 Category 1 Category 2 Category 3 Category 4 SOURCES: Hub. Spot, Powerpoint Love our infographic template? Be sure to grab our free template for calculating your leads and traffic goals! http: //bitly. com/Traffic. Leads. Calc
CONNECTING THE SLIDES Save Slides as Images Once your infographic is ready, you’ll need to save the Power. Point slides as images. Simply go to File Save As and select PNG (Portable Network Graphics). This is critical as PNG is the ONLY file type that will give your infographics the high quality they need for publishing. Go to Free Online Tool Your slides will be saved in a separate folder. After you save your slides as PNG, go to your browser and navigate to http: //pixlr. com/editor/. Here, select the option to “Open Image from Computer. ” Find your saved folder from Step 1, and select the first slide (the very top of your infographic), and open.
Change the Zoom and Size Adjust your zoom in the bottom left-hand corner to 20%. Then in the top navigation bar, go to Image Canvas Size. Under canvas size, extend the Height to 4000. This will allow your canvas to be large enough to paste in each slide from your Power. Point to build the infographic. You can increase this Height number when needed. Copy and Paste Now all you have to do is open the rest of your slides saved as PNG’s by going to File Open. Use Control-A to select the entire slide, then hit Edit Copy. Then go to your image with the increased Height, and paste! You can move around the image to ensure all the pieces are lining up correctly.
Repeat Continue to copy and paste your slides until your entire infographic is pieced together! Once you’re done, you can use the crop tool in the toolbar to crop the infographic and eliminate any extra white space added by adjusting the canvas height in step two. Save as PNG When you’re done, you once again need to ensure you save the file in PNG format to ensure optimal visual quality. And voila! You have an infographic. CAUTION: Once you exit your tab on this free online tool, all your content will be lost. Your browser does not save any content, so be sure to save everything as you go.
CONCLUSION Infographics perfectly fit into your inbound marketing strategy. These appealing visuals attract more internet browsers than regular content, helping expand the visibility of your brand by providing a valuable piece of content. Infographics can spread across the Internet fast, allowing more and more people to see the benefit your company can provide, or at least warm them up to your brand. And now that you’ve learned how to create and piece together infographics in Power. Point, it’s time to share them! Use these creative pieces of content as awesome social collateral. Pin them, tweet them, share them. You should also draft a blog post about the infographic. Have a brief introduction that provides further detail about the infographic, and then paste it into the post for viewers to peruse through. Voila! Finished
WANT TO MEASURE THE ROI OF ALL YOUR CONTENT? Try Hub. Spot’s marketing software for free. http: //bitly. com/Infograph. Free. Trial