How to detect and avoid memory and resources


- Slides: 37

How to detect and avoid memory and resources leaks in. NET applications Fabrice MARGUERIE Independent. NET expert Microsoft MVP meta. Sapiens / Tuneo

Who am I? Independent. NET expert Microsoft MVP since 2004 Book author: LINQ in Action Entrepreneur § meta. Sapiens § Tuneo § Proagora. com § Sharp. Toolbox. com § Java. Toolbox. com 2 meta. Sapiens

Agenda Basics Detecting and fixing Prevention is better than cure 3

Agenda Basics Detecting and fixing Prevention is better than cure 4

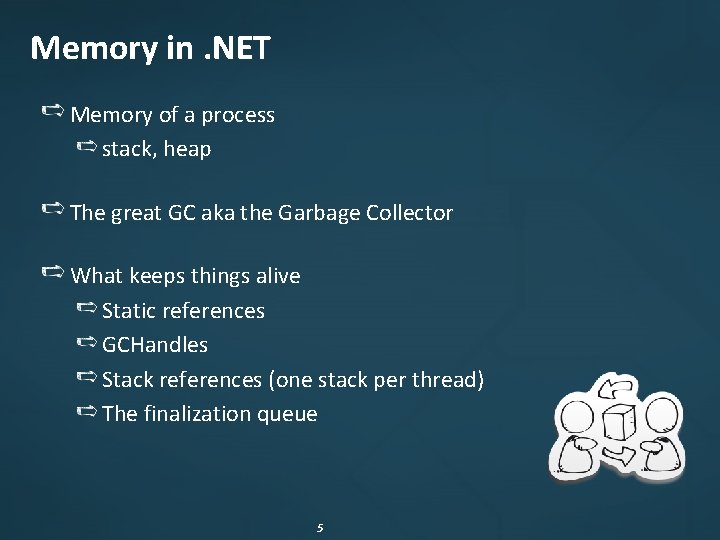
Memory in. NET Memory of a process stack, heap The great GC aka the Garbage Collector What keeps things alive Static references GCHandles Stack references (one stack per thread) The finalization queue 5

Memory leaks Definition In computer science, a memory leak is a particular type of unintentional memory consumption by a computer program where the program fails to release memory that it no longer needs. The most common causes of this condition are: carelessness bugs lack of knowledge 6

Memory leaks Languages that provide automatic memory management, like Java, C#, VB. NET or LISP, are not immune to memory leaks. The garbage collector recovers only memory that has become unreachable. It does not free memory that is still reachable. In. NET, this means that objects reachable by at least one reference won't be released by the garbage collector. 7

Memory leaks A drop of water is not a big issue. But drop by drop, a leak can become a major problem. In computing, even a little leak can bring down the system if it occurs many times. 8

Agenda Basics Detecting and fixing Prevention is better than cure 9

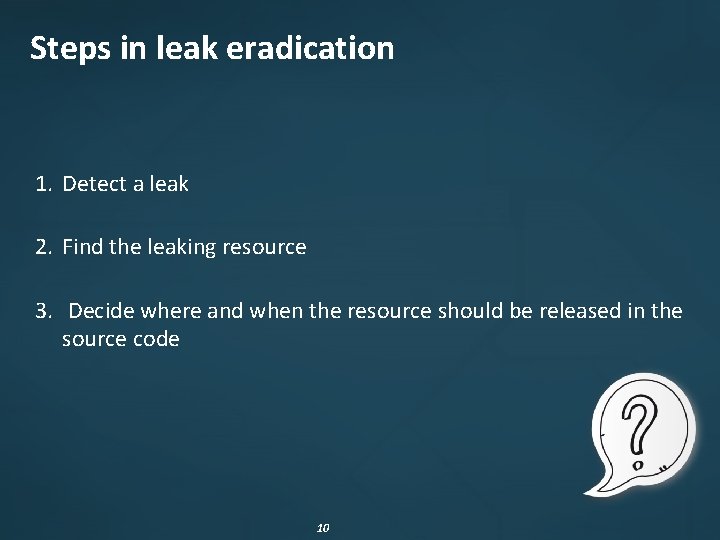
Steps in leak eradication 1. Detect a leak 2. Find the leaking resource 3. Decide where and when the resource should be released in the source code 10

Demo the wonderful Photo. Light application

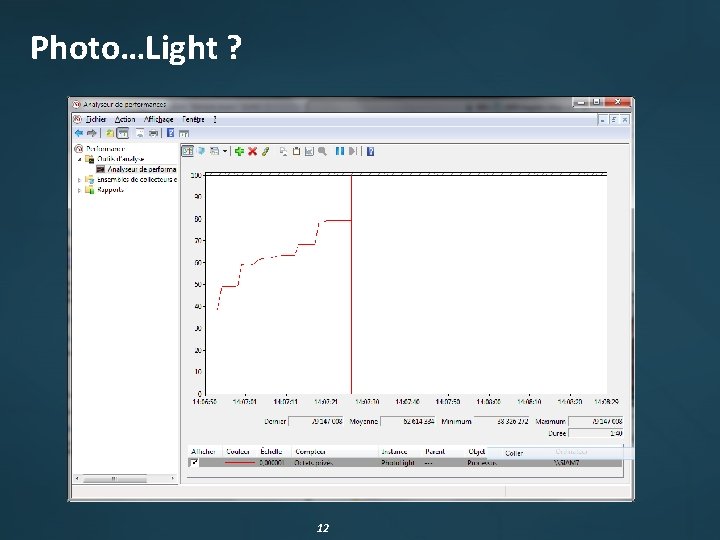
Photo…Light ? 12

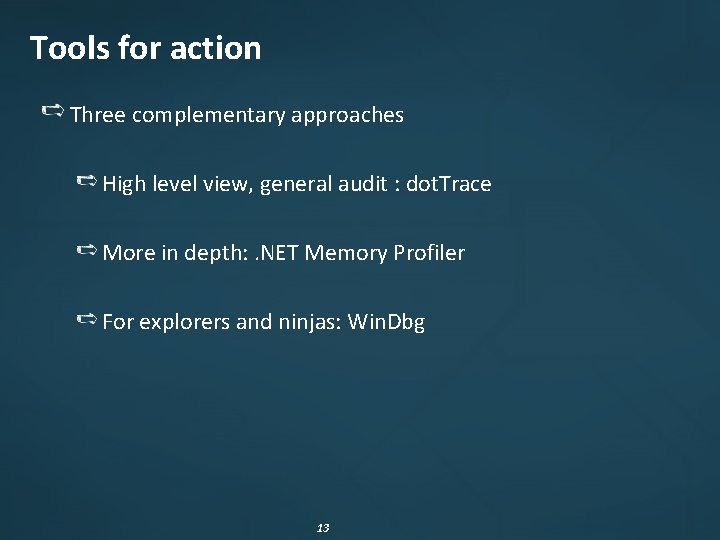
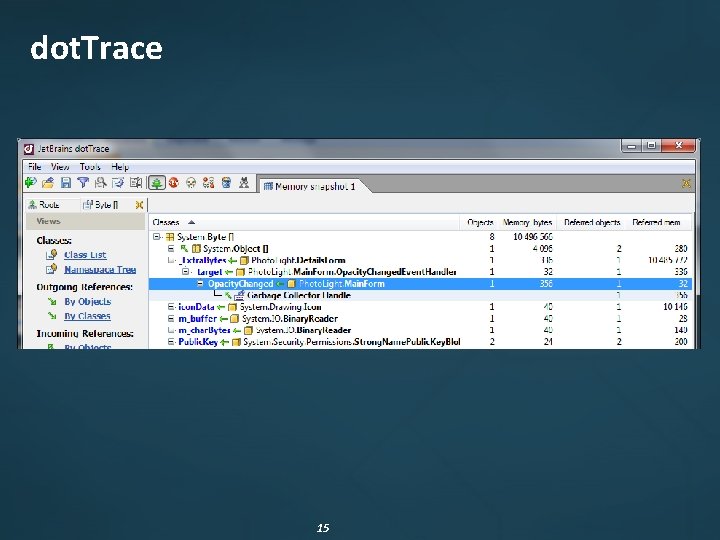
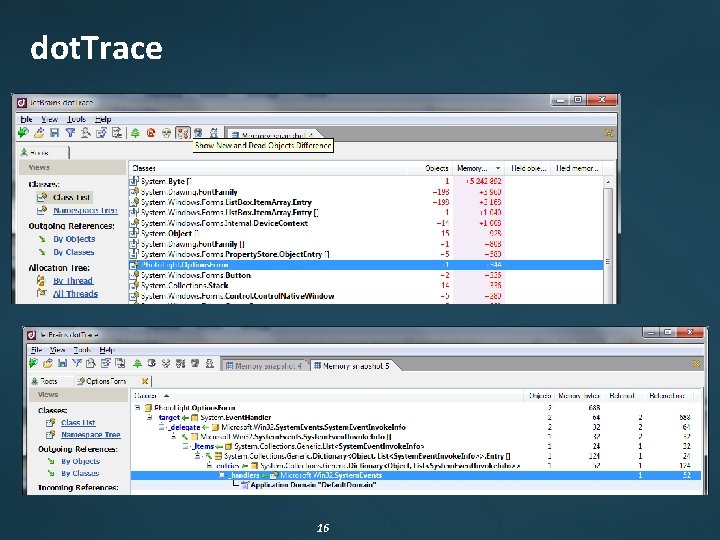
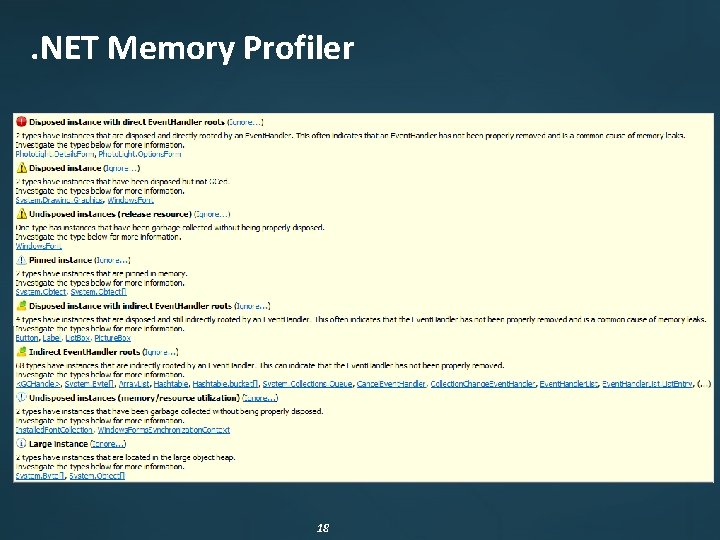
Tools for action Three complementary approaches High level view, general audit : dot. Trace More in depth: . NET Memory Profiler For explorers and ninjas: Win. Dbg 13

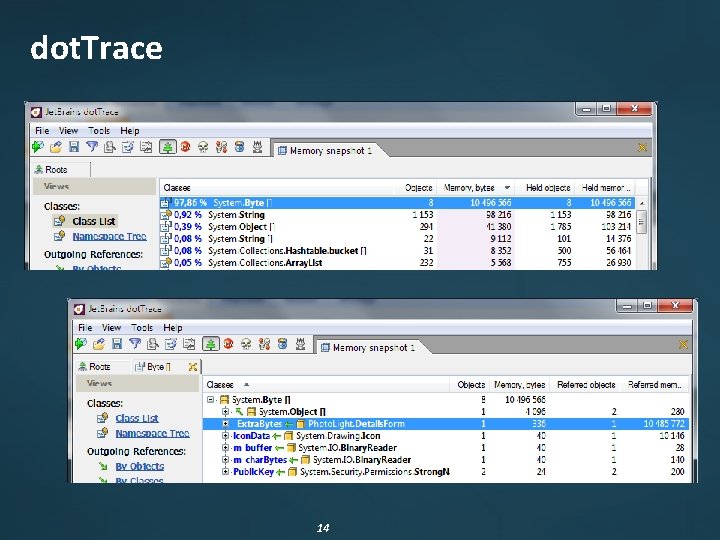
dot. Trace 14

dot. Trace 15

dot. Trace 16

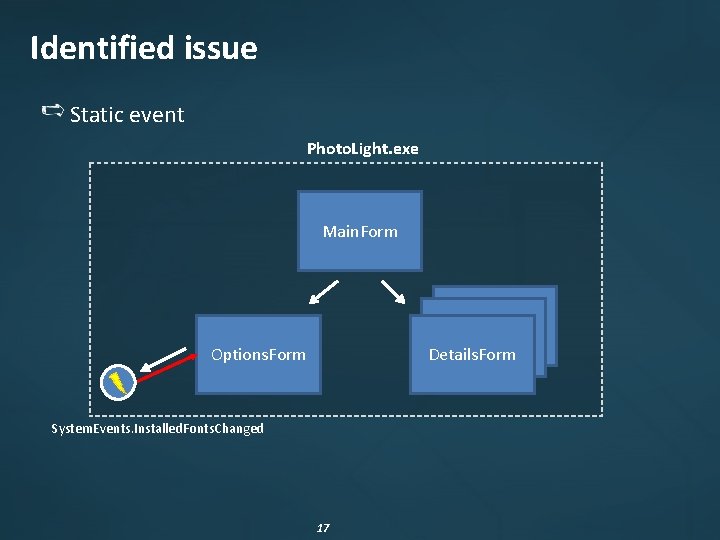
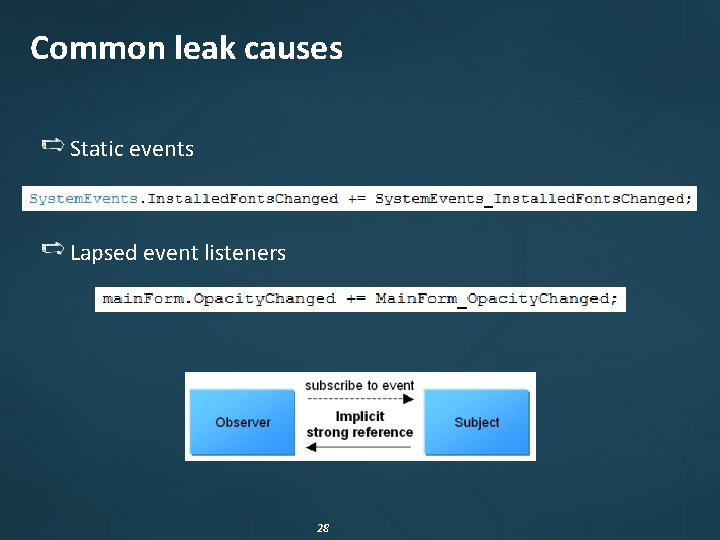
Identified issue Static event Photo. Light. exe Main. Form Options. Form Details. Form System. Events. Installed. Fonts. Changed 17

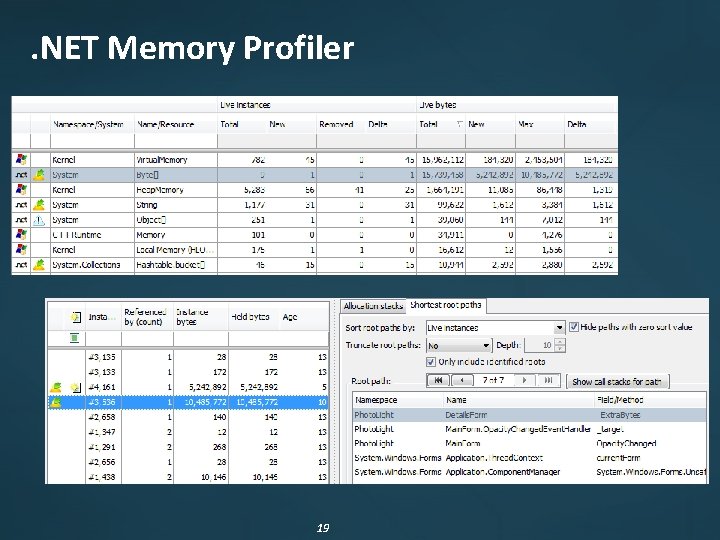
. NET Memory Profiler 18

. NET Memory Profiler 19

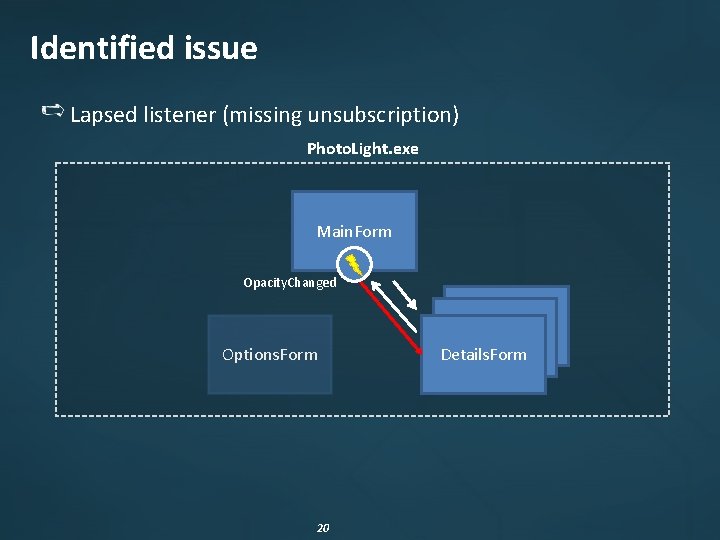
Identified issue Lapsed listener (missing unsubscription) Photo. Light. exe Main. Form Opacity. Changed Options. Form 20 Details. Form

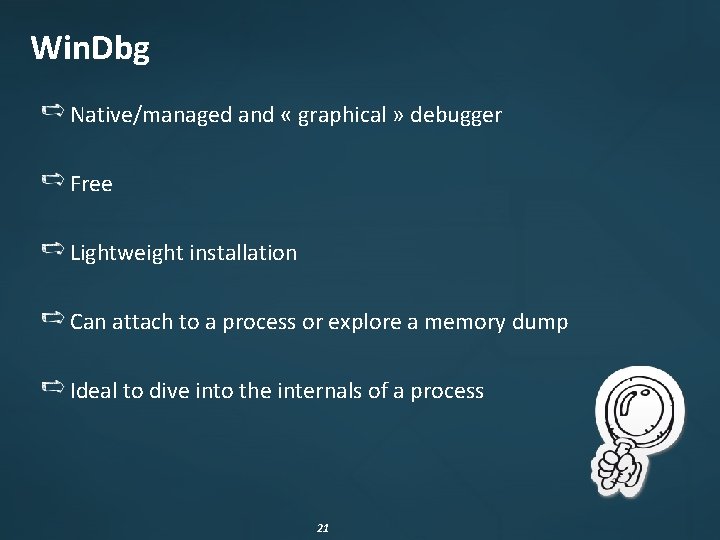
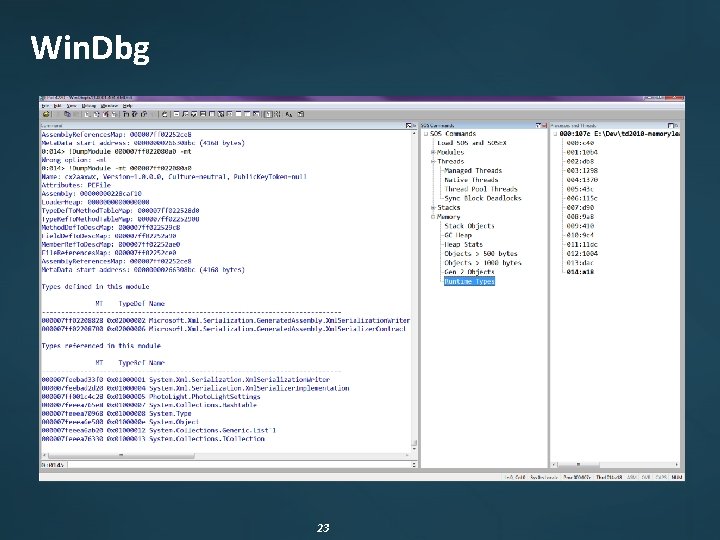
Win. Dbg Native/managed and « graphical » debugger Free Lightweight installation Can attach to a process or explore a memory dump Ideal to dive into the internals of a process 21

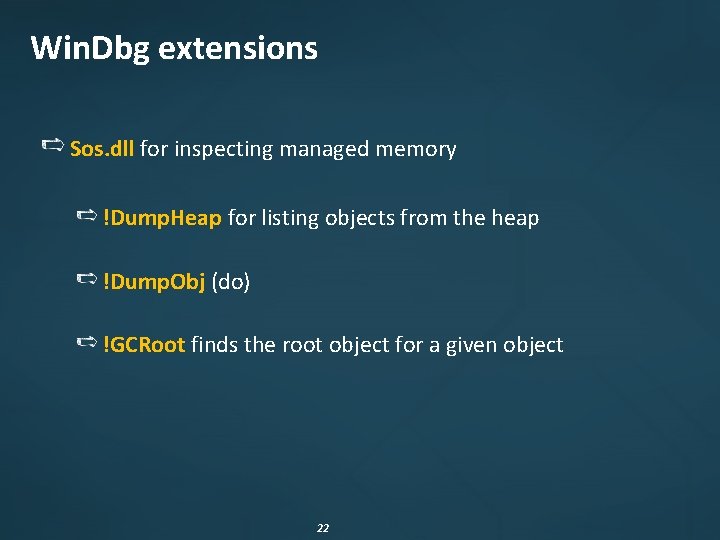
Win. Dbg extensions Sos. dll for inspecting managed memory !Dump. Heap for listing objects from the heap !Dump. Obj (do) !GCRoot finds the root object for a given object 22

Win. Dbg 23

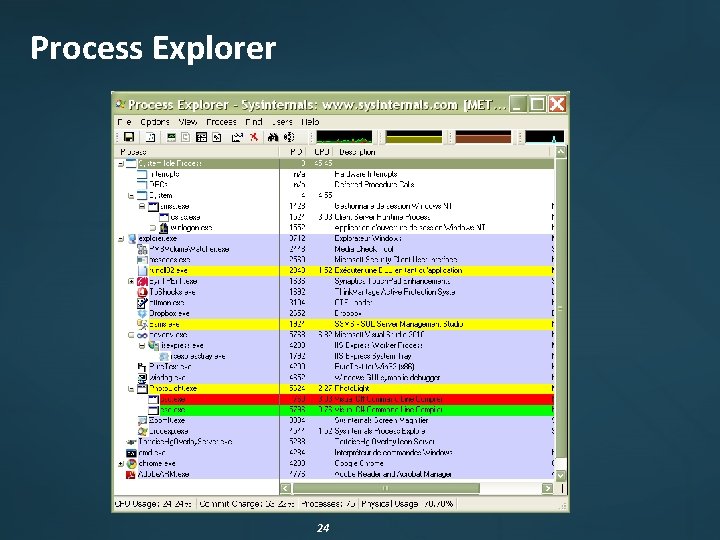
Process Explorer 24

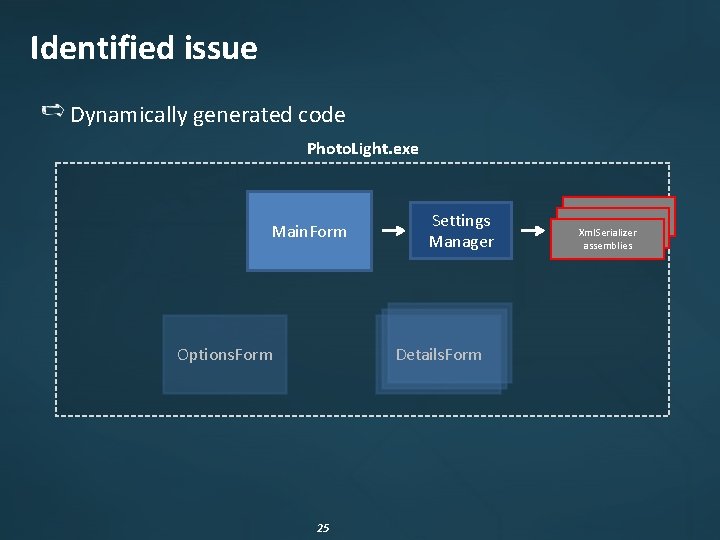
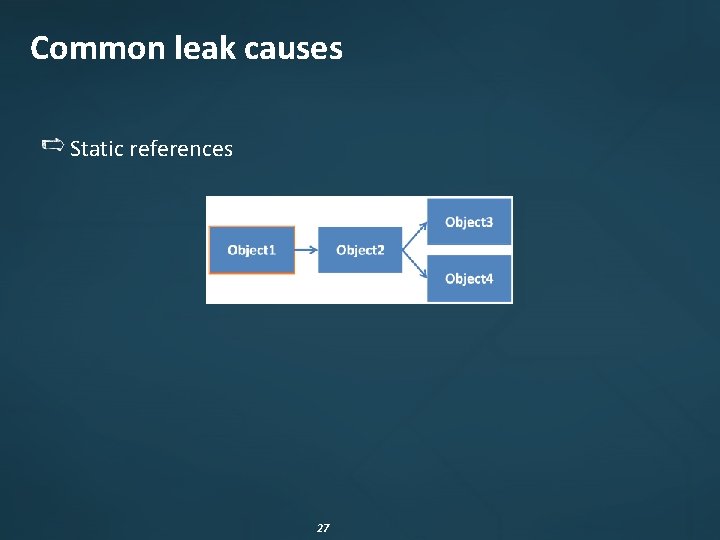
Identified issue Dynamically generated code Photo. Light. exe Main. Form Options. Form Settings Manager Details. Form 25 Xml. Serializer assemblies

Agenda Basics Detecting and fixing Prevention is better than cure 26

Common leak causes Static references 27

Common leak causes Static events Lapsed event listeners 28

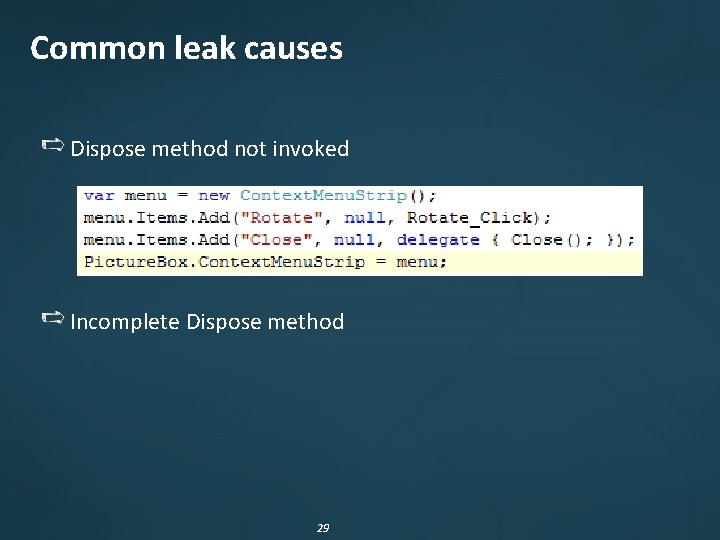
Common leak causes Dispose method not invoked Incomplete Dispose method 29

You’ll never be bored… On-the-fly code generation Technology-specific issues (Silverlight, WPF, composite applications, etc. ) 30

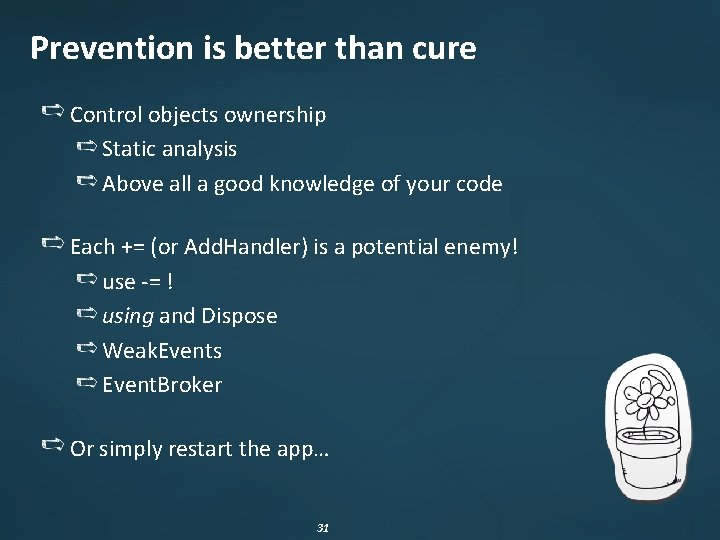
Prevention is better than cure Control objects ownership Static analysis Above all a good knowledge of your code Each += (or Add. Handler) is a potential enemy! use -= ! using and Dispose Weak. Events Event. Broker Or simply restart the app… 31

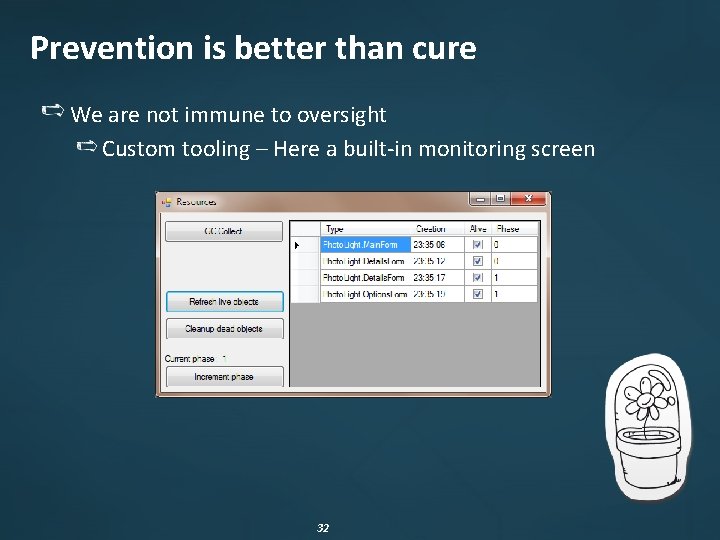
Prevention is better than cure We are not immune to oversight Custom tooling – Here a built-in monitoring screen 32

Tools dedicated to profiling in. NET dot. Trace, . NET Memory Profiler, ANTS Profiler, Your. Kit Profiler, Purify. Plus, Aqtime, CLR Profiler… http: //sharptoolbox. com/categories/profilers-debuggers Win. Dbg, SOS. dll, linqdbg http: //www. microsoft. com/whdc/devtools/debugging/ http: //code. google. com/p/linqdbg/ VMMap http: //sysinternals. com Bear, GDI Usage http: //thesz. diecru. eu/content/bear. php http: //msdn. microsoft. com/en-us/magazine/cc 301756. aspx 33

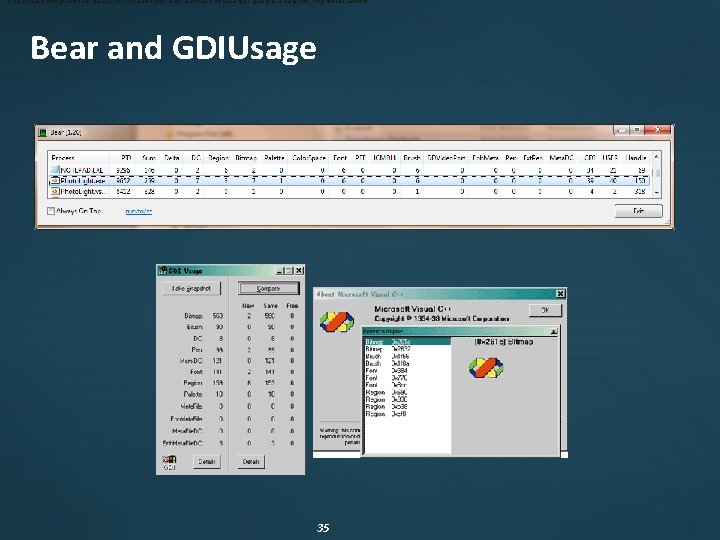
http: //marketingscience. co/2010/12/facebook-and-adobe-sitecatalyst-google-analytics-implementation/ Bear and GDIUsage 35

Resources Article How to detect and avoid memory and resources leaks in. NET applications http: //msdn. microsoft. com/en-us/library/ee 658248. aspx Book Advanced. NET Debugging Mario Hewardt, also author of Advanced Windows Debugging Book Debugging Microsoft. NET 2. 0 Applications John Robbins 36

Resources Tess Ferrandez’ blog, ASP. NET Escalation Engineer at Microsoft http: //blogs. msdn. com/tess/archive/tags/Memory+issues/default. aspx Detecting event handlers leaks with Win. Dbg http: //is. gd/79 Qlk (David Anson’s blog, MS) More links at the end of my article 37

Contacts Architecture and. NET Expertise fabrice@metasapiens. com http: //weblogs. asp. net/fmarguerie http: //meta. Sapiens. com 38