
How to Crack the BI User Adoption Code
How to Crack the BI User Adoption Code Kyle Mc. Nerney – Director Partner & Industry Solutions – kjm@targit. com Boston AXUG January 21, 2016
How to Ensure the Highest User Adoption Rates for your BI Project
Agenda • Quick BI Deployment FACTS • 4 Key Pillars of BI IMPLEMENTATION • Define YOUR TEAM • Develop • Get YOUR VISUALIZATIONS CORRECTLY EXECUTIVE BLESSING • Quantify/Track KEY MILESTONES • MY HONEST OPINION • Q&A
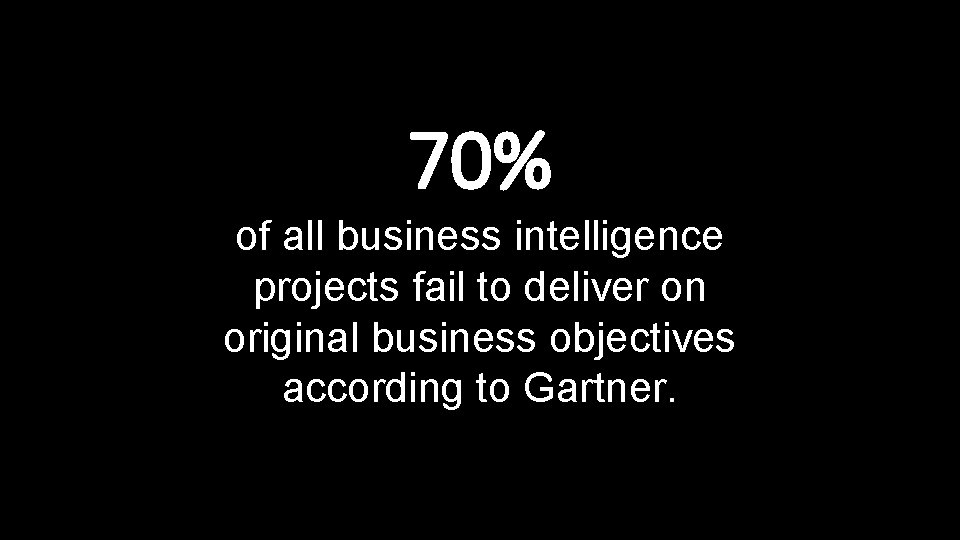
70% of all business intelligence projects fail to deliver on original business objectives according to Gartner.
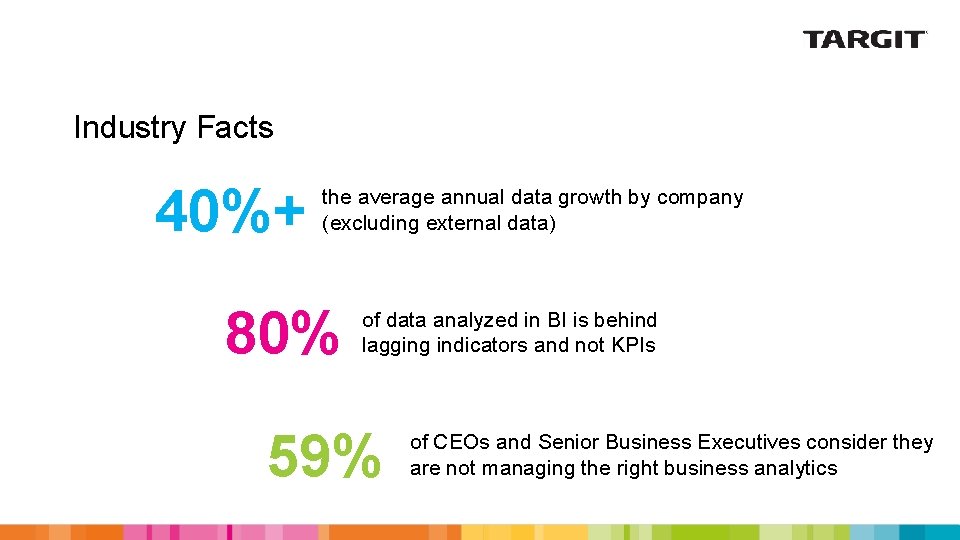
Industry Facts 40%+ the average annual data growth by company (excluding external data) 80% of data analyzed in BI is behind lagging indicators and not KPIs 59% of CEOs and Senior Business Executives consider they are not managing the right business analytics
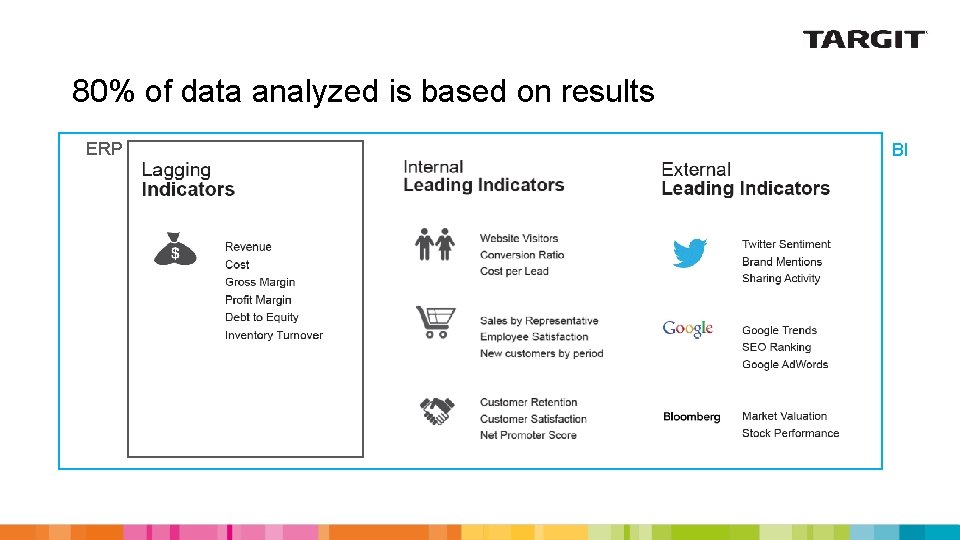
80% of data analyzed is based on results ERP BI
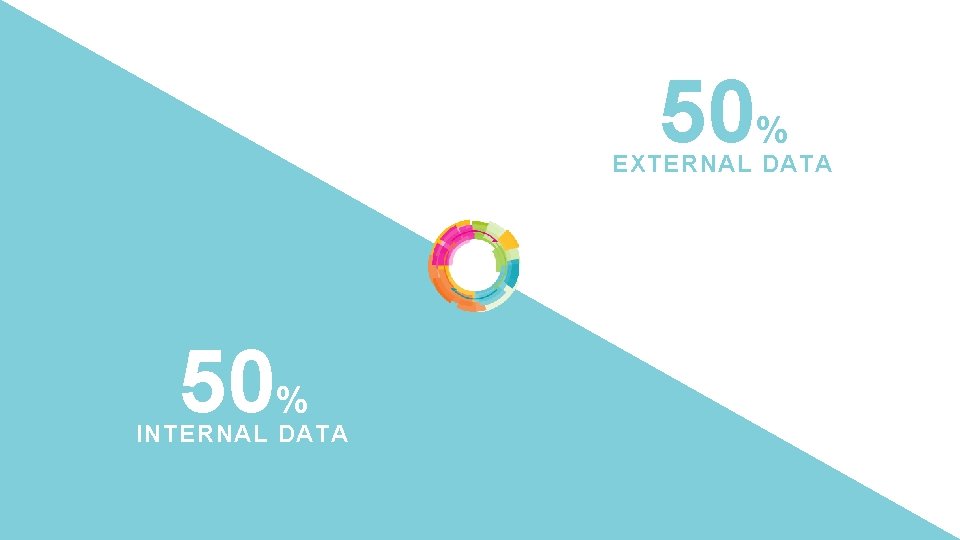
50% EXTERNAL DATA 50% INTERNAL DATA
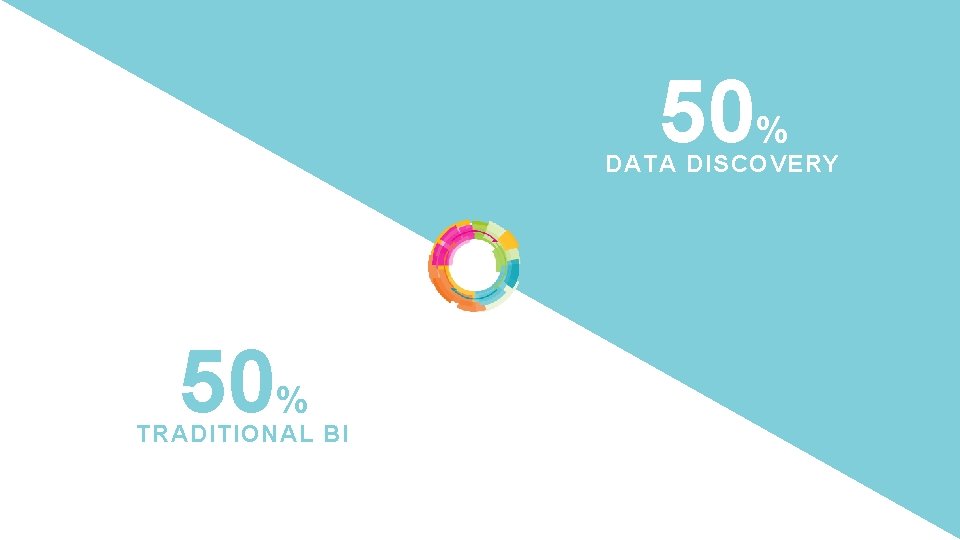
50% DATA DISCOVERY 50% TRADITIONAL BI
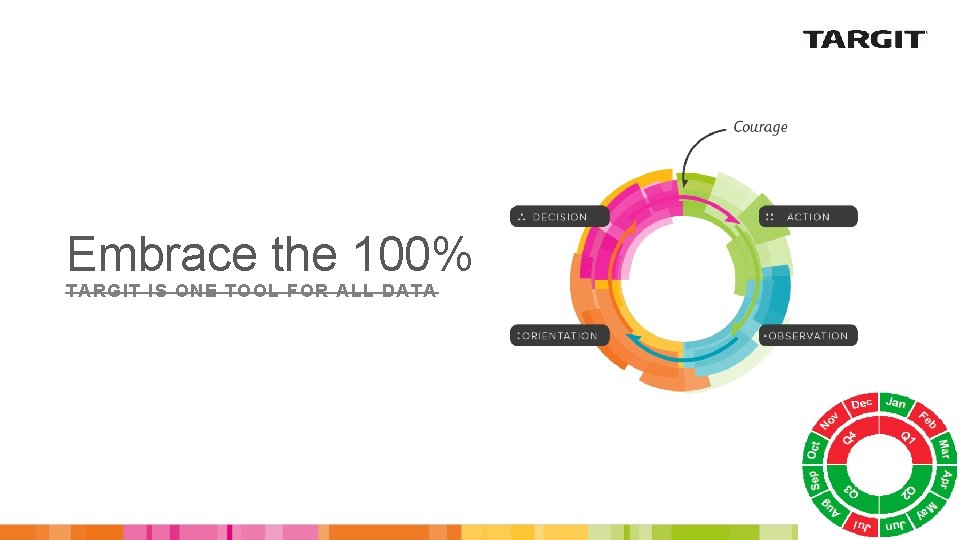
Embrace the 100% TARGIT IS ONE TOOL FOR ALL DATA
Reporting, Analytics, Dashboards for everyone Eliminating information silos
Get to know the BI User Personas
Analytics, Reporting, Dashboards from ALL data sources deployed on any device ü Embedded BI ü Mobile ü Web ü Desktop
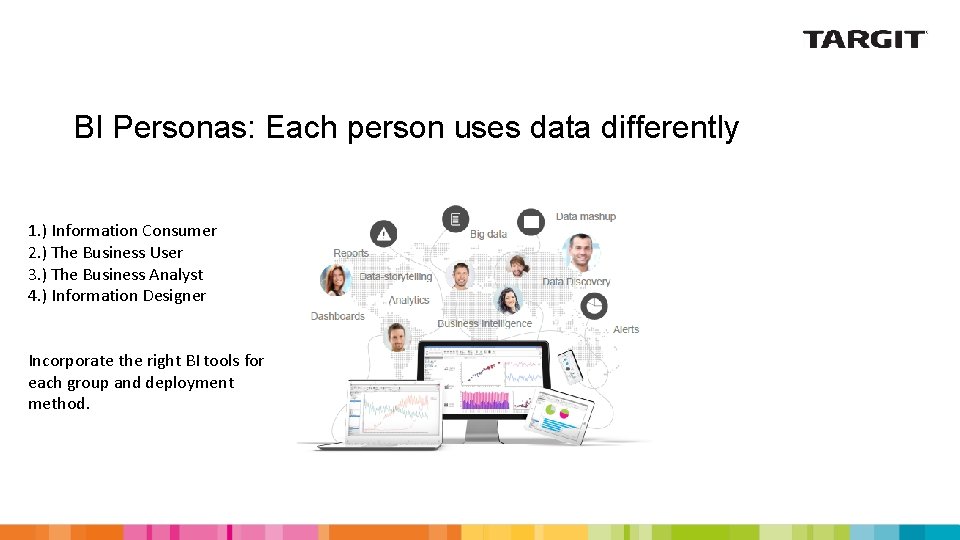
BI Personas: Each person uses data differently 1. ) Information Consumer 2. ) The Business User 3. ) The Business Analyst 4. ) Information Designer Incorporate the right BI tools for each group and deployment method.
1 The Information Consumer

Who they might be: Executives, board members, managers, sales employees, in-house production employees, suppliers, and partners
The typical Information Consumer receives business intelligence information in the form of reports, analyses, and dashboards that other members of the organization build for them.
2 The Business User

Who they might be: Vice president roles, COOs, CMOs, CFOs, directors, controllers, and sales managers

Through benchmarking and adjusting information within the analyses, Business Users spots opportunities to follow.
3 The Business Analyst

Who they might be: Business analysts, marketing analysts, business developers, and data scientists
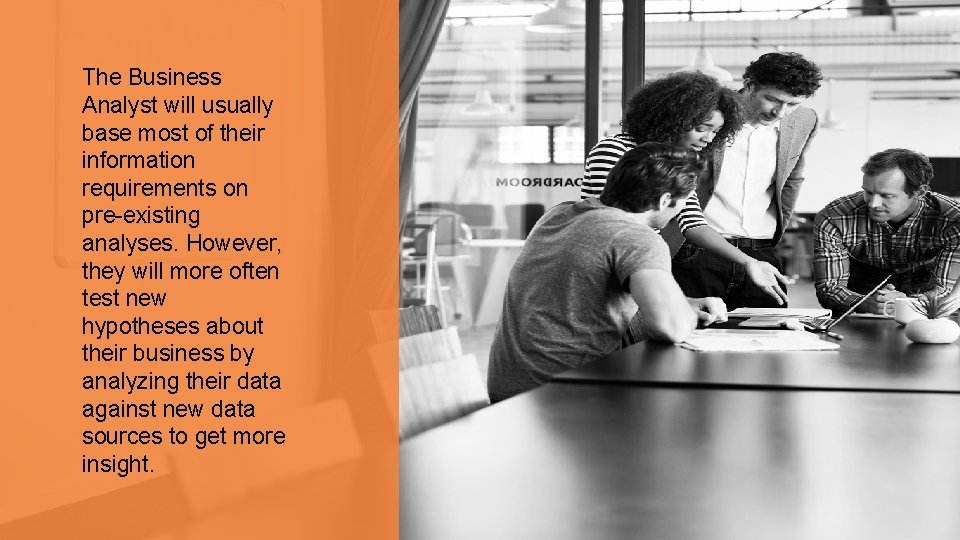
The Business Analyst will usually base most of their information requirements on pre-existing analyses. However, they will more often test new hypotheses about their business by analyzing their data against new data sources to get more insight.
4 The Information Designer

Who they might be: Information officers, BI managers, and IT
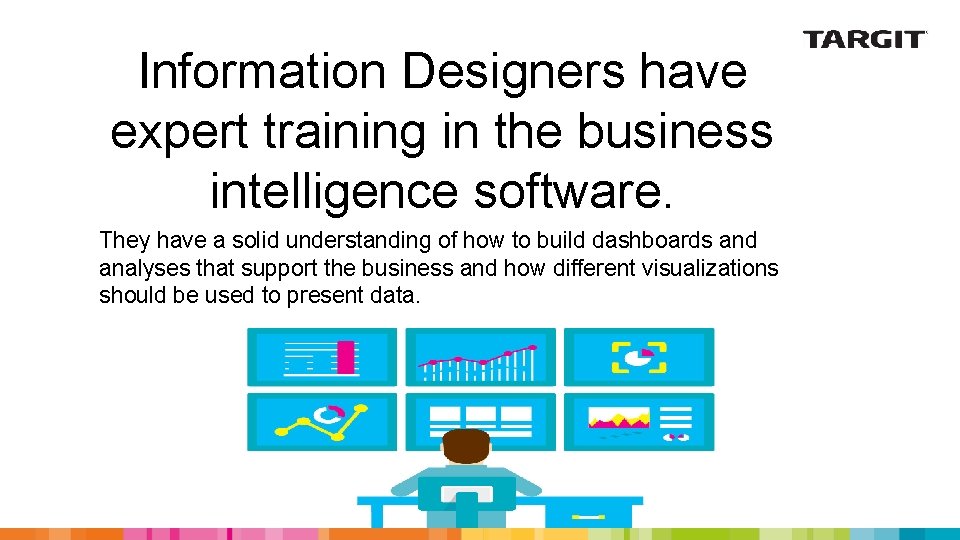
Information Designers have expert training in the business intelligence software. They have a solid understanding of how to build dashboards and analyses that support the business and how different visualizations should be used to present data.
Why BI & analytics matters All for one and one for all The solution must be flexible and adaptable User adoption is key for any IT project to succeed
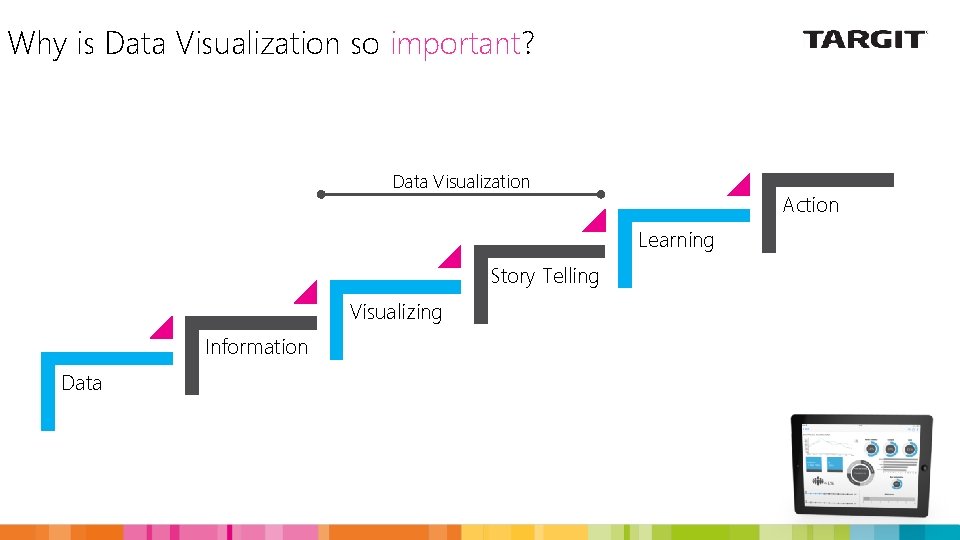
Why is Data Visualization so important? Data Visualization Action Learning Story Telling Visualizing Information Data

If you can’t explain it simply, you don’t understand it well enough. Albert Einstein @AXUG 28
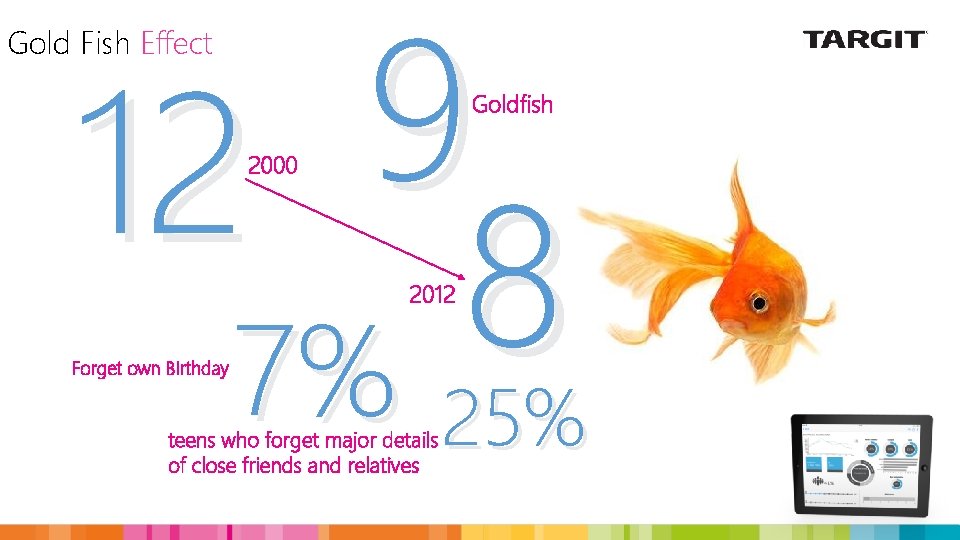
9 12 8 7% Gold Fish Effect Goldfish 2000 2012 Forget own Birthday teens who forget major details of close friends and relatives 25%

Quiz time!
Q 1. 1. Which product has the largest revenue? 2. Which salesperson has the largest revenue?

Revenue per Salesperson Revenue per Product Time!
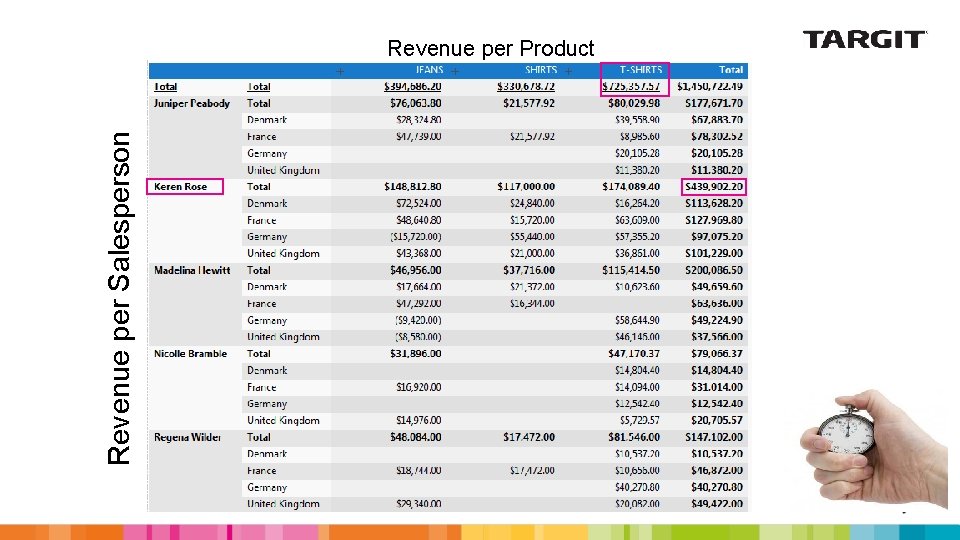
Revenue per Salesperson Revenue per Product
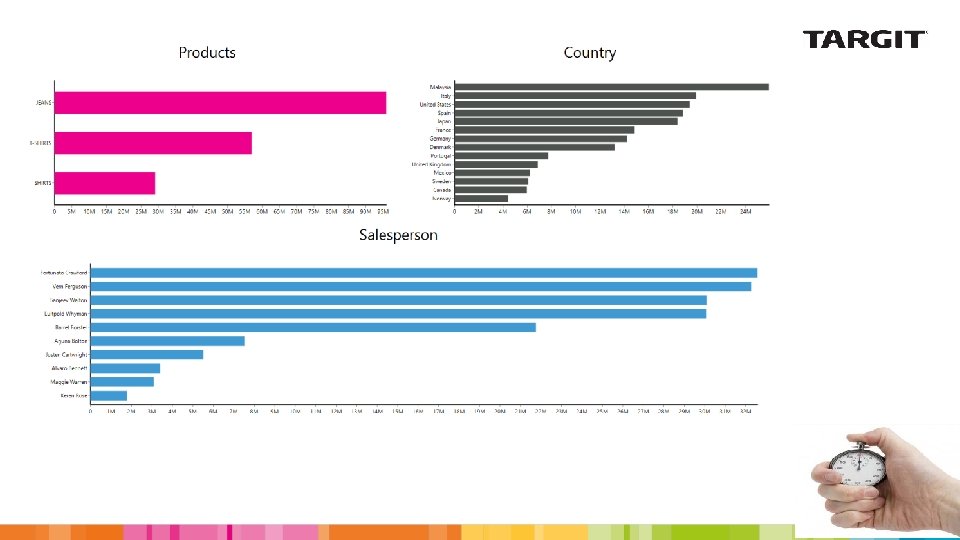
Q 2. 1. Which product has the largest revenue? 2. Which country has the largest revenue? 3. Which salesperson has the largest revenue?
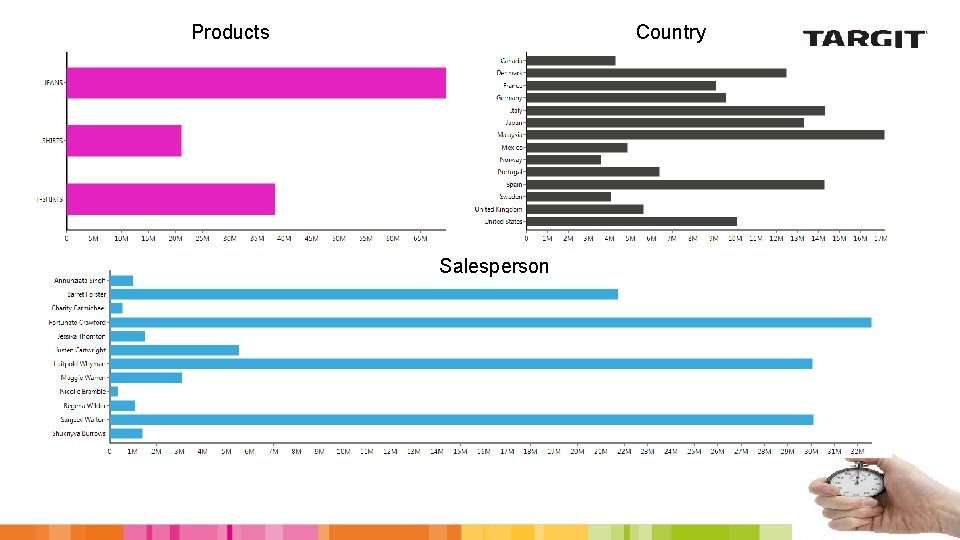
Products Country Salesperson
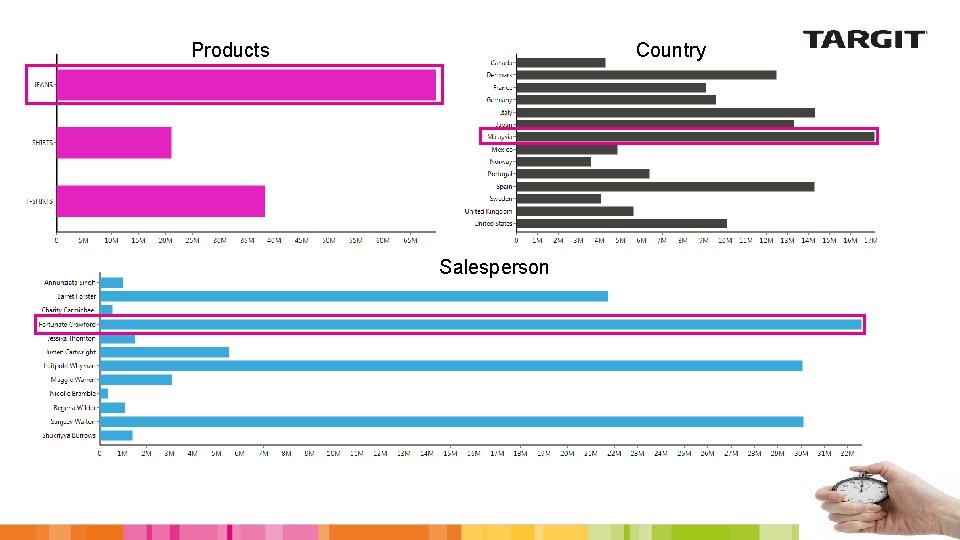
Products Country Salesperson
Gold Fish Effect What do the scientist say? "More than ever, research is highlighting a trend in reduced attention and concentration spans…the younger generation appear to be the worst afflicted, " sociologist David Moxon “…individuals who multitask emails, phone calls and social-networking sites have more trouble paying attention and focusing on important information” – The New York Times “…lack of attention has a serious impact on task performance and increases the risk of accidents. ” – sociologist David Moxon
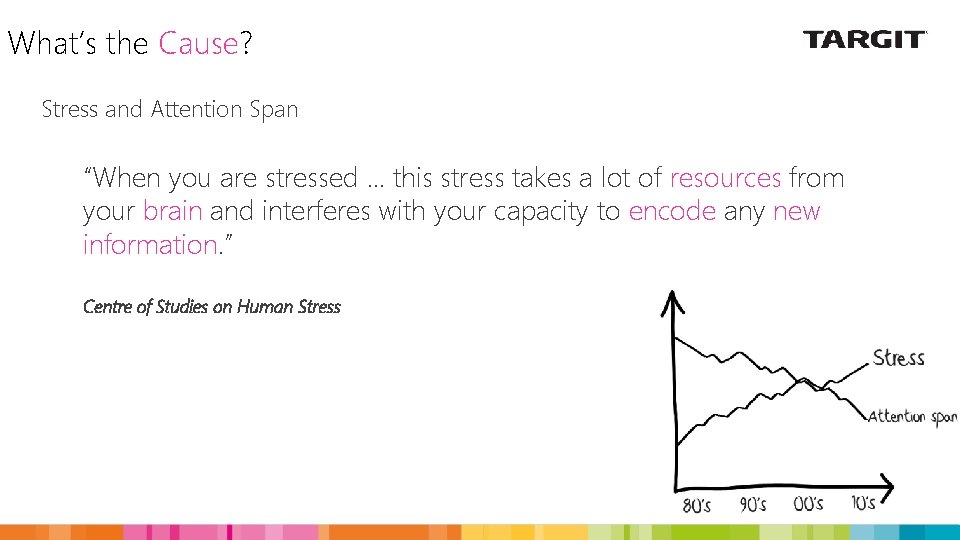
What’s the Cause? Stress and Attention Span “When you are stressed … this stress takes a lot of resources from your brain and interferes with your capacity to encode any new information. ” Centre of Studies on Human Stress
6 Best Practices for Data Visualization • Fulfill the Purpose • Consider Your Audience • Provide Context • Show the Numbers • Present the Most Important First • Pay Attention to Aesthetics @AXUG 40
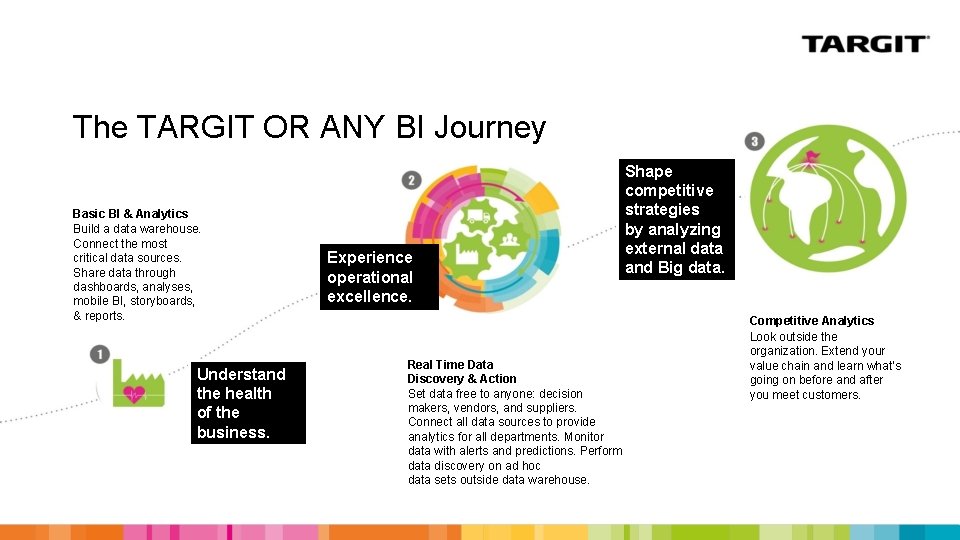
The TARGIT OR ANY BI Journey Basic BI & Analytics Build a data warehouse. Connect the most critical data sources. Share data through dashboards, analyses, mobile BI, storyboards, & reports. Understand the health of the business. Experience operational excellence. Real Time Data Discovery & Action Set data free to anyone: decision makers, vendors, and suppliers. Connect all data sources to provide analytics for all departments. Monitor data with alerts and predictions. Perform data discovery on ad hoc data sets outside data warehouse. Shape competitive strategies by analyzing external data and Big data. Competitive Analytics Look outside the organization. Extend your value chain and learn what’s going on before and after you meet customers.
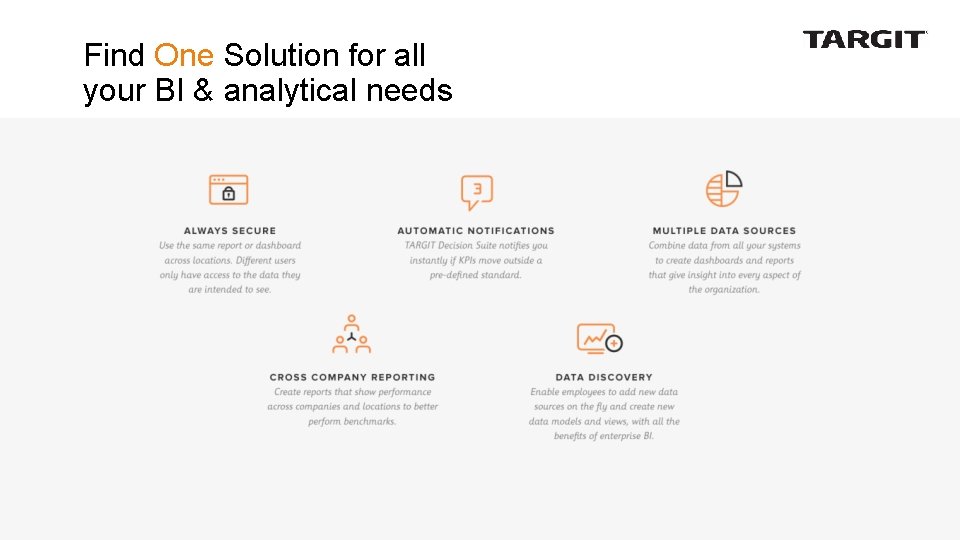
Find One Solution for all your BI & analytical needs
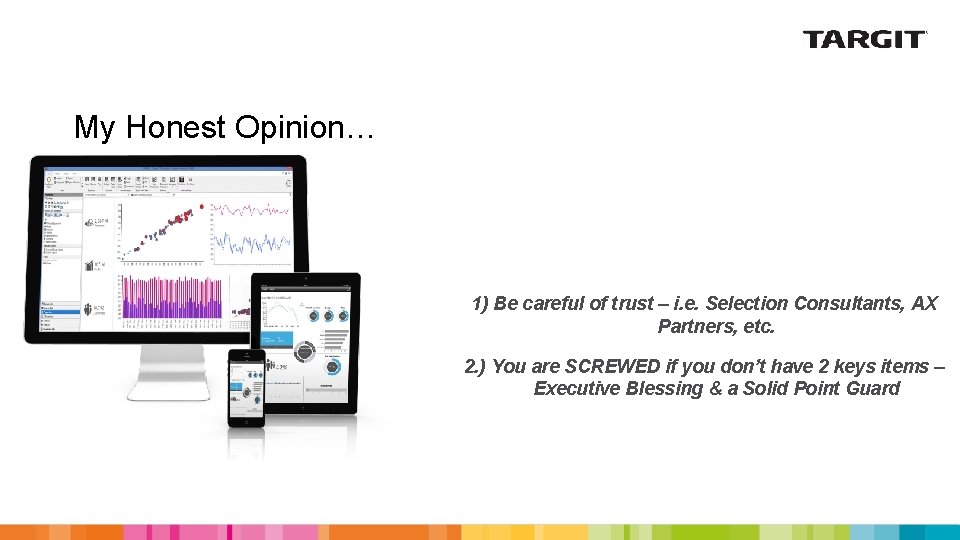
My Honest Opinion… 1) Be careful of trust – i. e. Selection Consultants, AX Partners, etc. 2. ) You are SCREWED if you don’t have 2 keys items – Executive Blessing & a Solid Point Guard
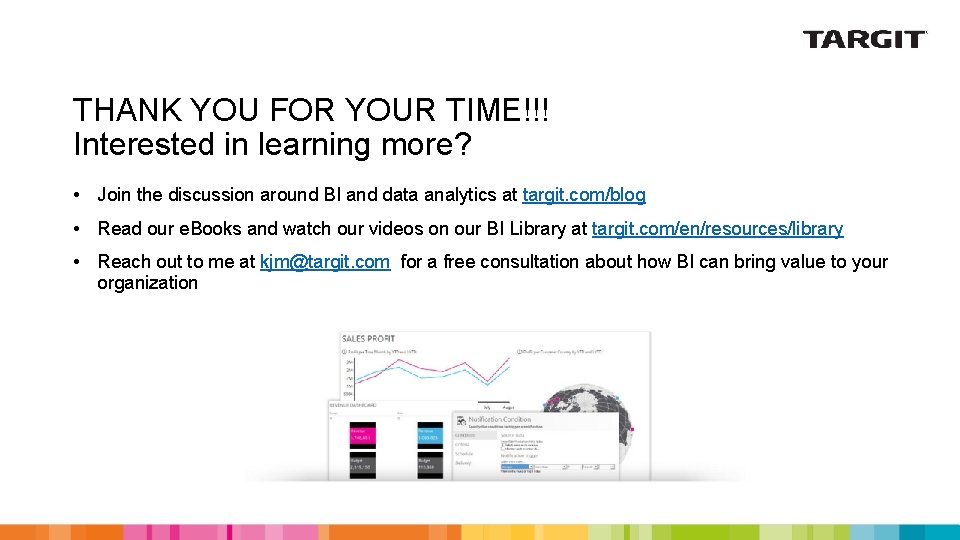
THANK YOU FOR YOUR TIME!!! Interested in learning more? • Join the discussion around BI and data analytics at targit. com/blog • Read our e. Books and watch our videos on our BI Library at targit. com/en/resources/library • Reach out to me at kjm@targit. com for a free consultation about how BI can bring value to your organization
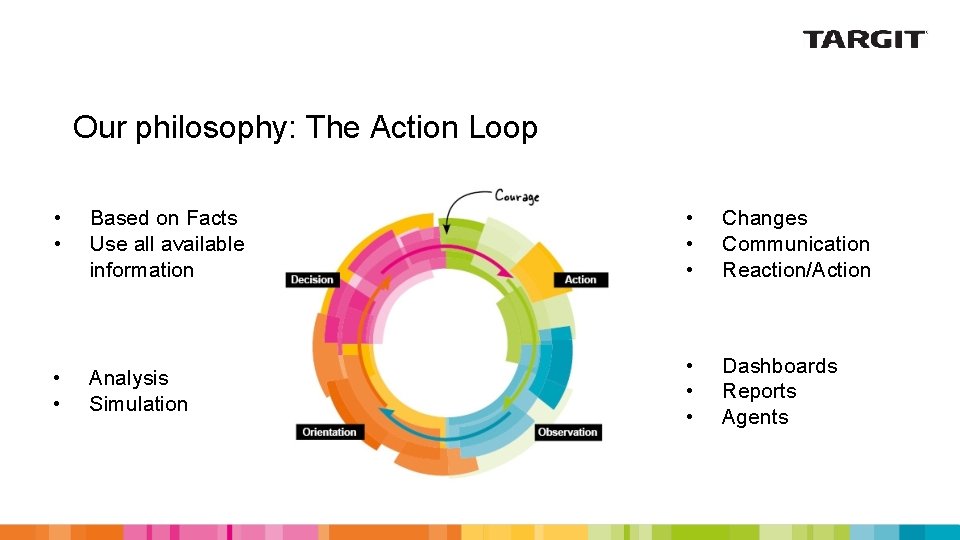
Our philosophy: The Action Loop • • Based on Facts Use all available information • • • Changes Communication Reaction/Action • • Analysis Simulation • • • Dashboards Reports Agents
Company-wide Deployment CEO The first thing I see in the morning when I look at my phone is a dashboard of overall company health. IT I have the power I need to create comprehensive analyses and don’t need to do any heavy hand holding for the users working with dashboards throughout the company. MAINTENANCE It’s easy for me to track my team’s metrics to be sure we always have the right parts in stock, at the right time. SALES I’m able to pull up a contribution analysis on my tablet on the fly when I’m on site with customers so I’m better armed to negotiate. That never fails to impress. FINANCE Closing books used to be a massively time-consuming project. Our P&Ls, balance sheets, and more are now completely dynamic. Do you have any idea how much time that saves me each month? OPERATIONS I can easily pinpoint areas of weakness such as unprofitable product lines or models that incur higher repair expenses than average using data that is updated on a daily basis.
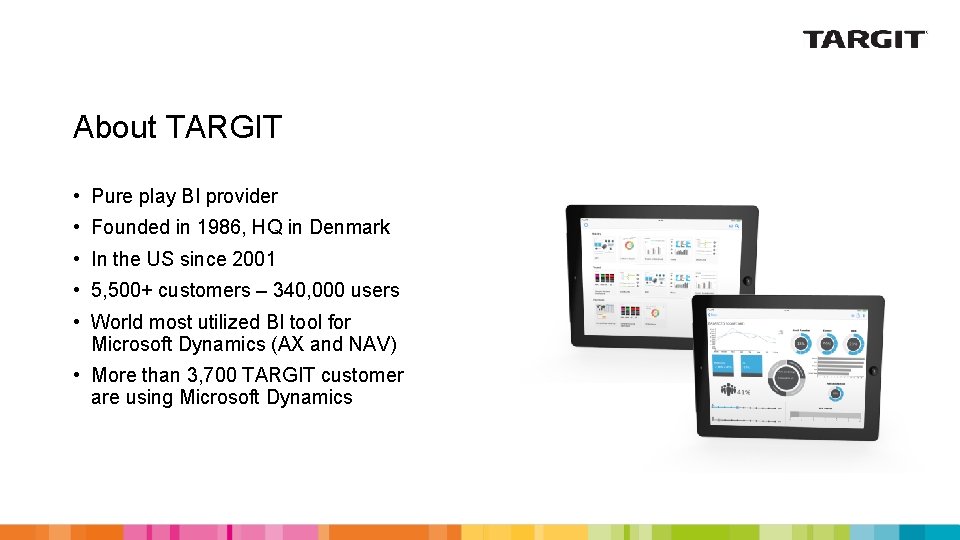
About TARGIT • Pure play BI provider • Founded in 1986, HQ in Denmark • In the US since 2001 • 5, 500+ customers – 340, 000 users • World most utilized BI tool for Microsoft Dynamics (AX and NAV) • More than 3, 700 TARGIT customer are using Microsoft Dynamics
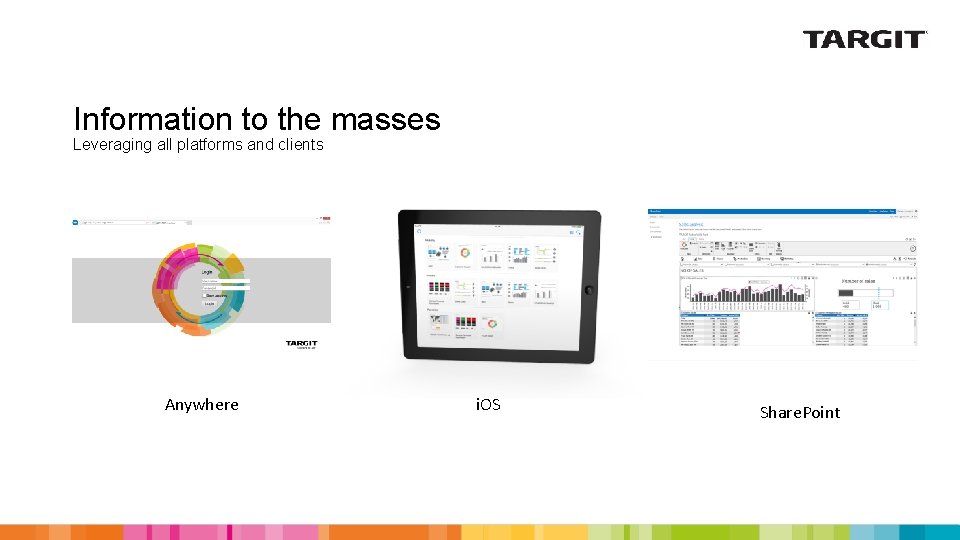
Information to the masses Leveraging all platforms and clients Anywhere i. OS Share. Point
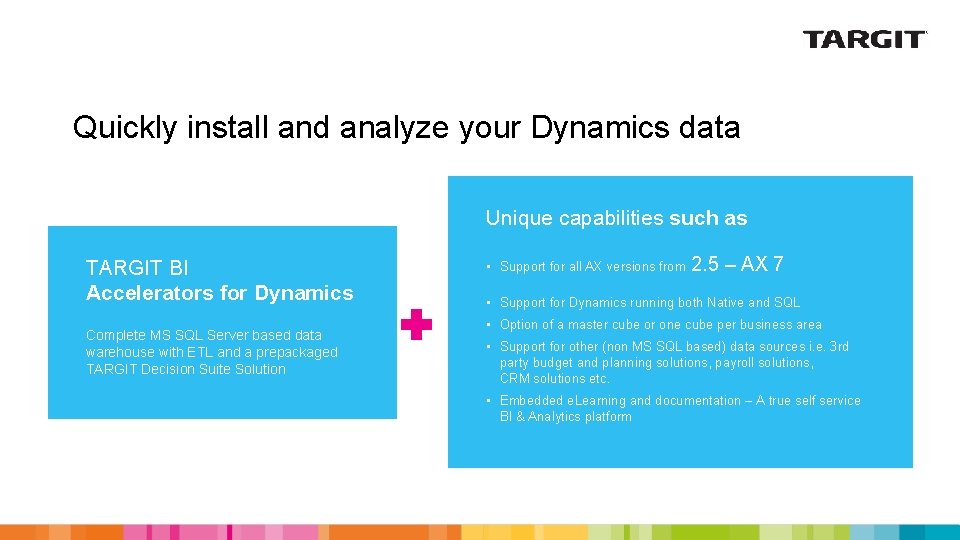
Quickly install and analyze your Dynamics data Unique capabilities such as TARGIT BI Accelerators for Dynamics Complete MS SQL Server based data warehouse with ETL and a prepackaged TARGIT Decision Suite Solution • Support for all AX versions from 2. 5 – AX 7 • Support for Dynamics running both Native and SQL • Option of a master cube or one cube per business area • Support for other (non MS SQL based) data sources i. e. 3 rd party budget and planning solutions, payroll solutions, CRM solutions etc. • Embedded e. Learning and documentation – A true self service BI & Analytics platform
- Slides: 49