How to best use these slides View the

How to best use these slides… • View the PPT as a slide show • Then click through every step • Mouse clicks will advance the slide show • Left/right arrow keys move forward/backward • Mouse wheel scrolling moves forward/backward • When a question is posed, stop and think it through, try to answer it yourself before clicking • If you have questions, use PS discussion boards, email me, and/or visit us in a Teams class session!

LESSON 7. 2 a Graphing Inverse Variation Functions

Today you will: • Graph inverse variation • Practice using English to describe math processes and equations

Core Vocabulary: • Rational function, p. 366 Prior: • Domain • Range • Polynomial • Inverse variation • Parent function • Asymptote

Quadratic:

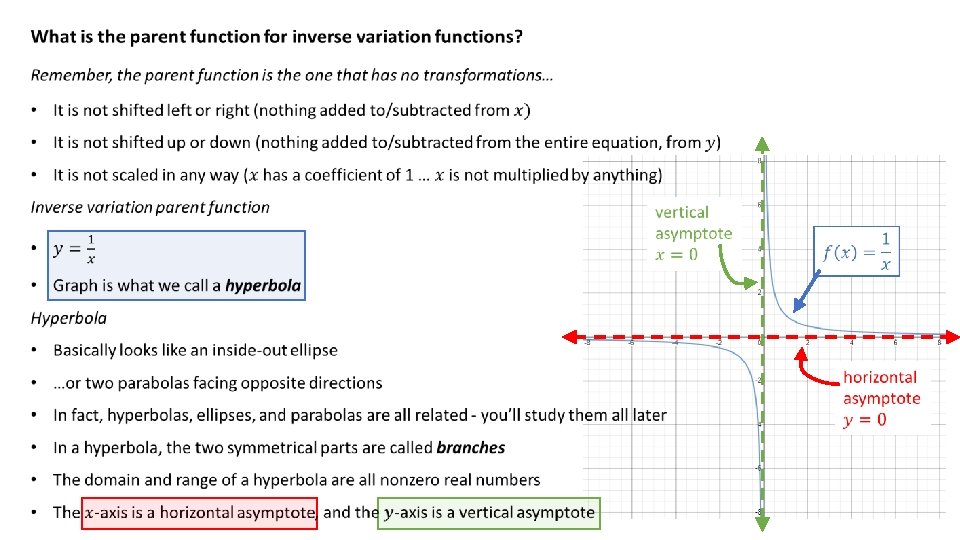
… and a REALLY important one … ASYMPTOTES What is an asymptote? • A straight line that a curve approaches (gets closer and closer to) but never touches • We say the curve gets “infinitely” close to the asymptote • It can be horizontal, vertical or slanted (you’ll study slant asymptotes in Math Anal) Horizontal asymptote Vertical asymptote Who cares? • Asymptotes are super important • They tell us what happens with the data as time goes on • . . . tells us what the limit/maximum value for the data set is Slant asymptote

How would we graph the inverse variation parent function? Just like we would any other function… 1. Create a table of values • Trick is picking “good” values • For this, pick positive and negative numbers around zero x y 2. Plot the points • Draw the graph (don’t forget to label axes & use arrow heads!) • Then the points themselves 3. Connect the dots! 1 2 3
!")
… remember a polynomial can be just a number (a constant)!

Let’s graph a simple Rational Function! SOLUTION Step 2 Make a table of values and plot the points. Include both positive and negative values of x. x 1 2 y 4 2 3 g f Step 3 Draw the two branches of the hyperbola so that they pass through the plotted points and approach the asymptotes. The graph of g lies farther from the axes than the graph of f. Both graphs lie in the first and third quadrants and have the same asymptotes, domain, and range.

… pick “good” values around the “center” of the data set

Homework Pg 370, #3 -10
- Slides: 12