
How many states have you visited Paste States
- Slides: 14
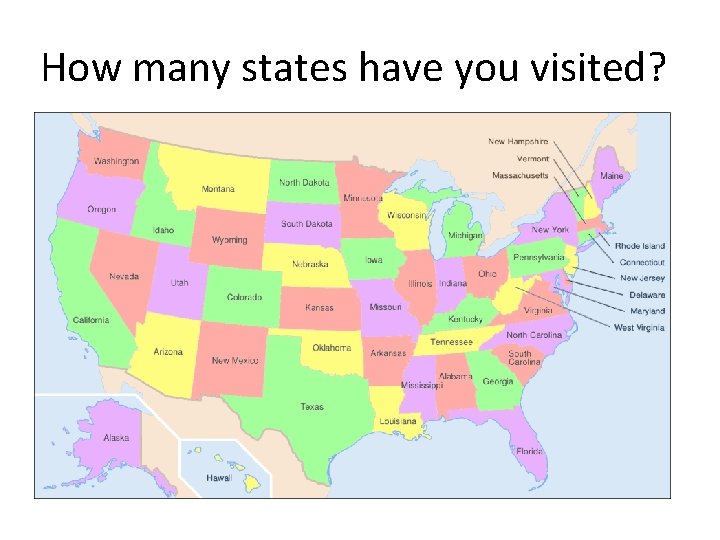
How many states have you visited?
Paste States Visited Class Data Here: Wolfram Alpha Widget
Unit 2 : Data Analysis Histograms CCSS: S. ID. 1, S. ID. 2, S. ID. 3
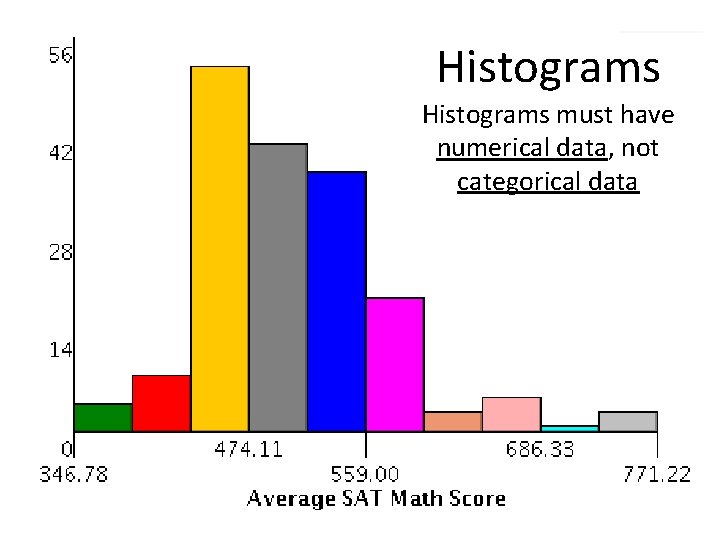
Histograms must have numerical data, not categorical data
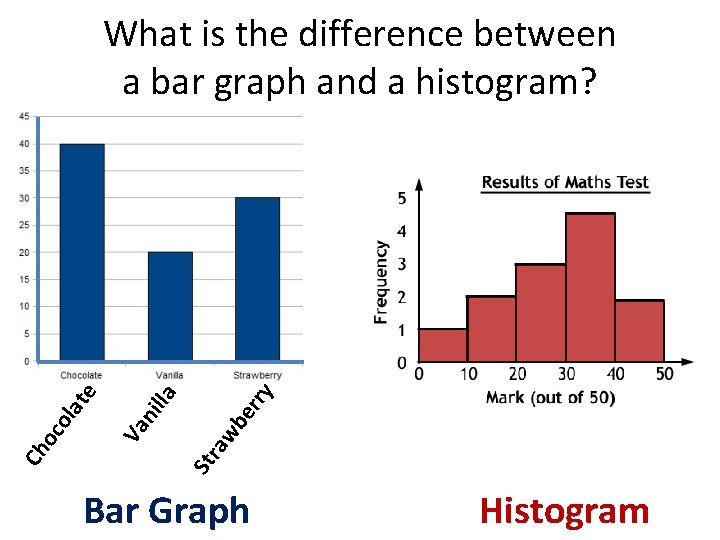
ry er St ra wb la nil Va Ch o co lat e What is the difference between a bar graph and a histogram? Bar Graph Histogram
Did you mention…? • Histograms are made up of numerical data, so we can estimate the range, the mean, the minimum, etc. • Bar Graphs are categorical data (qualitative). Can we find the ‘average’ color? No. • Bar Graphs have spaces between the categories. There are never spaces between the vertical bars in a histogram.
Histograms have similar characteristics as other graphical representations. . . • Shape: Left Skewed, Right Skewed, Symmetric, Unimodal, Bimodal, Gap(s) • Outlier(s): Are there value(s) that are extreme values? • Center: Where is most of the data? (we use mean to describe the center of histograms) • Spread: Is the distribution bunched up or spread out? (we use standard deviation to describe spread in histograms)
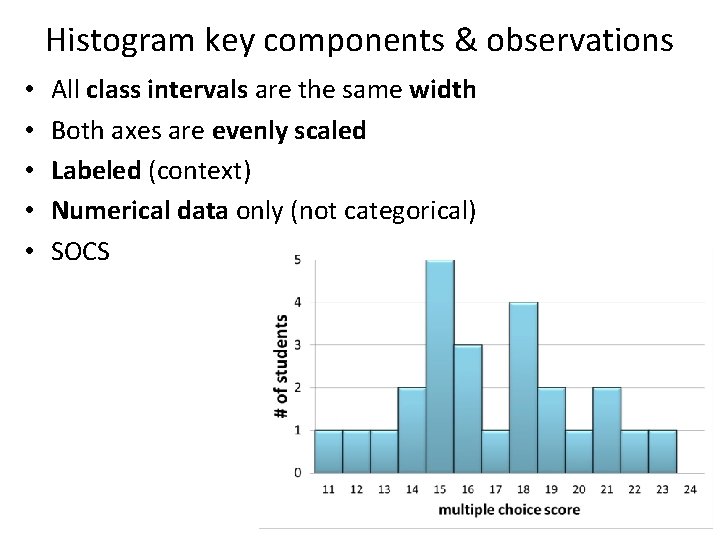
Histogram key components & observations • • • All class intervals are the same width Both axes are evenly scaled Labeled (context) Numerical data only (not categorical) SOCS
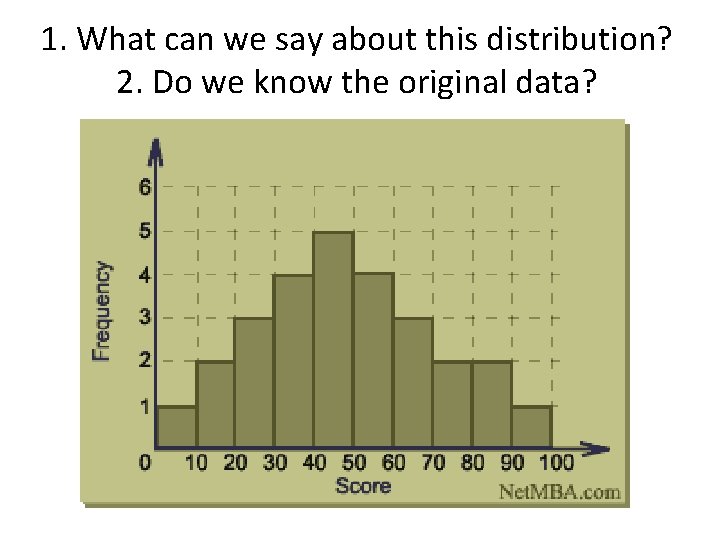
1. What can we say about this distribution? 2. Do we know the original data?
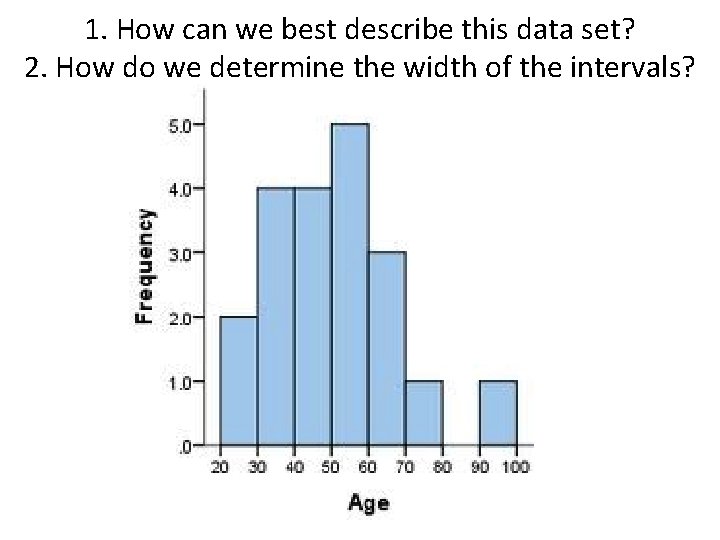
1. How can we best describe this data set? 2. How do we determine the width of the intervals?
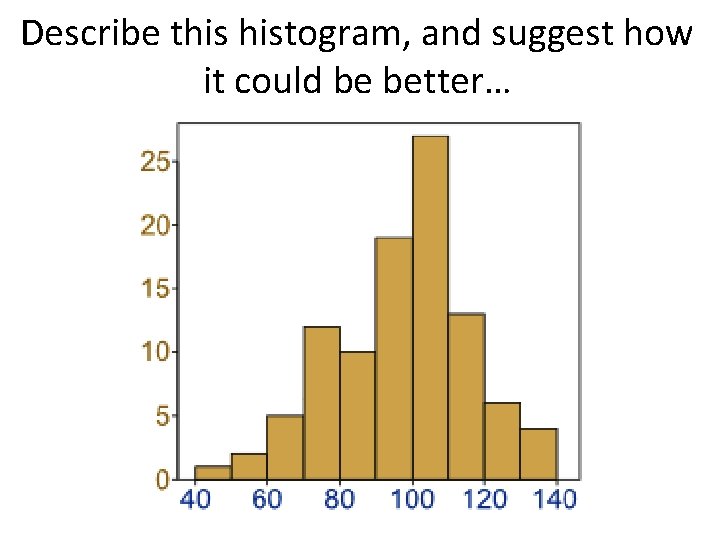
Describe this histogram, and suggest how it could be better…
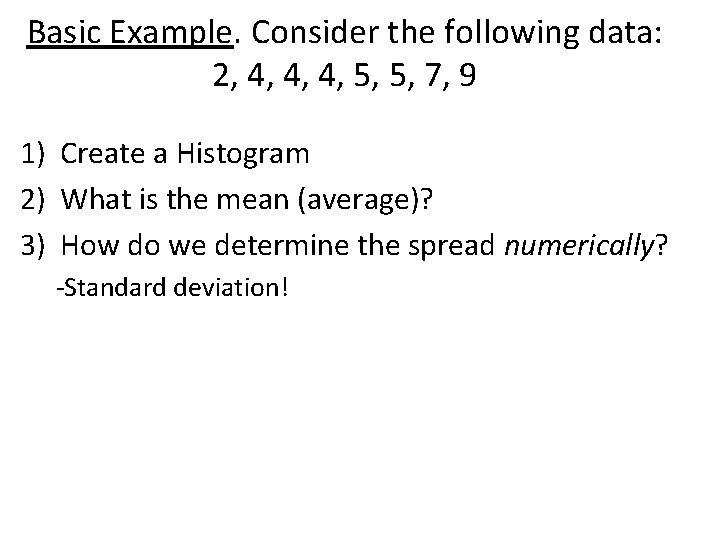
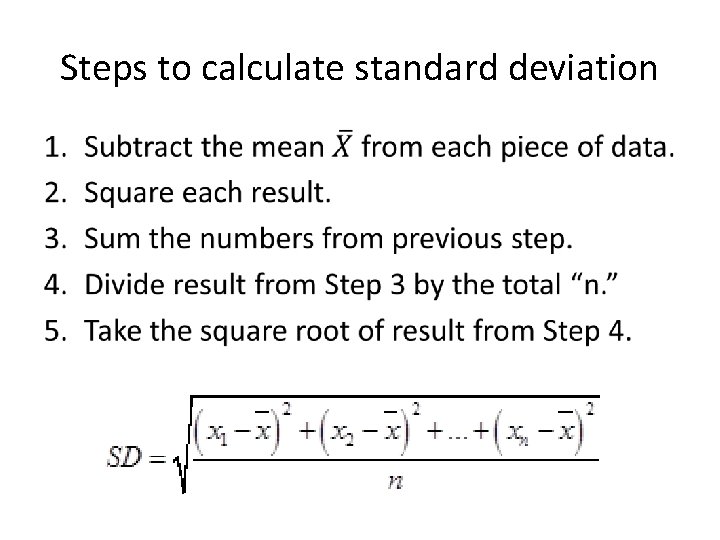
Basic Example. Consider the following data: 2, 4, 4, 4, 5, 5, 7, 9 1) Create a Histogram 2) What is the mean (average)? 3) How do we determine the spread numerically? -Standard deviation!
Steps to calculate standard deviation •
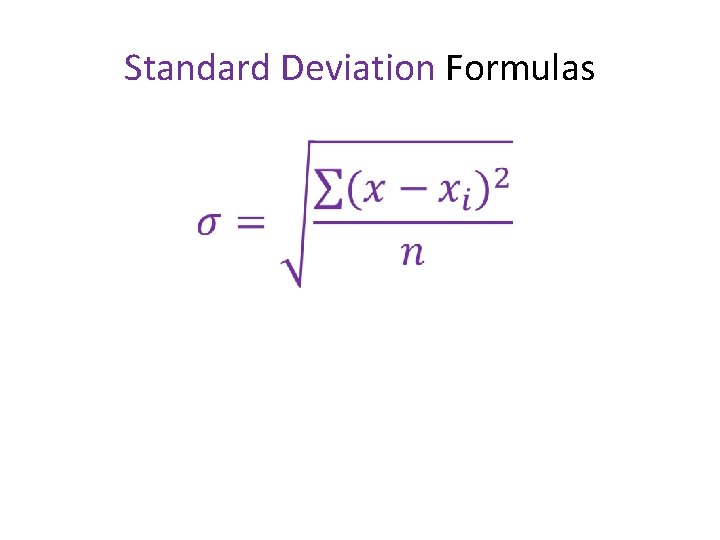
Standard Deviation Formulas