How I do infusion test Dr Zofia H


 pulse is helpful.")


 ‘Dynamic’ analysis may predict plateau")


- Slides: 20
How I do infusion test. Dr Zofia H. Czosnyka University of Cambridge, UK Infusion test: procedure to identify model of CSF compensatory reserve introduced in 1973 by Anthony Marmarou. Essential parameters: Resistance to CSF outflow and compliance of CSF space ICP Infusion 1 ml/min TIME ~30 minutes
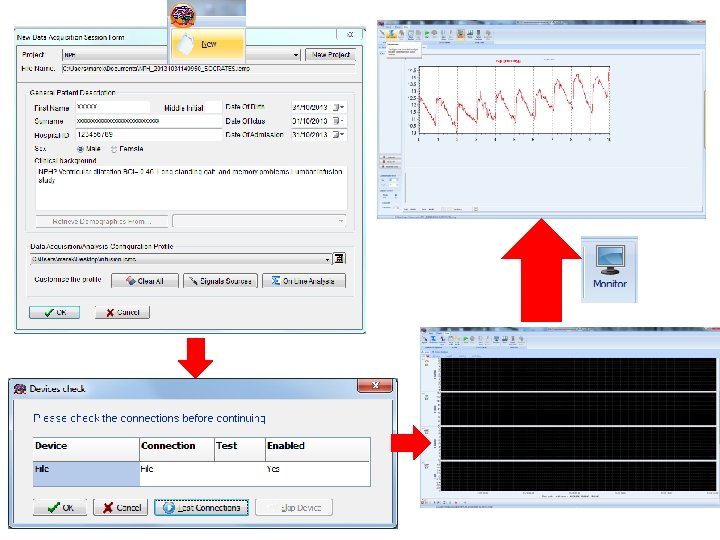
What we need? • Hardware • Pressure transducer, • tubing, needles Essential: sterile preparation of transducer and tubings
If pulse waveform of ICP is small or noisy, ABP (Finapress) pulse is helpful. See spectra, check peaks associated to heart rate in ABP and ICP
ICP HR AMP RAP Real time observation of trends of mean ICP, heart rate, pulse amplitude of ICP and RAP index during the study. Always mark start, end of infusion!
ICP AMP RESP RR Slow SD AMP/RESP ‘Waveforms trends’ – pulse amplitude, respiratory rate (RR), power of SLOW ICP waves
ICP AMP ICP Pulse amplitude/pressure line. Slope is usually positive. Higher slope (according to Professor Anile, J Neurosurg. 2010 Jul; 113(1): 64 -73) => indicates better chance to respond to shunting: Slope above 0. 15.
Lower breakpoint of AMP-P line- is it ‘optimal pressure? ICP AMP ICP
ICP AMP After study is finished: Analysis of the model of Professor Marmarou: First: mark baseline, transition and end-plateau periods. Introduce infusion rate and press ‘calculate’
Click ‘more’ and you see: Interpolation of ICP trend with modelling curve Trend of amplitude in time Exponential pressure-volume curve Amplitude – pressure line I use this screen to assess visually quality of identification of the model
If everything looks OK, you can display report and copy/ paste it to WORD
Test ‘unfinished’- if pressure increases to 40 mm Hg without reaching plateau ICP HR AMP RAP
R= 77 mm. Hg/(ml/min) ‘Dynamic’ analysis may predict plateau
ICP AMP One needle test: we usually observe rapid increase of ICP just after start of infusion, not reflected by increase in AMP. Tick in ‘Parameters’ -> ‘one needle’ option and problem of higher resistance of the needle may be solved automatically. . .
Step-rise of ICP is accounted for and eliminated from its potential influence on CSF compensatory parameters
ICP HR AMP RAP Hydrocephalus post SAH in 2006. Shunted - revisions. Last revision (09/10/12). Now in situ: VP stratas @ 0. 5 in line with Ommaya. Headaches, tenderness over the tubing and the valve.
Shunt underdrains ICM+ has a database of shunt parameters from Cambridge Shunt Lab. Every shunt at given performance level has a limit above which pressure should not rise during infusion of given rate ( 1 ml/min or 1. 5 ml/min). If pressure exceeds this limit (blue horizontal line), it indicates that shunt underdrains.
If blue line is not crossed, shunt probably works properly
John Hospital. No XXXX 28/10/2013 Date. Of. Birth Date. Of. Ictus XXXX 28/10/2013 Male Sex Date. Of. Admission SAH, delayed hydrocephalus, low OP in LP. Increase in ventricle size in CT. Low GCS (9). LP study on A 5 ICP baseline [mm. Hg] AMP baseline [mm. Hg] Rcsf [mm. Hg*min/ml] PVI [ml] CSF production rate [ml/min] Infusion duration [min] 4. 39 0. 94 16. 27 17. 07 0. 27 19. 66 ICP plateau [mm. Hg] AMP plateau [mm. Hg] Elastance [1/ml] Pss [mm. Hg] Volume infused [ml] Normalised Error [%] 25. 52 2. 79 0. 14 0. 00 29. 48 1. 351 Normal baseline pressure with increased resistance to CSF outflow. Strong regular vasogenic waves recorded during the study. Overall: Disturbed CSF dynamics. Dr. Czosnyka CSF sample sent to bacteriology Y CSF withdrawn at end of study as therapeutic test: N Should you require any assistance with these results, Professor Pickard, Dr’s Zofia or Marek Czosnyka will be happy to assist. Contact details are: Dr Zofia Czosnyka – 72831764; Dr Marek Czosnyka – 3932; Professor Pickard – 6858 (Maria, secretary) Final report sent to consultant neurosurgeon
Happy infusion studies!