How has the UKs energy supply and demand


 has increased in the UK since the 1950")


- Slides: 12
How has the UK’s energy supply and demand changed? 19 December 2021 Focus Task Why might the supply of the UK’s energy change?
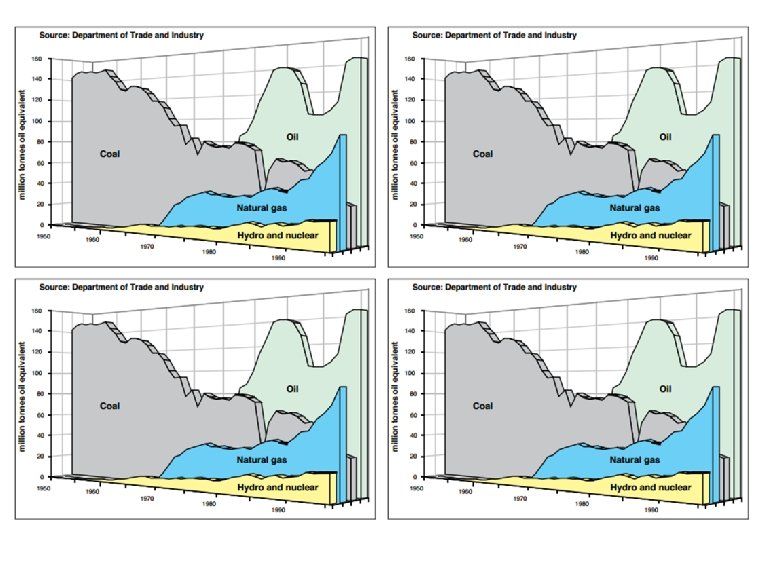
Supply Annotate the graph to show changes in the supply of the UK’s energy between 1950 and 1996. Explain reasons for potential changes in the supply of energy.
In 1950, almost all energy came from coal. It was used for heat and hot water. Since 1960, coal has declined die to closure of mines and strikes. Oil increased vastly due to finds in the North Sea. Renewable energy increased slowly due to high costs to set up. In 1950, small amount of hydro in Scotland. Natural gas and nuclear increased, with several nuclear plants being built. Gas soured since 1990 s.
Supply The energy supply has changed over the years due to the role of the government and international organisations. Task: Create a spider diagram to show this has affected the supply.
Demand of energy Energy consumption (use) has increased in the UK since the 1950 s. Task: Identify why this is the case by making a bullet point list in your book. • Growth in population • Increase demands in homes (electricals, heating) • Demand from industry/transport (more car ownership)
Demand of energy Between 2005 and 2011, overall energy consumption in UK homes fell by more than 25%. This was due to increase in costs of energy and other factors. Use the images to help you identify these different factors.
Demand of energy https: //www. epcregister. com/report. Search. Address. Terms. html? redir ect=report. Search. Address. By. Postcode
Demand of energy https: //www. epcregister. com/report. Search. Address. Terms. html? redir ect=report. Search. Address. By. Postcode
Demand of energy Government insulation policy. 5. 3 million homes received free lost insulation to save • energy. • Since 2007, buildings for sale/rent in the UK has to undergo a Energy Performance Certification (EPC). This encourages owners be more energy efficient. • • • Since 2005, all new boilers fitted need to be at least a B rating. More aware of our energy use and footprint (e. g. smart meters). The EU introduced ‘energy labels’ to show the efficiency of products (washing machines etc). Ranges from A*** to D.
Resources
Supply In 1961, coal accounted for 80% of the UK’s energy supply. Since then it has declined erratically to its current level of about 30%. Notice the sudden dip in the 1980 s. This was due to a prolonged miners’ strike in 1984 -5 over mine closures and job losses. Since then, coal production declined rapidly. It had become increasingly expensive to mine and alternative energy sources were becoming available, particularly oil and gas from the Middle East. In 1974, the international organisation OPEC quadrupled the price of oil on the world markets which explained the spike in coal production at the time. Also the UK had started to develop its North Sea oil and gas, with the first oil being produced in 1975 and reaching its peak production in 1985. This is because the government recognised the power of OPEC in determining world prices and so wanted to make the UK as self-sufficient as possible in energy production. However in the early 1990 s the EU’s “Gas Burn” directive was revoked. Up until then there had been restrictions on the use of gas over safety concerns. Once revoked the use of natural gas increased rapidly leading to a fall in oil consumption. In recent years, international organisations such as the EU and the United Nations have responded to the challenges of climate change by setting limits on carbon emissions. This has led to the reductions in fossil fuels, particularly coal and oil, in favour of developing renewable sources of energy, such as wind and solar. Natural gas is the favoured fossil fuel as it has relatively low carbon and sulphur emissions. Many of these have been supported by the UK government, which has a target of reducing carbon emissions by 60% by 2050.