
How does video quality impact user engagement Vyas


- Slides: 37
How does video quality impact user engagement? Vyas Sekar, Ion Stoica, Hui Zhang Acknowledgment: Ramesh Sitaraman (Akamai, Umass) - Conviva Confidential -
Attention Economics Overabundance of information implies a scarcity of user attention! Onus on content publishers to increase engagement
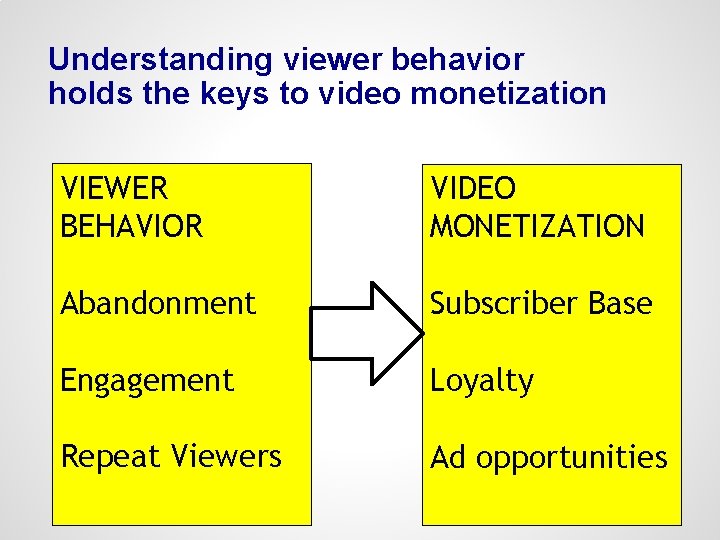
Understanding viewer behavior holds the keys to video monetization VIEWER BEHAVIOR VIDEO MONETIZATION Abandonment Subscriber Base Engagement Loyalty Repeat Viewers Ad opportunities
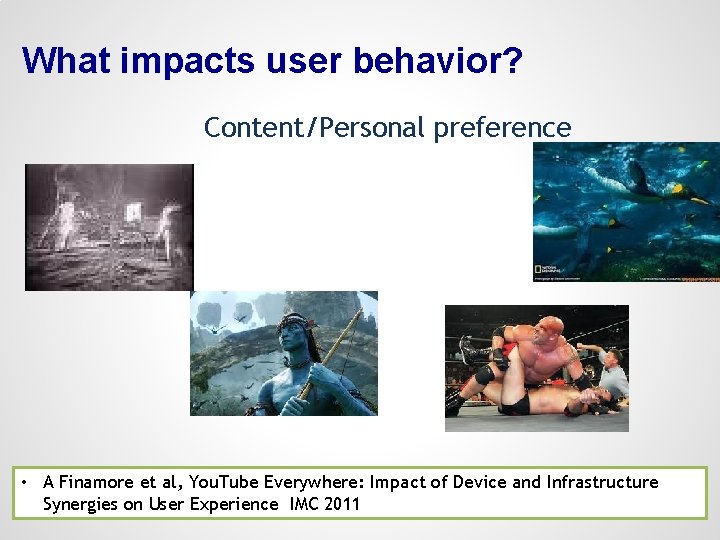
What impacts user behavior? Content/Personal preference • A Finamore et al, You. Tube Everywhere: Impact of Device and Infrastructure Synergies on User Experience IMC 2011
Does Quality Impact Engagement? How? Buffering. .
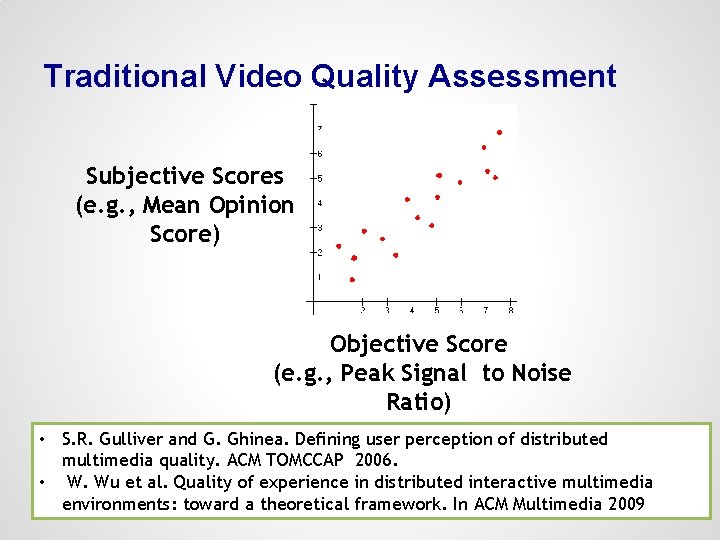
Traditional Video Quality Assessment Subjective Scores (e. g. , Mean Opinion Score) Objective Score (e. g. , Peak Signal to Noise Ratio) • S. R. Gulliver and G. Ghinea. Defining user perception of distributed multimedia quality. ACM TOMCCAP 2006. • W. Wu et al. Quality of experience in distributed interactive multimedia environments: toward a theoretical framework. In ACM Multimedia 2009
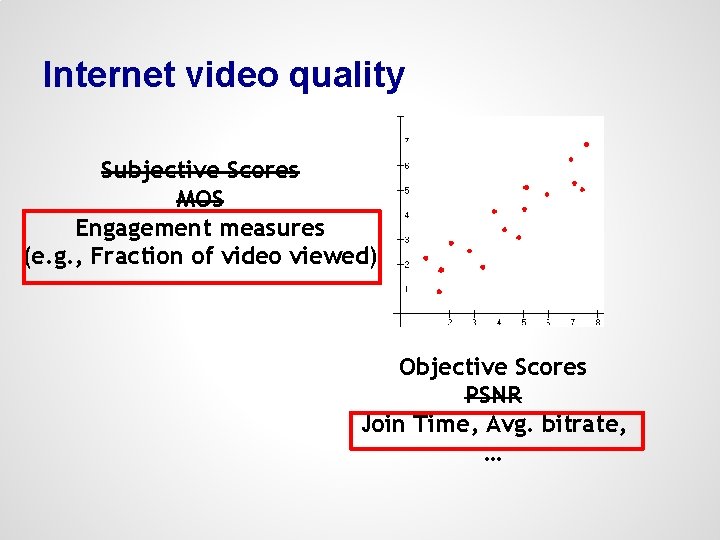
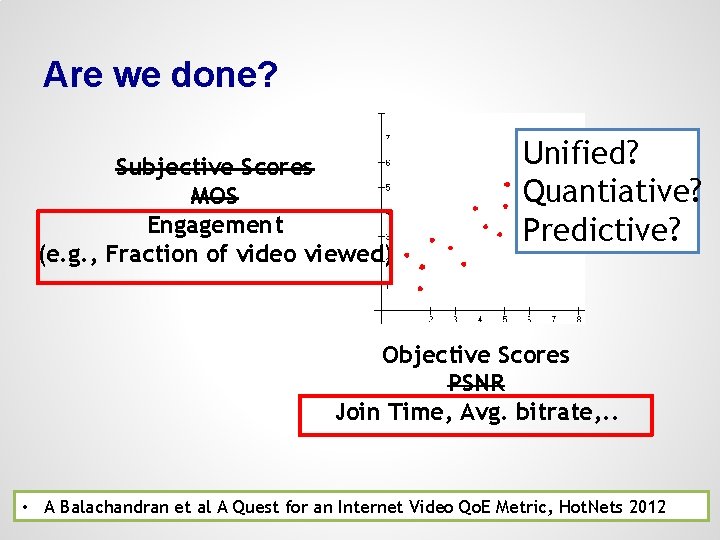
Internet video quality Subjective Scores MOS Engagement measures (e. g. , Fraction of video viewed) Objective Scores PSNR Join Time, Avg. bitrate, …
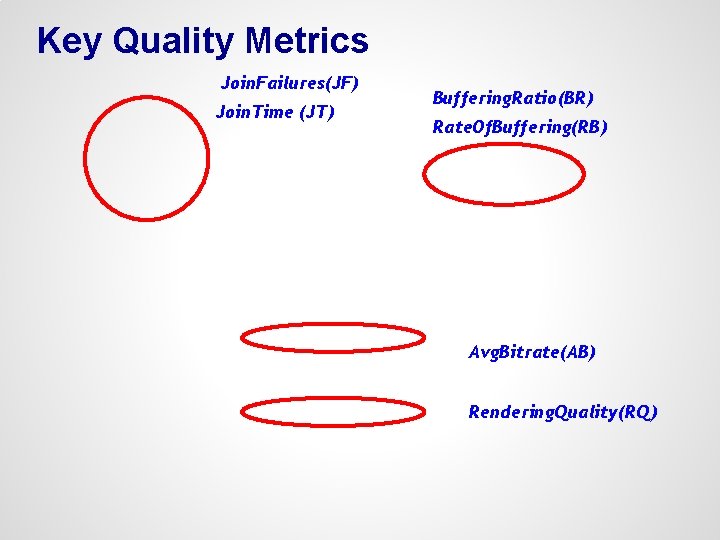
Key Quality Metrics Join. Failures(JF) Join. Time (JT) Buffering. Ratio(BR) Rate. Of. Buffering(RB) Avg. Bitrate(AB) Rendering. Quality(RQ)
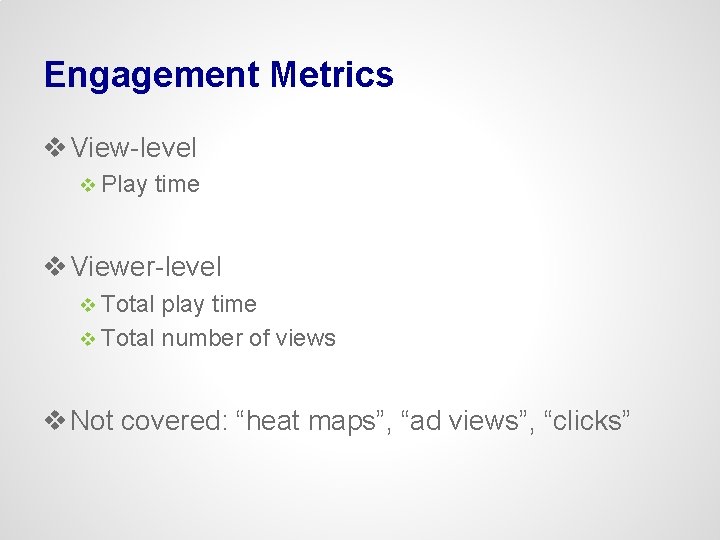
Engagement Metrics v View-level v Play time v Viewer-level v Total play time v Total number of views v Not covered: “heat maps”, “ad views”, “clicks”
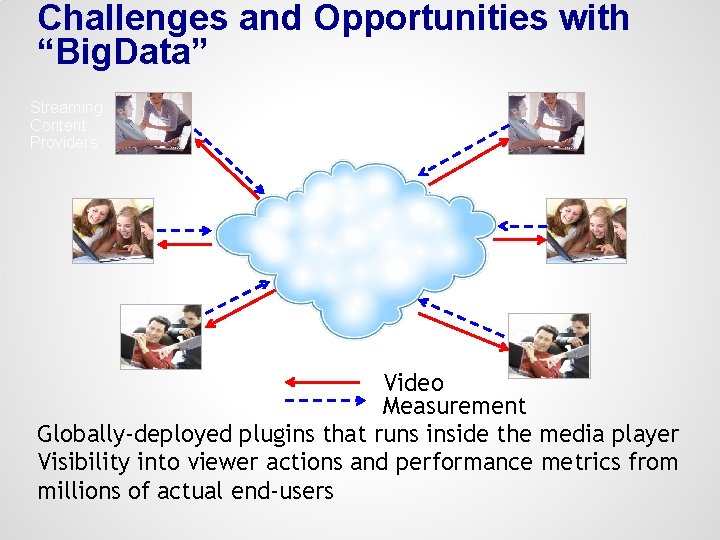
Challenges and Opportunities with “Big. Data” Streaming Content Providers Video Measurement Globally-deployed plugins that runs inside the media player Visibility into viewer actions and performance metrics from millions of actual end-users
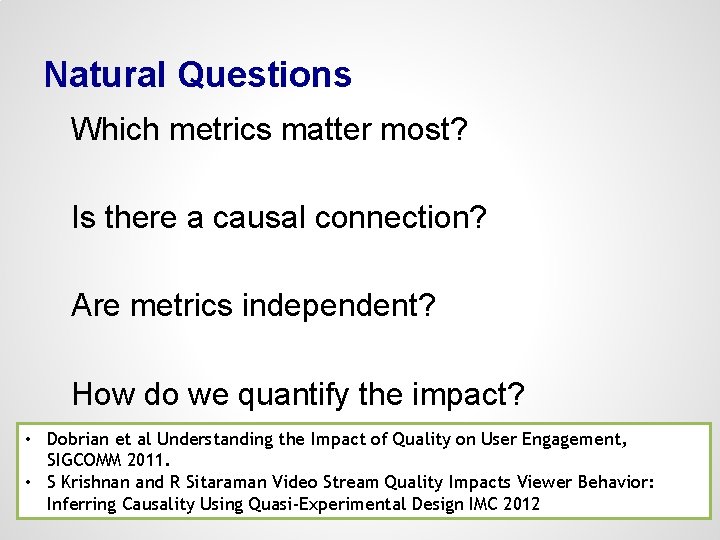
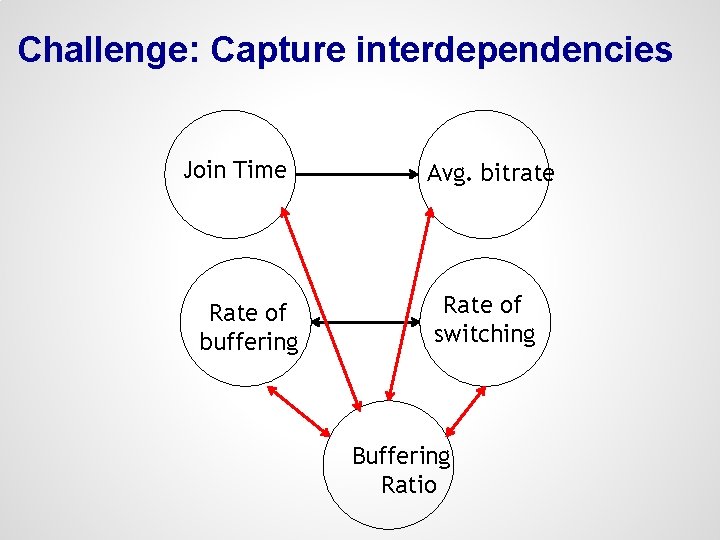
Natural Questions Which metrics matter most? Is there a causal connection? Are metrics independent? How do we quantify the impact? • Dobrian et al Understanding the Impact of Quality on User Engagement, SIGCOMM 2011. • S Krishnan and R Sitaraman Video Stream Quality Impacts Viewer Behavior: Inferring Causality Using Quasi-Experimental Design IMC 2012
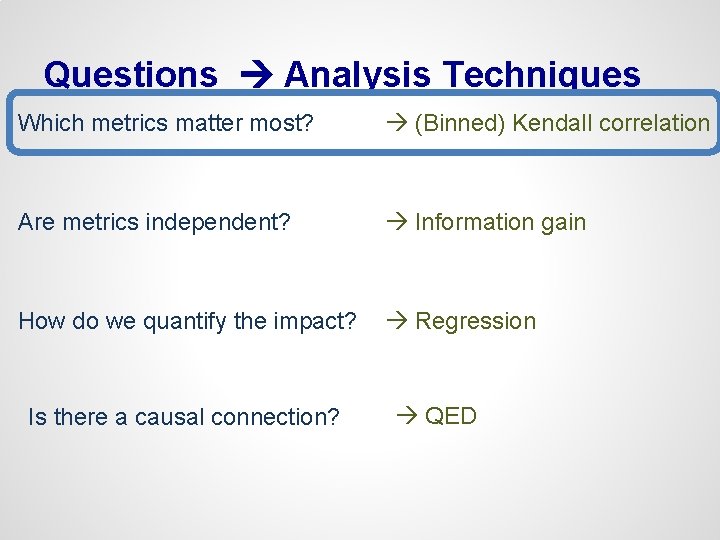
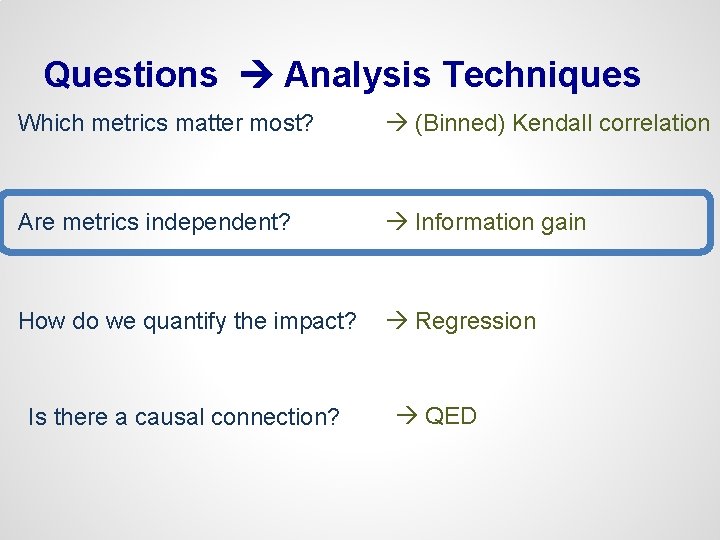
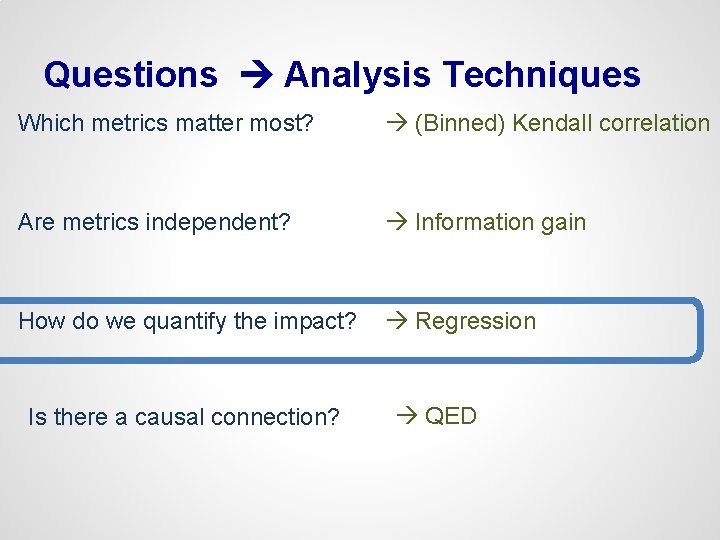
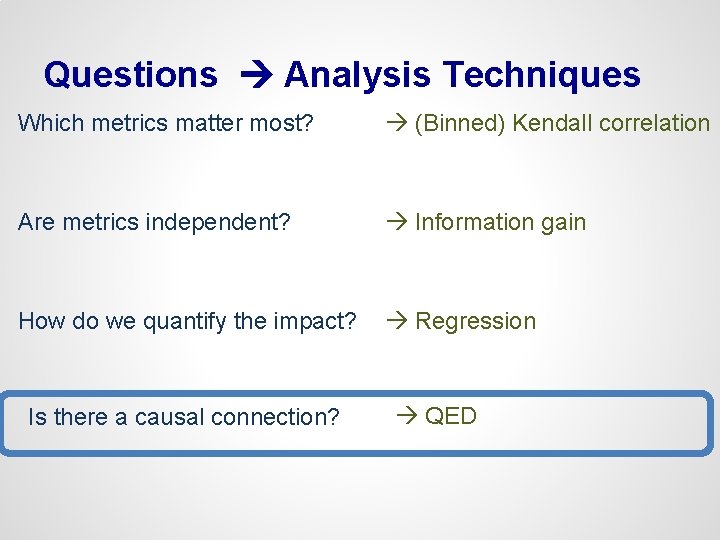
Questions Analysis Techniques Which metrics matter most? (Binned) Kendall correlation Are metrics independent? Information gain How do we quantify the impact? Regression Is there a causal connection? QED
“Binned” rank correlation v Traditional correlation: Pearson v Assumes linear relationship + Gaussian noise v Use rank correlation to avoid this v Kendall (ideal) but expensive v Spearman pretty good in practice v Use binning to avoid impact of “samplers”
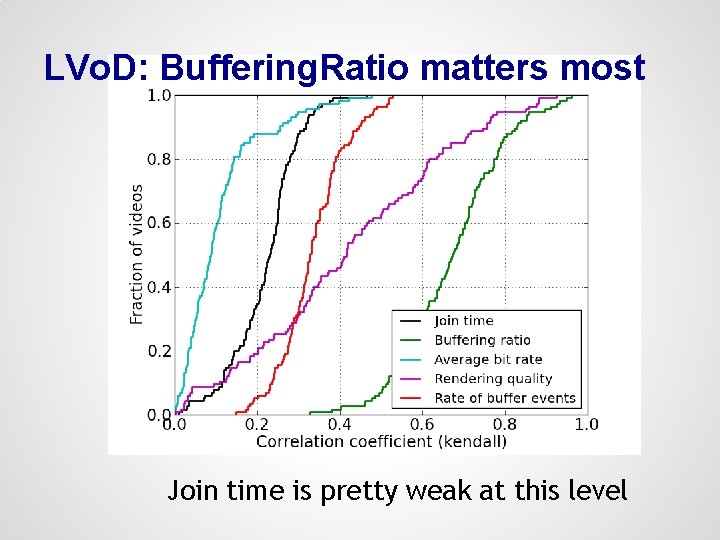
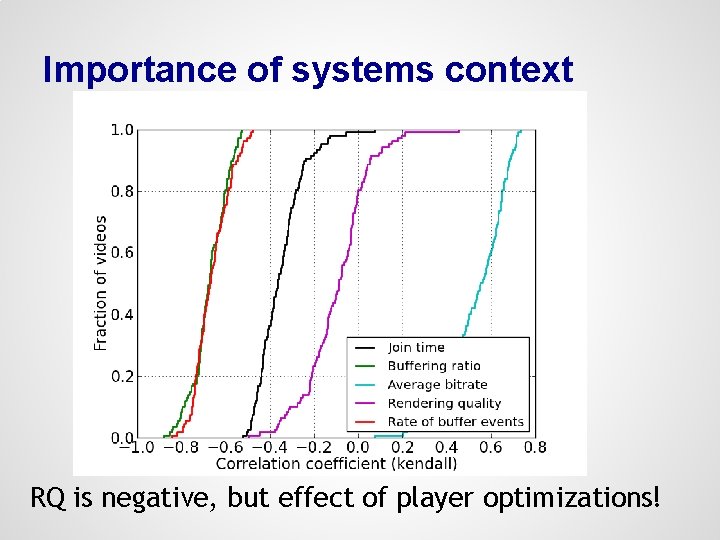
LVo. D: Buffering. Ratio matters most Join time is pretty weak at this level
Questions Analysis Techniques Which metrics matter most? (Binned) Kendall correlation Are metrics independent? Information gain How do we quantify the impact? Regression Is there a causal connection? QED
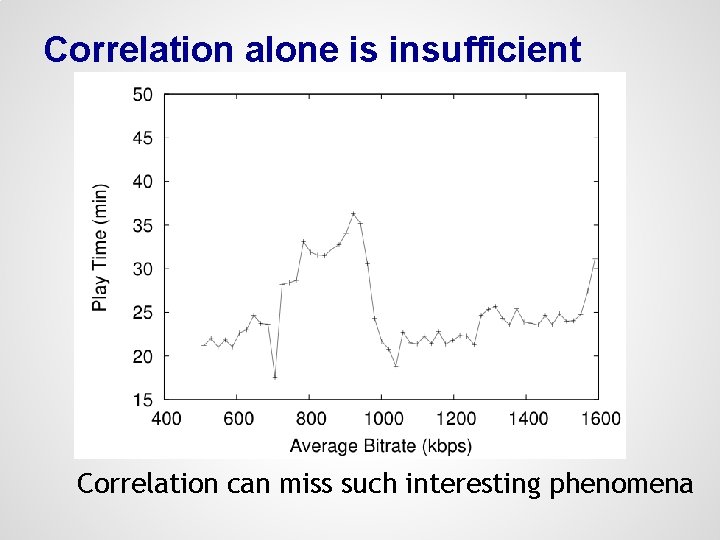
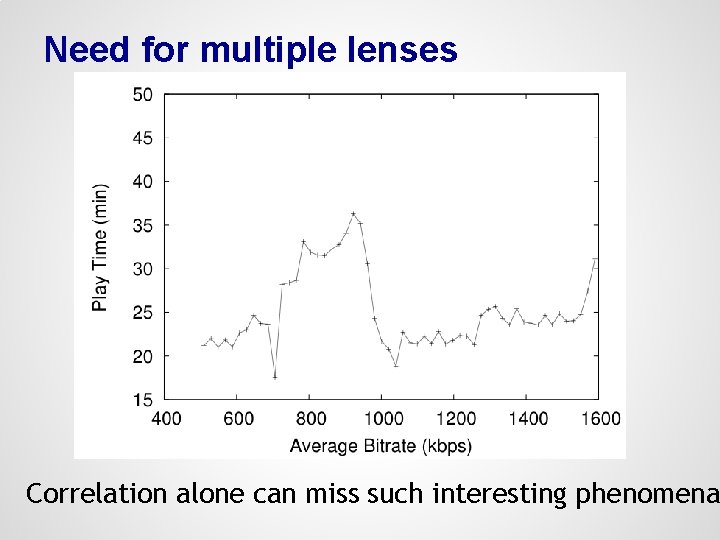
Correlation alone is insufficient Correlation can miss such interesting phenomena
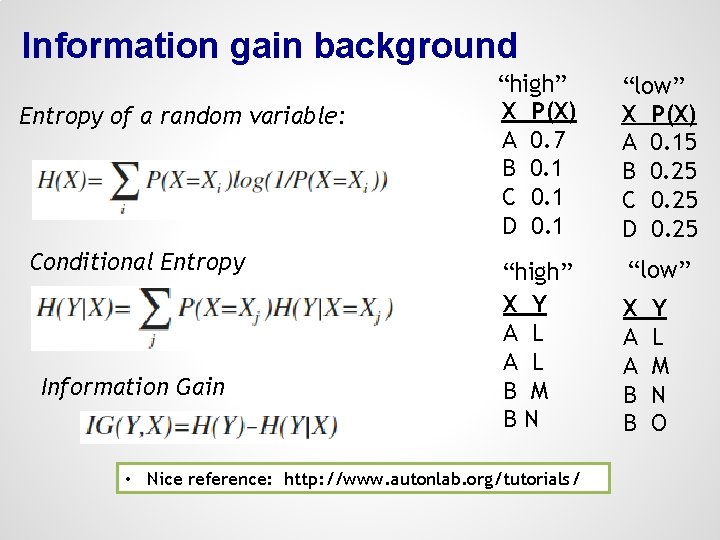
Information gain background Entropy of a random variable: Conditional Entropy Information Gain “high” X P(X) A 0. 7 B 0. 1 C 0. 1 D 0. 1 “low” X P(X) A 0. 15 B 0. 25 C 0. 25 D 0. 25 “high” X Y A L B M BN “low” • Nice reference: http: //www. autonlab. org/tutorials/ X A A B B Y L M N O
Why is information gain useful? v Makes no assumption about “nature” of relationship (e. g. , monotone, inc/dec) v Just exposes that there is some relation v Commonly used in feature selection v Very useful to uncover hidden relationships between variables!
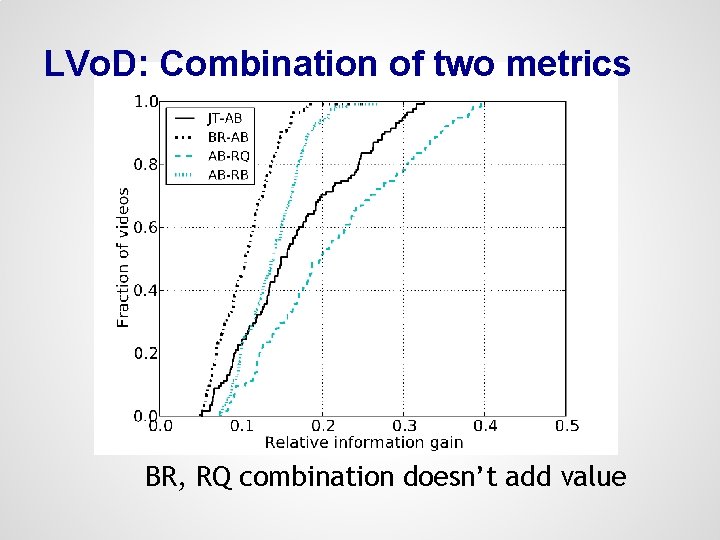
LVo. D: Combination of two metrics BR, RQ combination doesn’t add value
Questions Analysis Techniques Which metrics matter most? (Binned) Kendall correlation Are metrics independent? Information gain How do we quantify the impact? Regression Is there a causal connection? QED
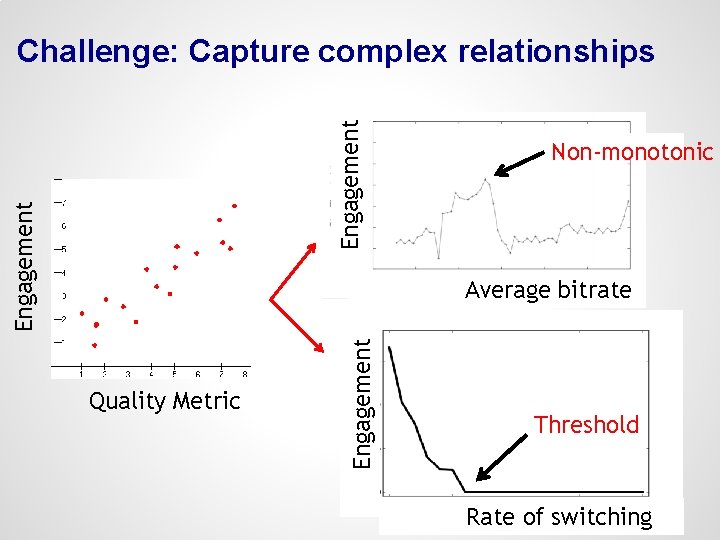
Why naïve regression will not work v Not all relationships are “linear” v E. g. , average bitrate vs engagement? v Use only after confirming roughly linear relationship
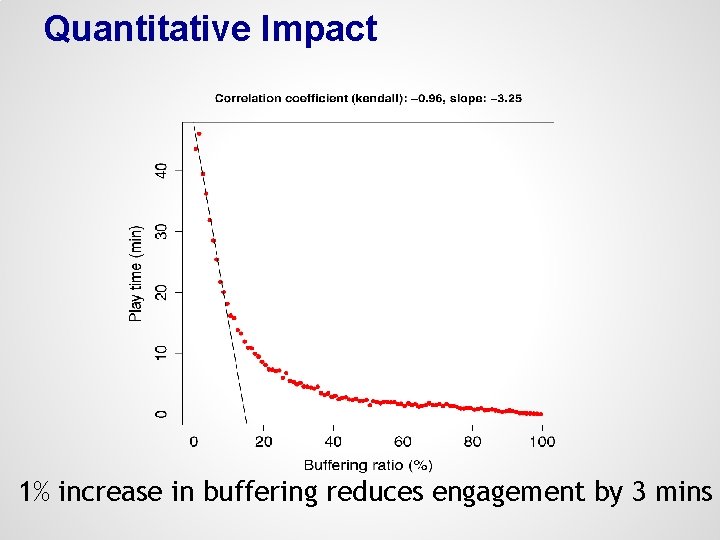
Quantitative Impact 1% increase in buffering reduces engagement by 3 mins
Viewer-level Join time is critical for user retention
Questions Analysis Techniques Which metrics matter most? (Binned) Kendall correlation Are metrics independent? Information gain How do we quantify the impact? Regression Is there a causal connection? QED
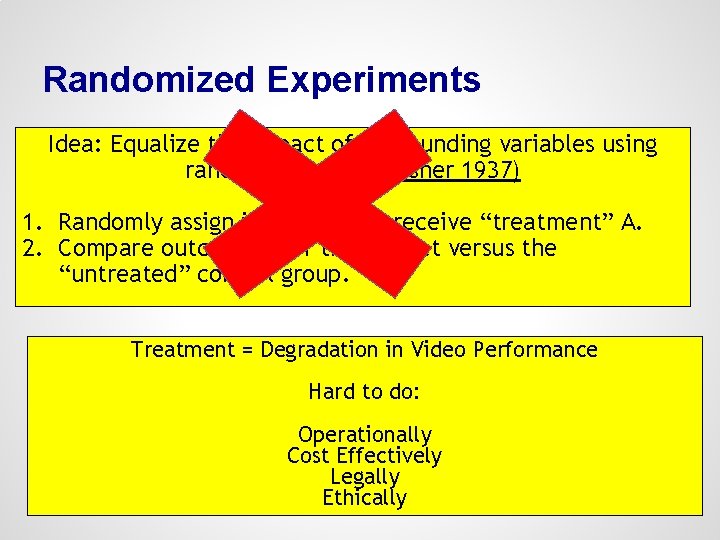
Randomized Experiments Idea: Equalize the impact of confounding variables using randomness. (R. A. Fisher 1937) 1. Randomly assign individuals to receive “treatment” A. 2. Compare outcome B for treated set versus the “untreated” control group. Treatment = Degradation in Video Performance Hard to do: Operationally Cost Effectively Legally Ethically
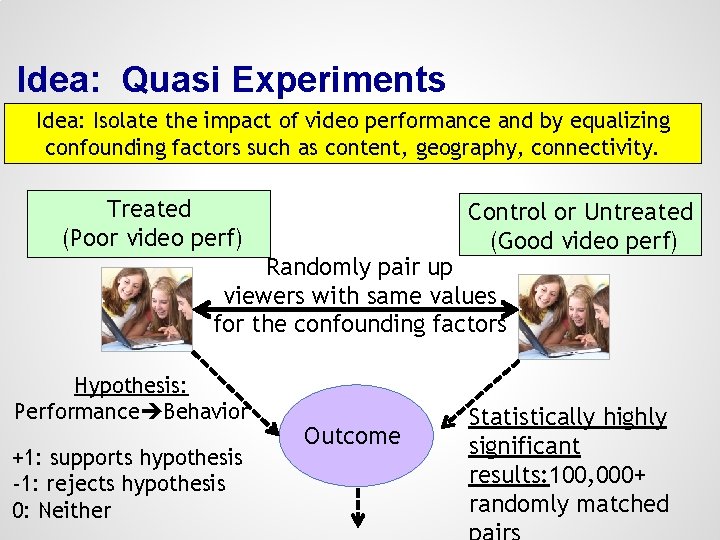
Idea: Quasi Experiments Idea: Isolate the impact of video performance and by equalizing confounding factors such as content, geography, connectivity. Treated (Poor video perf) Control or Untreated (Good video perf) Randomly pair up viewers with same values for the confounding factors Hypothesis: Performance Behavior +1: supports hypothesis -1: rejects hypothesis 0: Neither Outcome Statistically highly significant results: 100, 000+ randomly matched
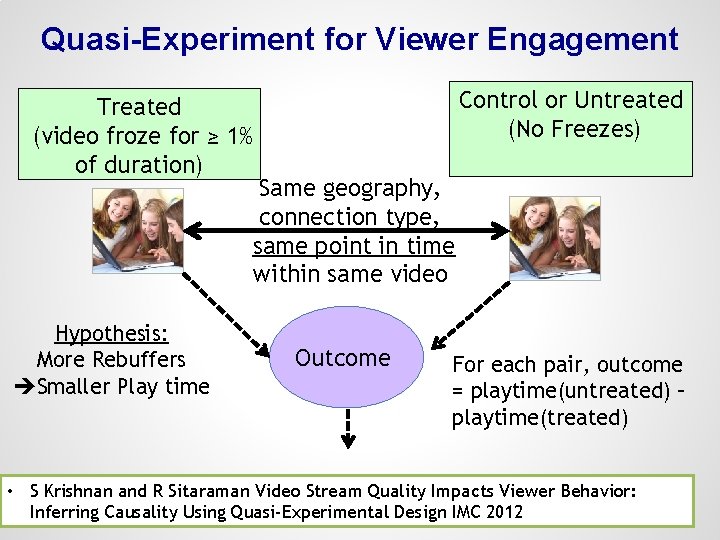
Quasi-Experiment for Viewer Engagement Control or Untreated (No Freezes) Treated (video froze for ≥ 1% of duration) Same geography, connection type, same point in time within same video Hypothesis: More Rebuffers Smaller Play time Outcome For each pair, outcome = playtime(untreated) – playtime(treated) • S Krishnan and R Sitaraman Video Stream Quality Impacts Viewer Behavior: Inferring Causality Using Quasi-Experimental Design IMC 2012
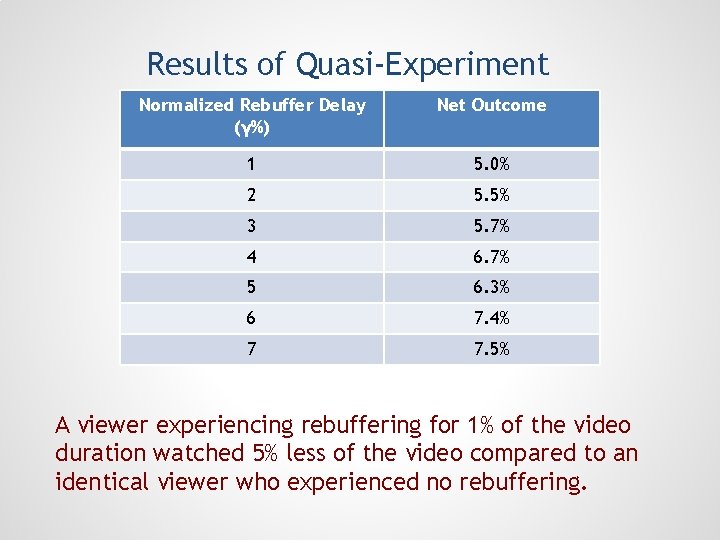
Results of Quasi-Experiment Normalized Rebuffer Delay (γ%) Net Outcome 1 5. 0% 2 5. 5% 3 5. 7% 4 6. 7% 5 6. 3% 6 7. 4% 7 7. 5% A viewer experiencing rebuffering for 1% of the video duration watched 5% less of the video compared to an identical viewer who experienced no rebuffering.
Are we done? Subjective Scores MOS Engagement (e. g. , Fraction of video viewed) Unified? Quantiative? Predictive? Objective Scores PSNR Join Time, Avg. bitrate, . . • A Balachandran et al A Quest for an Internet Video Qo. E Metric, Hot. Nets 2012
Engagement Challenge: Capture complex relationships Non-monotonic Quality Metric Engagement Average bitrate Threshold Rate of switching
Challenge: Capture interdependencies Join Time Rate of buffering Avg. bitrate Rate of switching Buffering Ratio
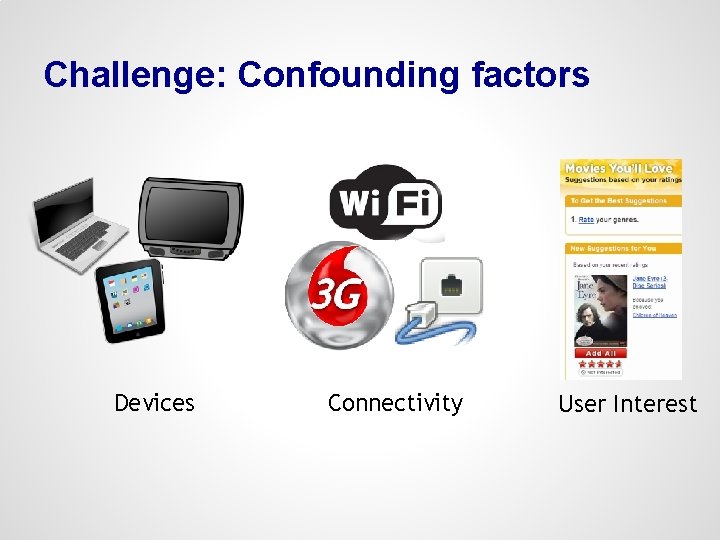
Challenge: Confounding factors Devices Connectivity User Interest
Some lessons…
Importance of systems context RQ is negative, but effect of player optimizations!
Need for multiple lenses Correlation alone can miss such interesting phenomena
Watch out for confounding factors v Lots of them! v due to user behaviors, v due to delivery system artifact v Need systematic frameworks v for identifying v. E. g. , Qo. E, learning techniques v For incorporating impacts v. E. g. , refined machine learning model
Useful references v Check out: http: //www. cs. cmu. edu/~internet-video For an updated bibliography