How does the population change as a country


 ‘so that’ I can explain")


- Slides: 18
How does the population change as a country develops? average number of years people live Life expectancy is the minimum False Birth rate is higher lower in more developed countries False GNI shows how much industry a country has True False Life expectancy The best single indicator to show quality of life is Death rate HDI is made up of GNI, life expectancy and years in school True If false change a word(s) in the statement to make it true
Direct Vocabulary Instruction Demographics The study of populations, their characteristics and how they change.
Learning aim: To understand the Demographic Transition model (DTM) ‘so that’ I can explain how and why population changes as a country develops I can use maths skills to calculate different rates of population growth I can use the DTM (population graph) to describe and explain differences in Birth, Death and population growth rates between LIC’s and HIC’s I can explain the link between economic development and falling death rates
If the birth rate is higher in a country than the death rate a countries population will naturally increase. Birth rates and death rates change as a country develops
Maths mastery - Try working out these rates of population increase or decrease Birth rate (per 1000 people per year) Death rate (per 1000 people per year) Population difference (per thousand people) Natural increase or decrease Percentage population increase (per year) Level of development 20 10 +10 Fast Increase 1% NEE 45 20 10 15 30 10 2% population growth in a year is considered very fast It would add an extra million people to a population of 50 million in one year STRETCH Decide whether the countries are LIC, NEE or HIC
Maths mastery - Try working out these rates of population increase or decrease Birth rate (per 1000 people per year) Death rate (per 1000 people per year) Population difference (per thousand people) Natural increase or decrease Percentage population increase (per year) Level of development 20 10 +10 Fast Increase 1% NEE 45 20 +25 Very fast 2. 5% LIC 10 10 0 No increase 0 HIC 10 15 -5 Slow decrease 0. 5% HIC 30 10 +20 Very fast 2% LIC 2% population growth in a year is considered very fast It would add an extra million people to a population of 50 million in one year STRETCH Decide whether the countries are LIC, NEE or HIC
Population growth and development The Demographic Transition model 1. Natural increase is the ______________ because ___________ are higher than __________ 1. The DTM shows how the _______ and the _______ change as a country develops. This affects the rate of _______growth of countries 2. LIC’s like Afghanistan have very ______ birth rates and ______ death rates so natural increase is _____ 2. There are ______ stages 3. NEE’s like Brazil have high but _____ birth rates and much lower _____ rates so natural increase in population is still ______ 4. HIC’s like the UK have _______ birth rates and _____ death rates so natural increase is _______ 5. The most developed HIC’s have ______ birth rates and _____ death rates due to old age so there is a natural ________ 3. LIC’s are in stage _______ NEE’s are in stage ______ HIC’s are in stages ______ and _______ 4. The graph shows that LIC’s have a birth rate of _____ per 1000 people. The graph shows that HIC’s have a birth rate of _____ per 1000 people 5. The graph shows that LIC’s have a death rate of _____ per 1000 people The graph shows that HIC’s have a death rate of _____ per 1000 people 6. LIC’s have a _____ birth rate of around _____ per 1000 people. As you become an NEE the birth rate _______ rapidly to around ____ per 1000 people. HIC’s have a _____ but _____ birth rate of around ____ per 1000 people.
Do you remember the key facts? LIC’s have very rapid population growth True HIC’s have high death rates False LIC’s have high birth rates True HIC’s have high birth rates False LIC’s have falling death rates True
LIC NEE HIC High Low 1. 2. 3. 4. 5. 6. What does the DTM show? How many stages are there? Which stages are LIC’s NEE’s and HIC’s in Use data from the graph to compare the birth rate between a LIC and a HIC Use data from the graph to compare the death rate between a LIC and HIC Describe the change in BR over the stages
1. Sketch out a simple DTM diagram or print the example on the next slide 2. Add these labels to the correct lines and stages (2 -5) of your DTM diagram Orange boxes = population growth line graph Blue boxes = death rate line graph Purple boxes = birth rate line graph Population growth stabilizes Population begins to grow Population Declines Rapid population growth Water, sanitation and healthcare services improve throughout the whole country Basic healthcare is improving but is still poor in rural areas An ageing population so death rate of old people increases Excellent healthcare and high standard of living People work in factories in cities so need less children Many children help with farm work Women have careers and have fewer children
Many children help with farm work Rapid population growth Population growth stabilizes Population Declines Basic healthcare is improving but is still poor in rural areas An ageing population so death rate of old people increases People work in factories in cities so need less children Population begins to growth Water, sanitation and healthcare services improve throughout the whole country Women have careers and have fewer children Excellent healthcare and high standard of living
Stage 2 – LIC Stage 3 NEE 1. Has a high birth rate 2. Has a falling birth rate 3. Has a low birth rate 4. People migrate to cities for work in factories 5. Most people are farmers 6. Many women have careers 7. Falling death rate 8. Low death rate 9. Many elderly people in population 10. Many young people in population 11. Healthcare improves 12. Excellent healthcare Stage 4 HIC
Stage 2 – LIC Stage 3 NEE Stage 4 HIC 1. Has a very high birth rate – Stage 2 2. Has a falling birth rate – Stage 3 3. Has a low birth rate – Stage 4 4. People migrate to cities for work in factories – Stage 3 5. Most people are farmers – Stage 2 6. Many women have careers – Stage 4 7. Rapidly falling death rate – Stage 3 8. Low death rate – Stage 4 9. Many elderly people in population – stage 4 10. Many young people in population – Stage 2 or 3 11. Healthcare improves – Stage 3 12. Excellent healthcare – stage 4
Recap - Employment structure as a country develops HIC Strong industry Most people work in well paid jobs in the tertiary industry providing services to wealthy people The is still a lot of secondary industry but it is reducing Most farming is done using machines so few work in primary NEE Growing economy There are less poor farmers who now work in factories LIC Weak economy Most people work in primary industry as poor farmers There is much more employment There is little secondary industry e. g. in secondary industry manufacturing goods to sell Tertiary industry grows as people can afford and use more services There is little money for tertiary services like healthcare
Explain why the birth rate changes as a country economically develops In LIC’s most people work in ______ because ___ The birth rate is ____ because _________ In NEE’s many people work in ______ because ___ The birth rate is ____ because _________ In HIC’s most people work in _____ because _______ The birth rate is _____ because _________
Explain why the birth rate changes as a country economically develops In LIC’s most people work in primary industry as poor farmers because the economy is weak, and there are few better paid jobs in secondary and tertiary industries. The birth rate is very high because families need many children to help with work on farms and do other jobs to feed and support the family. In NEE’s many people work in manufacturing because the economy is rapidly growing. Tertiary industry jobs also grow as a wealthier population can afford more services. The birth rate falls rapidly because people working in factories, or services in cities do not need to have such large families because they buy food rather than grow it. It is also harder to work and support a large family. In HIC’s most people work in tertiary industries because in wealthy countries people can afford many services, and the Government can also afford to provide services like the NHS. The birth rate is low because many women are interested in following careers rather than becoming married and having children. The average marriage in the UK is now over 30. Therefore less children are born.
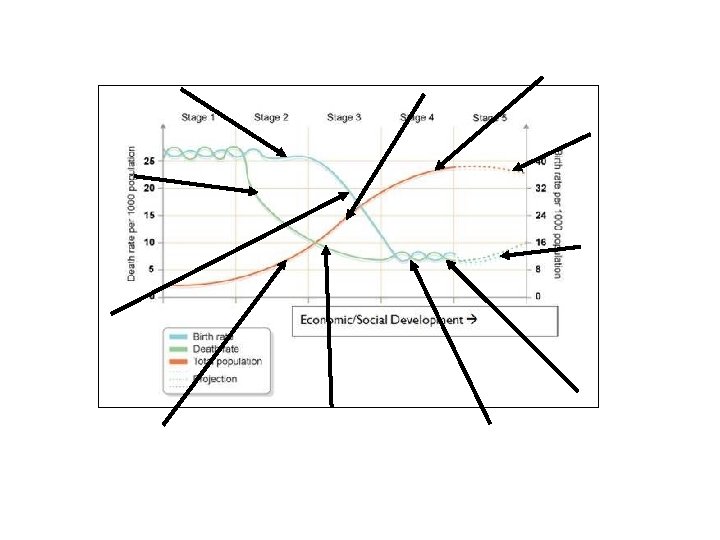
Population growth and development The Demographic Transition model Natural increase is the growth in a countries population because birth rates are higher than death rates 1. The DTM shows how the birth rate and the death rate change as a country develops. This affects the rate of population growth of countries LIC’s like Afghanistan have very high birth rates and falling death rates so natural increase is very high NEE’s like Brazil have high but falling birth rates and much lower death rates so natural increase in population is still high HIC’s like the UK have low birth areas and ; low death rates so natural increase is slow The most developed HIC’s have very low birth rates and rising death rates due to old age so there is a natural decrease 2. There are 5 stages 3. LIC’s are in stage 2 NEE’s are in stage 3 HIC’s are in stages 4 and 5 4. The graph shows that LIC’s have a birth rate of 40 per 1000 people. The graph shows that HIC’s have a birth rate of 12 per 1000 people 5. The graph shows that LIC’s have a death rate of 12 per 1000 people The graph shows that HIC’s have a death rate of 7 per 1000 people 6. LIC’s have a high birth rate of around 40 per 1000 people. As you become an NEE the birth rate drops rapidly to around 26 per 1000 people. HIC’s have a fluctuating but low birth rate of around 12 per 1000 people.