How Do We Construct Maps Using Isolines What


")


")


 gradient changes quickly and the isolines are close together. A gentle")


- Slides: 26
How Do We Construct Maps Using Isolines What are Isolines?
Isolines An isoline is a line connecting points of equal value.
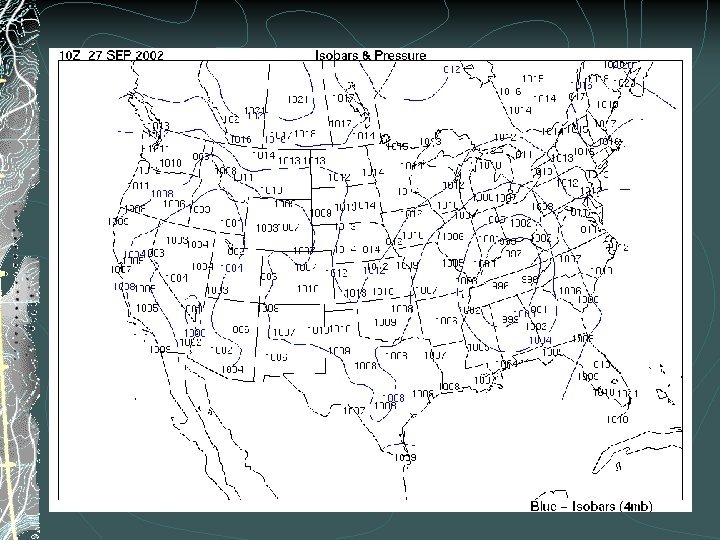
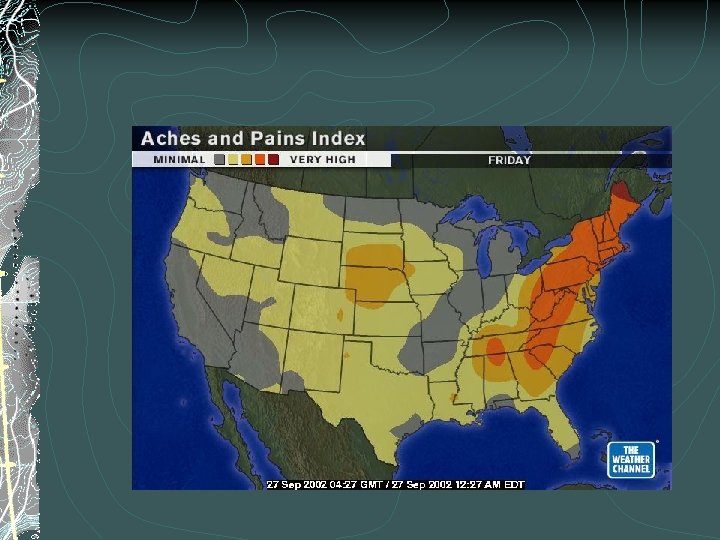
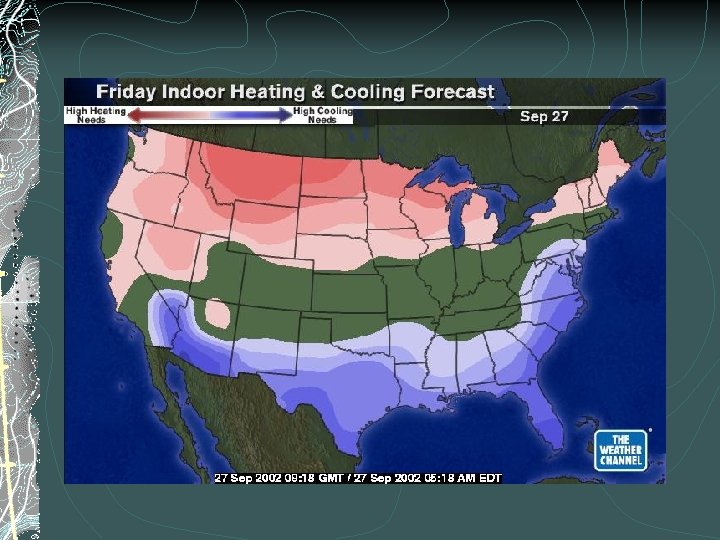
Examples of isolines: Isotherms: points of equal temperature Isobar: points of equal barometric (air) pressure Contour: points of equal altitude Anything else you can get a value for. (The weather channel loves isolines!)
Rules for Drawing Isolines: 1. Isolines connect points of equal value. 5 5 10 10 10 15 15
2. Isolines are gentle, curving lines- no sharp corners. 5 5 10 10 10 15 15
3. Isolines are always closed curves even though the map might only show part of it.
4. Isolines NEVER cross - this would mean that one point has two different values. Ex: one spot has two temperatures? 40 ° 50 ° 30 ° 60 ° X 20° Y Z
5. Isolines usually are parallel. (They have a parallel trend. )
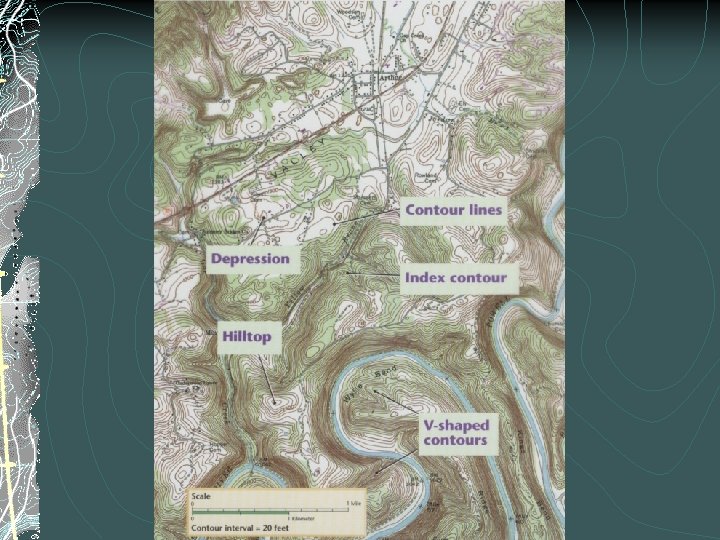
6. On a field map, isolines that cross a stream make a V-shape. The Vs always point upstream. In the diagram below, the Vs point toward the northeast. This means the stream is flowing to the southwest. N
Visualizations of contour lines http: //geology. asu. edu/~sreynolds/topo_ gallery/topo_gallery. htm
Gradient shows how quickly the value changes from one point to another.
A steep (high) gradient changes quickly and the isolines are close together. A gentle (low) gradient changes slowly and the lines are far apart. Steep area Gentle area
Making Contours worksheets Worksheets can be printed from: http: //www. rcmurphy. net/Medina%2020 05/documents/Contours 123. doc
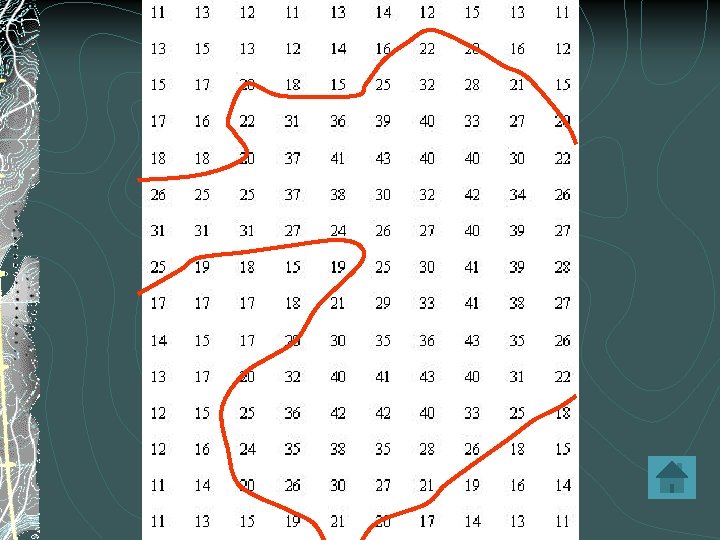
• Find the 60 data points; • Connect all 60 value data points.
Highlight data points.
Fill in gaps in data.
Connect the dots.
Go on to the next value.
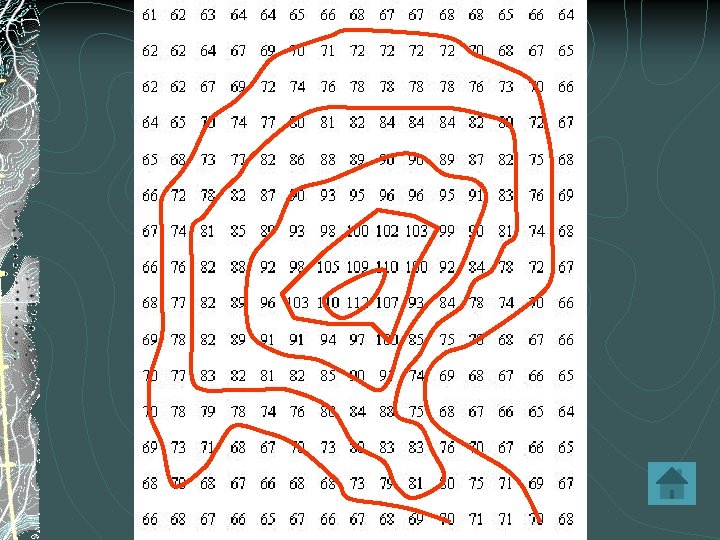
Making a Contour Map II
Drawing Contour Maps III