How Carbon Intensity Effects Kaya Population 2014 Population

How Carbon Intensity Effects Kaya

Population

2014 Population Growth Rates • USA: . 77 Definition: The average annual percent change in the population, resulting from a surplus (or deficit) of births over deaths and the balance of migrants entering and leaving a country. The rate may be positive or negative. The growth rate is a factor in determining how great a burden would be imposed on a country by the changing needs of its people for infrastructure (e. g. , schools, hospitals, housing, roads), resources (e. g. , food, water, electricity), and jobs. Rapid population growth can be seen as threatening by neighboring countries. Source: CIA World Factbook - Unless otherwise noted, information in this page is accurate as of January 1, 2014

GDP/Population • Luxembourg-10. 27 x world • United states- 5. 02 x world http: //statisticstimes. com/economy/world-gdp-capita-ranking. php Source: International Monetary Fund World Economic Outlook

GDP/Population • Affluence- average consumption of each person in the population • It is assumed that as the GDP increases, consumption of good/services/energy will increase http: //statisticstimes. com/economy/world-gdp-capita-ranking. php http: //www. imf. org/external/pubs/ft/weo/2015/01/weodata

Energy/GDP • The energy intensity required to produce a unit of GDP is falling in most countries of the world • China GDP grew by about 10% a year between 1980 and 2005, while energy use grew by a little less than 6% per year • Between 2005 and 2010, real GDP continued to grow by about 10% per year, while energy use grew by about 7. 5% per year • Up until 2005, the USA was able to increase real GDP by 3% per year, while increasing energy use by only 1% per year

CO 2/Energy • The amount of carbon by weight emitted per unit of energy consumed • Can be decomposed into fossil and non-fossil shares, and emissions can be expressed as carbon emissions per unit of fossil energy • Scott can you explain how they calculate this?

2014 IPCC

CO 2 e/k. Wh of various energy systems lbs. CO 2 e/k. Wh • Natural Gas: 0. 6 -2 • Coal: 1. 4 -3. 6 lbs. • Wind 0. 02 to 0. 04 • Solar 0. 07 to 0. 2 • Geothermal 0. 1 to 0. 2 Source: IPCC, 2011: IPCC Special Report on Renewable Energy Sources and Climate Change Mitigation

Decarbonization • Declining average carbon intensity of primary energy over time • Figure 2 -11 shows rate of 0. 3% per year decline • Global rate is decreasing but in some countries carbon intensity is increasing • Median scenarios indicate rate of 1. 1% • most intensive uses of fossil fuels lead to no reduction • Highest decarbonization rate of 2. 5% per year indicate complete transition to non fossil fuels Figure 2 -11: Global decarbonization of primary energy - historical development and future scenarios, shown as an index (1990 = 1). The median (50 th), 5 th, 25 th, 75 th and 95 th percentiles of the frequency distribution are shown. Statistics associated with scenarios from the literature do not imply probability of occurrence. Data source: Nakicenovic, 1996; Morita and Lee, 1998. http: //www. ipcc. ch/ipccreports/sres/emission/index. php? idp=46
 CO 2 emissions: 6% lower")
Kaya Identity • • TPES (Total Primary Energy Supply) CO 2 emissions: 6% lower in 2013 than 1990 Carbon intensity: declined 8* • • • CO 2 emissions almost tripled +137% GDP/population +42% population growth C intensity increase due to increased Coal use

Kaya Identity • OECD 90 - Organization for Economic Cooperation and Development • FSU- former USSR • ALM+ASIA-Developing countries • World- Self explanatory • Global CO 2 emissions since the middle of the 19 th century are estimated to have increased by approximately 1. 7% per year • • 1% growth in population and a 2% growth in per capita income Subtract the 1% per year decline energy intensity of world GDP and decrease of 0. 3% of carbon intensity • Important note: • • Developed countries population has been steady while emissions evolved with GDP For Developing countries both population and income growth appear as important drivers of emissions Figure 3 -1: Historical trends in energy-related CO 2 emissions ("carbon emissions" shown as bold gray line) and broken down into the components of emission growth: growth or declines of population, gross domestic product (GDP) at purchasing power parities (PPPs), energy use per unit of GDP (Energy/GDP), share of renewables in energy use (Renewable energy/Energy), and carbon intensity per fossil energy (Carbon/Fossil energy) since 1970, in million tons elemental carbon (Mt. C). From top to bottom: Organization for Economic Cooperation and Development (OECD 90, countries that belong to the OECD as of 1990), former USSR (FSU), Developing Countries (ASIA and Africa, Latin America and the Middle East (ALM)), and World. Source: G�rer and Ban, 1997.

Kaya Identity https: //www. iea. org/publications/freepublications/publication /CO 2 Emissions. From. Fuel. Combustion. Highlights 2015. pdf

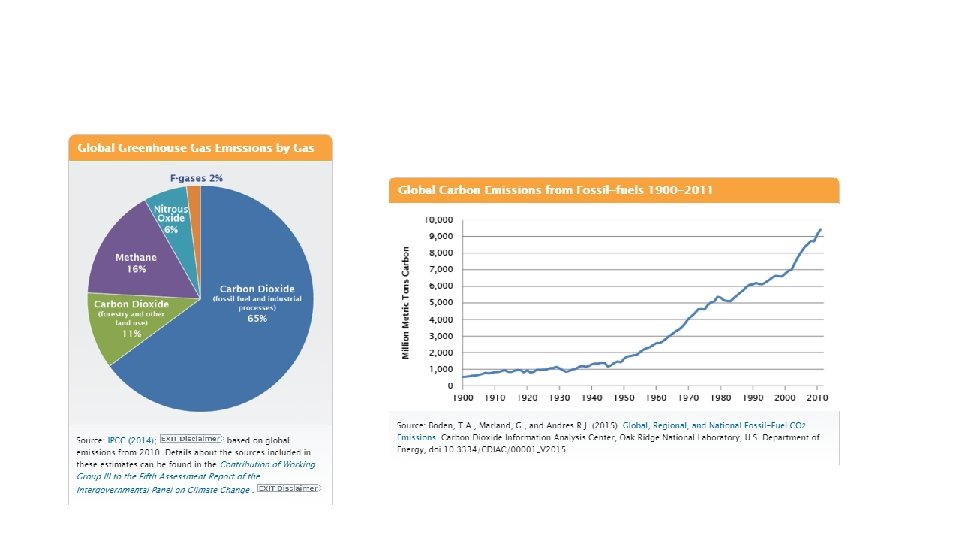
Global GHG’s • 25% burning of coal, natural gas, and oil • 21% Industrial – primarily from on site burning of fossil fuels for facilities energy • 14% transportation – 95% of energy used for transportation is petroleum based • 10% other energy - emissions from the energy sector not directly associated with electricity or heat production, such as fuel extraction, refining, processing • 6% buildings - on-site energy generation and burning fuels for heat in buildings or cooking in homes • 76% of GHG’s primarily from burning of fossil fuels

Who are the bad boys • Give me the top 10 cumulative emitters of CO 2 from 1850 -present • EU grouped as 1 emitter

World CO 2 Emitters

Case Study: United States - CO 2/Energy Consumption is 8. 2% lower than 1990 levels https: //www 3. epa. gov/climatechange/Downloads/ghgemissions/US-GHG-Inventory-2016 -Chapter-3 Energy. pdf - Energy Consumption and CO 2/GDP - Shift from a manufacturing economy to a service-based economy, increases in efficiency, energy consumption and energyrelated CO 2 emissions per dollar of gross domestic product (GDP) have both declined since 1990

United States Total U. S. Greenhouse Gas Emissions by Economic Sector in 2013 • 81% produced by fossil fuels

United States GHG Inventory file: ///C: /Users/Grant/App. Data/Local/Microsoft/Windows/INet. Cac he/IE/5 ZWUJAWS/US-GHG-Inventory-2016 -Chapter-3 -Energy. pdf

file: ///C: /Users/Grant/App. Data/Local/Microsoft/Windows/INet. Cache/IE/5 ZWUJAWS/US-GHG-Inventory-2016 Chapter-3 -Energy. pdf
- Slides: 21