How can we use the normal distribution curve
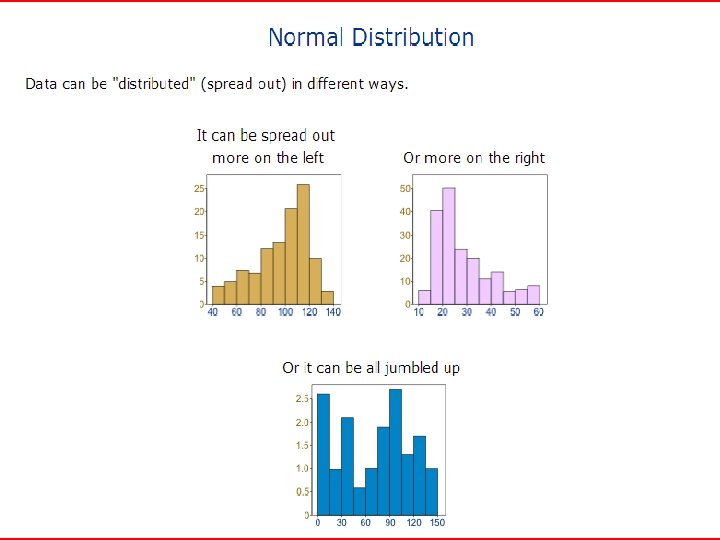
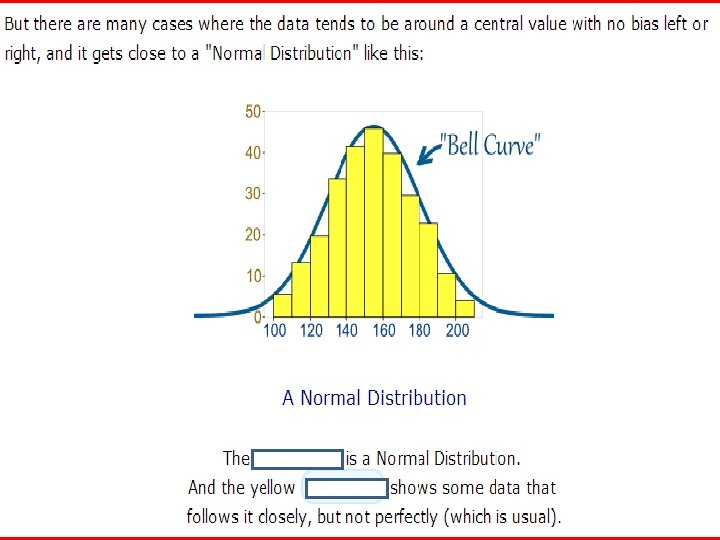
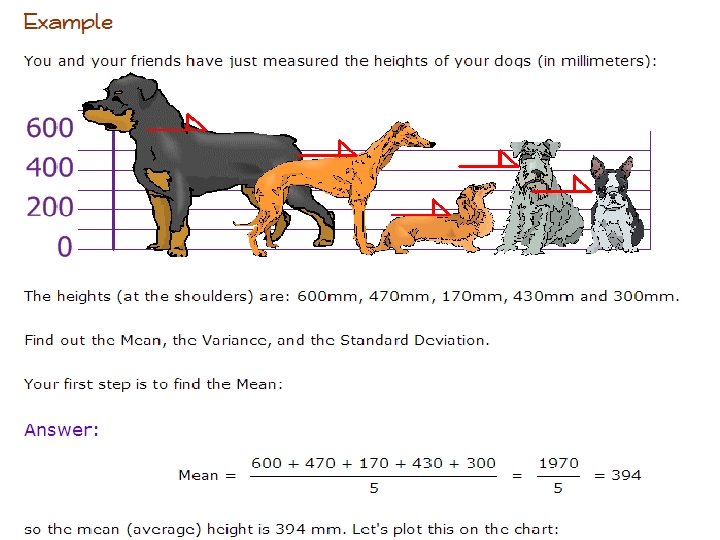

How can we use the normal distribution curve to find percentages and amounts?

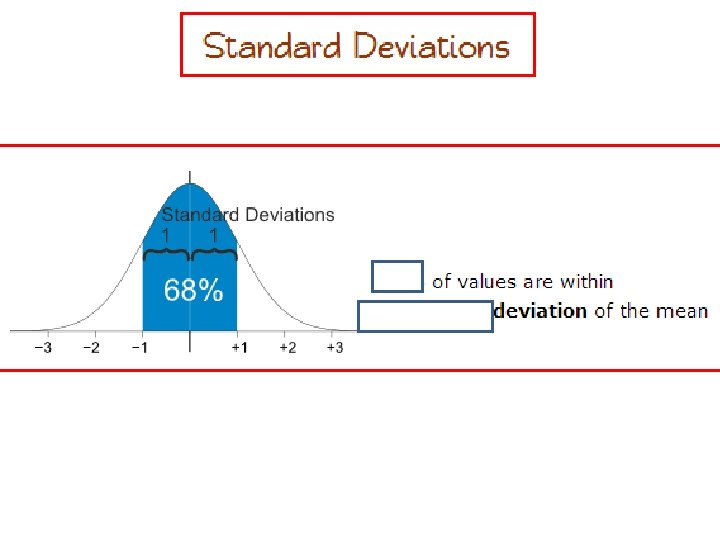
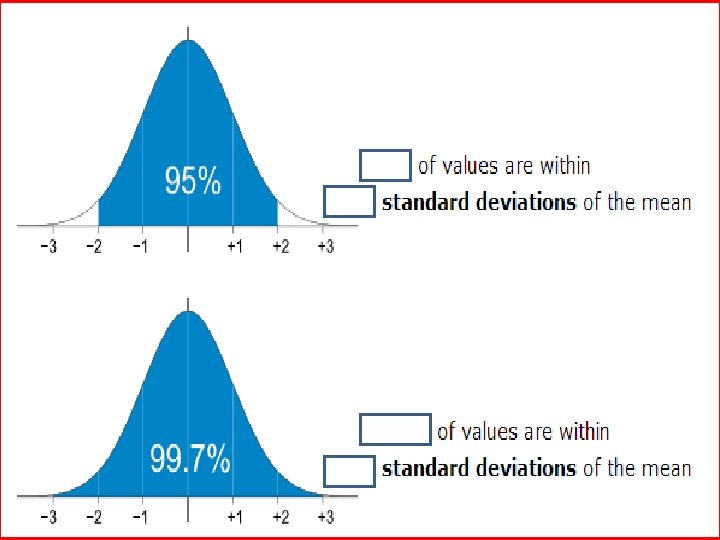
The Standard Deviation percentages can be broken into smaller percentage parts On the 5 th slide you saw the one standard deviation above and below the mean contained 68% of the data. Two standard deviations above and below the mean contained 95% of the data. And three standard deviations above and below the mean contained 99. 7% of the data.

Each percentage can be broken into smaller parts. What is left is 68% be 34% can for each broken into 2 for onlypart 15% parts each standard deviation. . 95% can be broken into 4 parts 99. 7% can nd be broken into 6 parts for the rd 2 standard deviation for the 3 standard deviation

In a normal distribution, what percent of the values lie: 1. below the mean? ______ 2. above the mean? ______ 3. within one standard deviation of the mean? ______ 4. within two standard deviations of the mean? ______ 5. within three standard deviations of the mean? _____

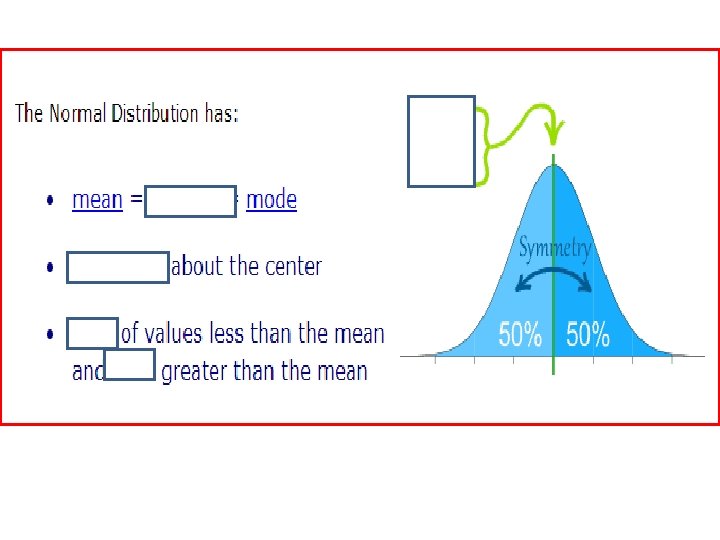
In a normal distribution, what percent of the values lie: 1. below the mean? The mean is ½ of the curve, so it is 50%

The mean is ½ of the curve, so it is 50%

In a normal distribution, what percent of the values lie: 3. within one standard deviation of the mean? ______ Add the percent's between -1σ and +1 σ : 34% +34% = 68%

In a normal distribution, what percent of the values lie: 4. within two standard deviations of the mean? ______ Add the percent's between -2σ and +2 σ : 13. 5% + 34% +34% = 95%

In a normal distribution, what percent of the values lie: 5. within three standard deviations of the mean? _____ Add the percent's between -3σ and +3σ : 2. 35% + 13. 5% + 34% +34% = 99. 7%

2000 freshmen at State University took a biology test. The scores were distributed normally with a mean of 70 and a standard deviation of 5. Label the mean and three standard deviations from the mean. Mean = 70 --3σ 55 -2 σ -1 σ 0 60 65 μ = 70 1σ 2σ 75 80 3σ 85

2000 freshmen at State University took a biology test. The scores were distributed normally with a mean of 70 and a standard deviation of 5. Answer the following questions based on the data: a) What percentage of scores are between scores 65 and 75? b) What percentage of scores are between scores 60 and 70? c) What percentage of scores are between scores 60 and 85? d) What percentage of scores is less than a score of 55? e) What percentage of scores is greater than a score of 80? f) Approximately how many biology students scored between 60 and 70? g) Approximately how many biology students scored between 55 and 60?

2000 freshmen at State University took a biology test. The scores were distributed normally with a mean of 70 and a standard deviation of 5. a) What percentage of scores are between scores 65 and 75? 1 st fill in the mean and amounts on the x-axis 2 nd put in your percentages and scores 3 rd locate 65 and 75 4 th add the percentages between those two numbers: 34% + 34% = 68% 34% 2. 35%-2. 15%--3σ 55 σ 60 13. 5% 34% 13. 5% -1 σ 0 1σ 2 σ2. 35% 3 σ 65 μ = 70 75 80 . 15% 85

1 st fill in the mean and amounts on the x-axis 2 nd put in your percentages and scores 3 rd locate 60 and 70 4 th add the percentages between those two numbers: 13. 5% + 34% = 47. 5% 34% 2. 35%-2. 15%--3σ 55 σ 60 13. 5% 34% 13. 5% -1 σ 0 1σ 2 σ2. 35% 3 σ 65 μ = 70 75 80 . 15% 85

1 st fill in the mean and amounts on the x-axis 2 nd put in your percentages and scores 3 rd locate 60 and 85 4 th add the percentages between those two numbers: 13. 5% + 34% + 13. 5% = 95% 34% 2. 35%-2. 15%--3σ 55 σ 60 13. 5% 34% 13. 5% -1 σ 0 1σ 2 σ2. 35% 3 σ 65 μ = 70 75 80 . 15% 85

1 st fill in the mean and amounts on the x-axis 2 nd put in your percentages and scores 3 rd locate 55 4 th look at how much is below 55: . 15% 34% 2. 35%-2. 15%--3σ 55 σ 60 13. 5% 34% 13. 5% -1 σ 0 1σ 2 σ2. 35% 3 σ 65 μ = 70 75 80 . 15% 85

1 st fill in the mean and amounts on the x-axis 2 nd put in your percentages and scores 3 rd locate 80 4 th add the percentages above 80: 13. 5% + 2. 35% = 2. 5% 34% 2. 35%-2. 15%--3σ 55 σ 60 13. 5% 34% 13. 5% -1 σ 0 1σ 2 σ2. 35% 3 σ 65 μ = 70 75 80 . 15% 85
 Approximately how many biology students scored between 60 and 70? 1 st fill")
f) Approximately how many biology students scored between 60 and 70? 1 st fill in the mean and amounts on the x-axis 2 nd put in your percentages and scores 3 rd locate 60 and 70 4 th add the percentages between those two numbers: 13. 5% + 34% = 47. 5% 5 th change the percent to a decimal: . 475 (move decimal over 2 places 6 th multiply the % by how many students there are: . 475% * 2000 = 950. 34% 2. 35%-2. 15%--3σ 55 σ 60 13. 5% 34% 13. 5% -1 σ 0 1σ 2 σ2. 35% 3 σ 65 μ = 70 75 80 . 15% 85
 Approximately how many biology students scored between 55 and 60? st 1 fill")
g) Approximately how many biology students scored between 55 and 60? st 1 fill in the mean and amounts on the x-axis 2 nd put in your percentages and scores 3 rd locate 55 and 60 4 th add the percentages between those two numbers: 13. 5% + 2. 35% = 15. 85% 5 th change the percent to a decimal: . 1585 (move decimal over 2 places) 6 th multiply the % by how many students there are: . 1585% * 2000 = 317. 34% 2. 35%-2. 15%--3σ 55 σ 60 13. 5% 34% 13. 5% -1 σ 0 1σ 2 σ2. 35% 3 σ 65 μ = 70 75 80 . 15% 85

500 juniors at Central High School took the ACT last year. The scores were distributed normally with a mean of 24 and a standard deviation of 4. Label the mean and three standard deviations from the mean. a) What percentage of scores is less than a score of 12? b) What percentage of scores is greater than a score of 24? c) Approximately how many juniors scored between 24 and 28? d) Approximately how many juniors scored between 20 and 28? e) Approximately how many juniors scored between 24 and 32? f) Approximately how many juniors scored between 16 and 20? g) Approximately how many juniors scored higher than 32?
 What percentage of scores is less than a score of 12? . 15%")
a) What percentage of scores is less than a score of 12? . 15% b) What percentage of scores is greater than a score of 24? 34% + 13. 5% + 2. 35% +. 15% = 50% c) Approximately how many juniors scored between 24 and 28? 34% =. 34 * 500 = 170 34% 2. 35%-2. 15%--3σ 12 σ 16 13. 5% 34% 13. 5% -1 σ 0 1σ 2 σ2. 35% 3 σ 20 μ = 24 28 32 . 15% 36
 Approximately how many juniors scored between 20 and 28? . 68 * 500")
d) Approximately how many juniors scored between 20 and 28? . 68 * 500 = 340 34% =. 34; . 34+. 34=. 68 e) Approximately how many juniors scored between 24 and 32? 34% =. 34; 13. 5% =. 135; . 34+. 135=. 475 * 500 = 237. 5 f) Approximately how many juniors scored between 16 and 20? 13. 5% =. 135; . 135 * 500 = 67. 5 34% 2. 35%-2. 15%--3σ 12 σ 16 13. 5% 34% 13. 5% -1 σ 0 1σ 2 σ2. 35% 3 σ 20 μ = 24 28 32 . 15% 36
 Approximately how many juniors scored higher than 32? 2. 35% =. 235; .")
g) Approximately how many juniors scored higher than 32? 2. 35% =. 235; . 15% =. 0015 . 235 +. 0015 =. 2365*500 = 118. 25 34% 2. 35%-2. 15%--3σ 12 σ 16 13. 5% 34% 13. 5% -1 σ 0 1σ 2 σ2. 35% 3 σ 20 μ = 24 28 32 . 15% 36
- Slides: 46