How can school performance be improved Relationship between

How can school performance be improved?

Relationship between learning outcomes and enrollment Crouch and Vinjevold, 2006
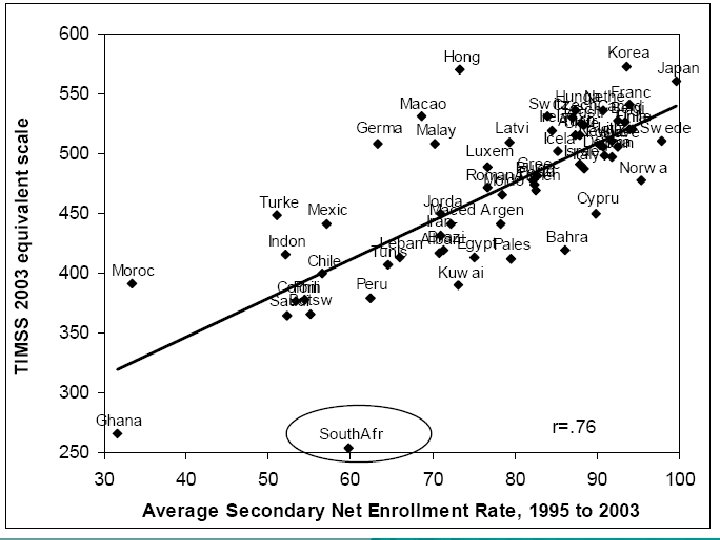

Access to secondary education: secondary gross enrollment ratios, Crouch & Vinjevold, 2006

What good schools do REGULATORY FUNCTION: u u u Orderly environment Intellectual activity valued Sense of responsibility INSTRUCTIONAL FUNCTION: u u u Proficiency in LOI Reading & writing Proficiency in specific discipline: Maths, History, Literature

SA High Schools Former Other Prop HG M of SC total 2004 7% 66% Top 380 34 Mod 254 573 14% 19% Poor 600 4277 79% 15%

SACMEQ mean maths score by quintile vd Berg & Louw, 2006 Quintile 1 2 3 4 5 Total Botswana 490. 57 499. 01 510. 21 508. 05 556. 62 490. 57 Kenya 540. 04 545. 23 555. 48 564. 92 610. 82 540. 04 Lesotho 443. 30 448. 09 447. 56 445. 19 451. 75 443. 30 Malawi 422. 44 426. 81 435. 32 433. 23 446. 84 422. 44 Mauritius 519. 33 564. 17 587. 07 619. 93 639. 55 519. 33 Mozambique 526. 43 524. 93 530. 59 530. 15 538. 18 526. 43 Namibia 403. 32 402. 41 411. 19 425. 08 512. 70 403. 32 Seychelles 520. 83 541. 04 555. 32 575. 84 578. 71 520. 83 South Africa 441. 84 444. 74 454. 18 491. 47 596. 97 441. 84 Swaziland 505. 56 511. 29 510. 92 513. 43 541. 48 505. 56 Tanzania 484. 29 511. 44 528. 54 527. 62 560. 14 484. 29 Uganda 484. 43 497. 07 497. 88 508. 74 543. 11 484. 43 Zambia 414. 20 425. 74 435. 61 434. 33 466. 10 414. 20 Zanzibar 478. 02 471. 62 477. 89 478. 68 484. 39 478. 02 Total 468. 13 479. 59 485. 13 491. 99 559. 53 468. 13 Non-SA 469. 09 480. 13 488. 01 494. 35 557. 25 469. 09

Top Performing Schools u What do they need? – Where African numbers are small: u Incentives to increase African roll – Where African numbers are large: u u Subsidies for poor children All: – Increase level of cognitive demand of curriculum

Moderately Performing Schools: What makes the Difference? Factors Home District School Class Language Speak LOI ** Policy Develop proficiency Time Sign h/w ** Monitor Regulate ** Micro-pace ** Coverage Assist with Monitor h/w * * Plan, monitor ** Macropace **** Reading & Writing Read * Distribute books Manage books *** Read & write * Assessmt Monitor results QA Monitor QA, monitor * Assess, feedback **

Key lever 1: Time on Task Chisholm et al, 2005 • Teachers work an average 41 hours (out of 43)/week • 41% of this on teaching: 3. 4 h/day • 14% devoted to planning and preparation, • 14% on assessment, evaluation, reports and record-keeping

Key lever 2: Curriculum Coverage 3: ¾ or more ASs completed during year 2: Between ½ and ¾ of ASs completed 1: Between ¼ and ½ 0: Less than ¼ covered

Key lever 3: Teacher Knowledge Grade 3 teachers wrote parts of the Grade 6 learner test: u u Literacy: 55% Numeracy: 65%

SA High Schools Former Other Prop HG M of SC total 2004 7% 66% Top 380 34 Mod 254 573 14% 19% Poor 600 4277 79% 15%

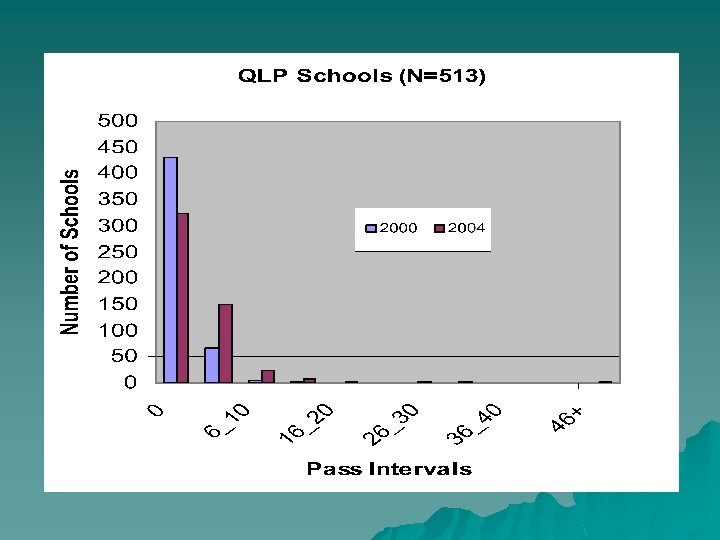
524 QLP schools > Control Pass Exp E HG M SG Rate +17 +36 +62 +924 +0. 7 +8

Poorly performing schools Start with Time Management u u Part of institutional culture Leadership Organisational development ≠ training BUT provinces & districts too weak

Differentiated approach Top performing schools Raise level of cognitive demand Schools with Threshold Capacity Eg Dinaledi II • Training • Resources • Incentives Dysfunctional Schools Organisational development State authority But weak state


Why is our civil service so inefficient? They went to poorly performing schools u Structural instability u Ideology: threw out authority with authoritarianism u Unions better organised u Lack of focus, eg matric exams u
- Slides: 19