
How big is the representation gap Cees van
How big is the representation gap? Cees van der Eijk University of Nottingham www. britishelectionstudy. com
Democratic representation Adequate representation requires that electoral ‘supply’ (the parties on the ballot) covers electoral ‘demand’ (what citizens want). Thus, citizens who do not recognise their views in any of the parties on offer are not well represented. The proportion of such citizens indicates the extent of a possible ‘representation deficit’. Is there such a deficit in Britain, and how large is it? www. britishelectionstudy. com
How do we measure this? We use so-called ‘propensity to vote’ indicators (PTVs) using the following survey question: “How likely is it that you would ever vote for each of the following parties? ” Conservatives / Labour / Liberal Democrats / SNP (only in Scotland) / Plaid Cymru (only in Wales) / UKIP / Greens / BNP Responses expressed on scale from 0 to 10. Data are from BESIP June 2014. www. britishelectionstudy. com
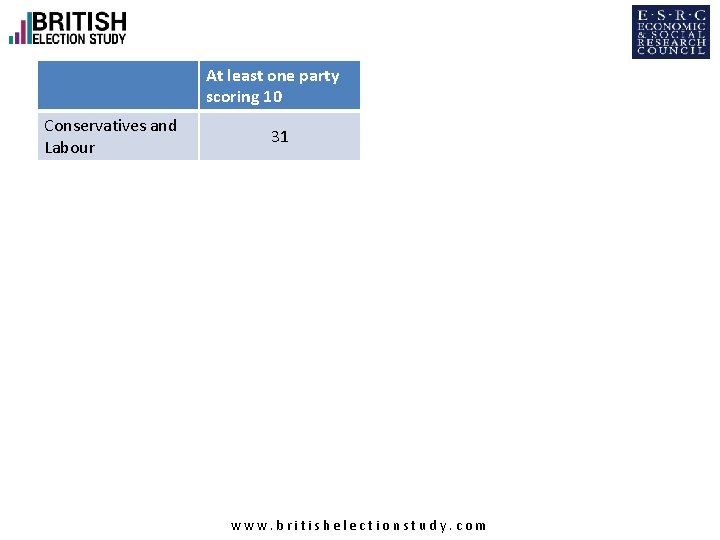
At least one party scoring 10 Conservatives and Labour 31 www. britishelectionstudy. com
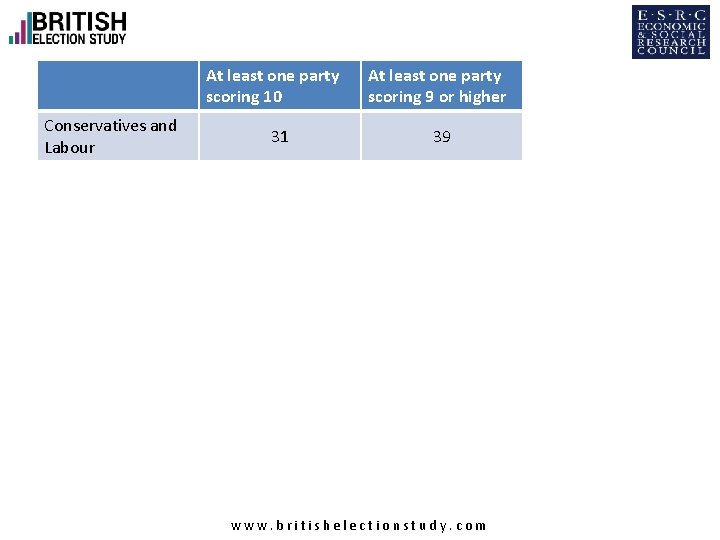
At least one party scoring 10 Conservatives and Labour 31 At least one party scoring 9 or higher 39 www. britishelectionstudy. com
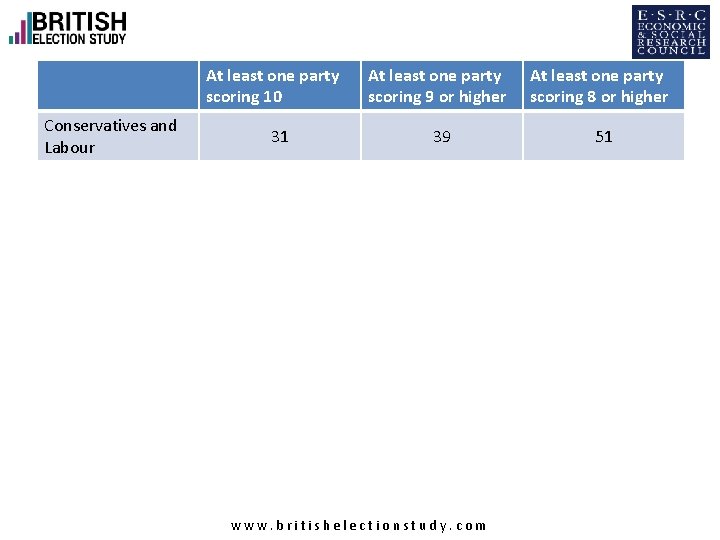
At least one party scoring 10 Conservatives and Labour 31 At least one party scoring 9 or higher At least one party scoring 8 or higher 39 51 www. britishelectionstudy. com
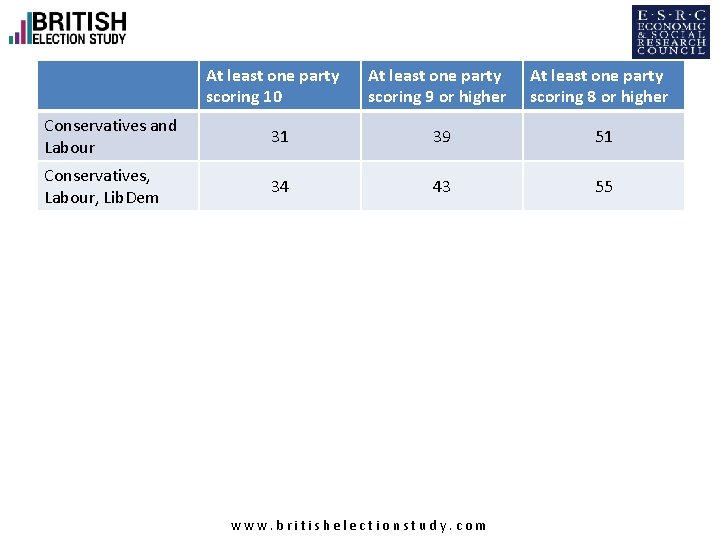
At least one party scoring 10 At least one party scoring 9 or higher At least one party scoring 8 or higher Conservatives and Labour 31 39 51 Conservatives, Labour, Lib. Dem 34 43 55 www. britishelectionstudy. com
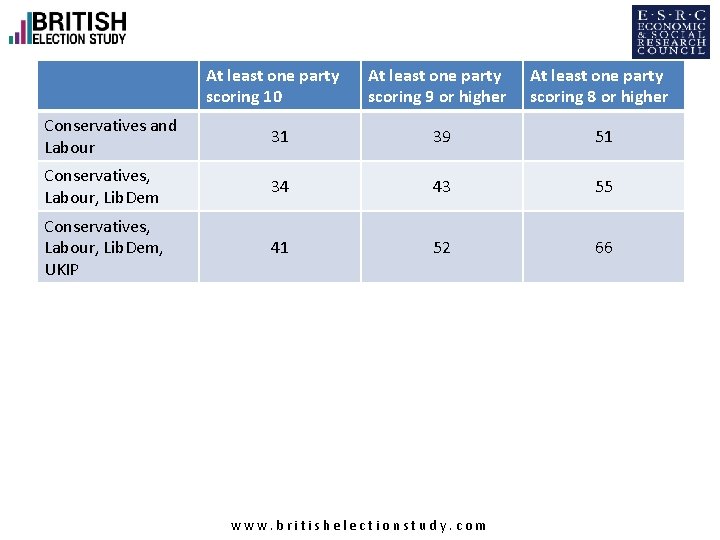
At least one party scoring 10 At least one party scoring 9 or higher At least one party scoring 8 or higher Conservatives and Labour 31 39 51 Conservatives, Labour, Lib. Dem 34 43 55 Conservatives, Labour, Lib. Dem, UKIP 41 52 66 www. britishelectionstudy. com
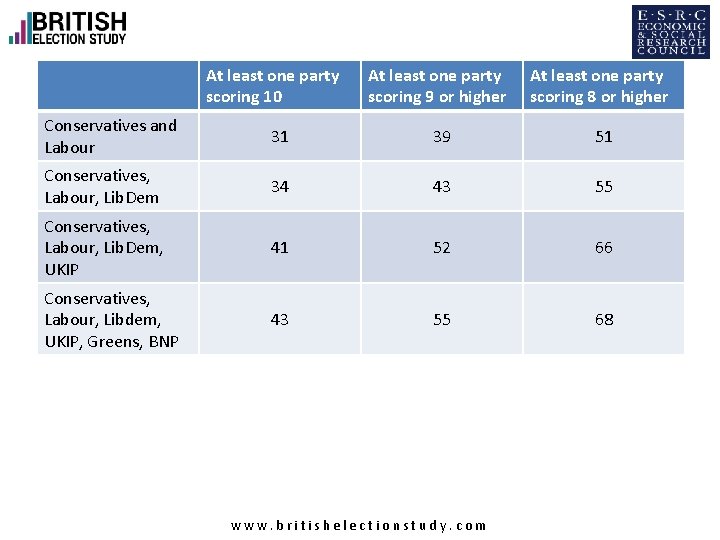
At least one party scoring 10 At least one party scoring 9 or higher At least one party scoring 8 or higher Conservatives and Labour 31 39 51 Conservatives, Labour, Lib. Dem 34 43 55 Conservatives, Labour, Lib. Dem, UKIP 41 52 66 Conservatives, Labour, Libdem, UKIP, Greens, BNP 43 55 68 www. britishelectionstudy. com
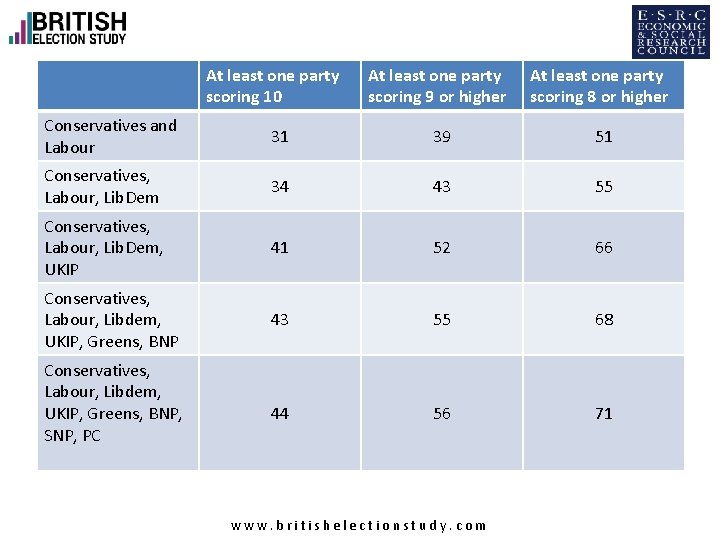
At least one party scoring 10 At least one party scoring 9 or higher At least one party scoring 8 or higher Conservatives and Labour 31 39 51 Conservatives, Labour, Lib. Dem 34 43 55 Conservatives, Labour, Lib. Dem, UKIP 41 52 66 Conservatives, Labour, Libdem, UKIP, Greens, BNP 43 55 68 44 56 71 Conservatives, Labour, Libdem, UKIP, Greens, BNP, SNP, PC www. britishelectionstudy. com
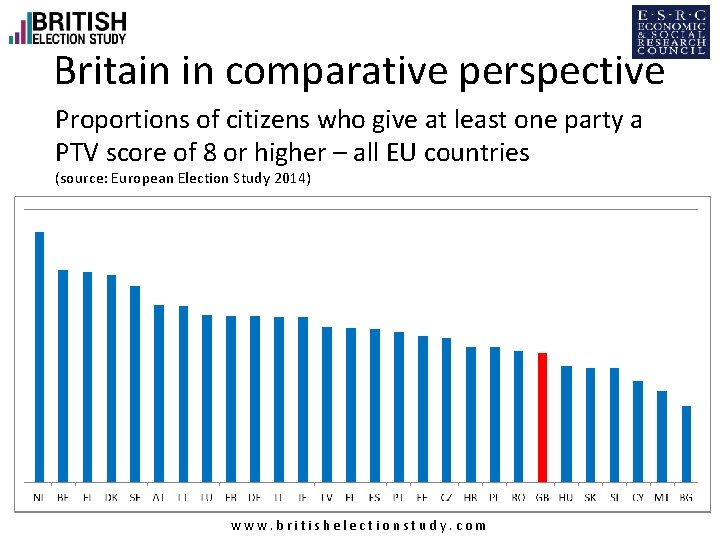
Britain in comparative perspective Proportions of citizens who give at least one party a PTV score of 8 or higher – all EU countries (source: European Election Study 2014) www. britishelectionstudy. com
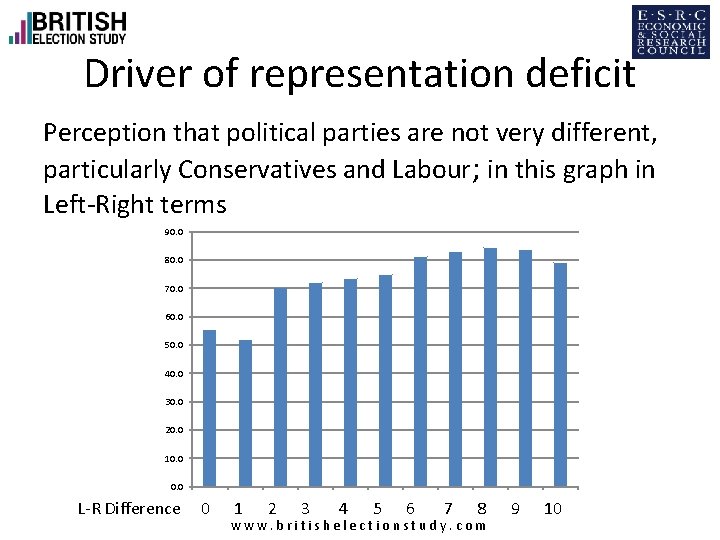
Driver of representation deficit Perception that political parties are not very different, particularly Conservatives and Labour; in this graph in Left-Right terms 90. 0 80. 0 70. 0 60. 0 50. 0 40. 0 30. 0 20. 0 10. 0 L-R Difference 0 1 2 3 4 5 6 7 8 www. britishelectionstudy. com 9 10
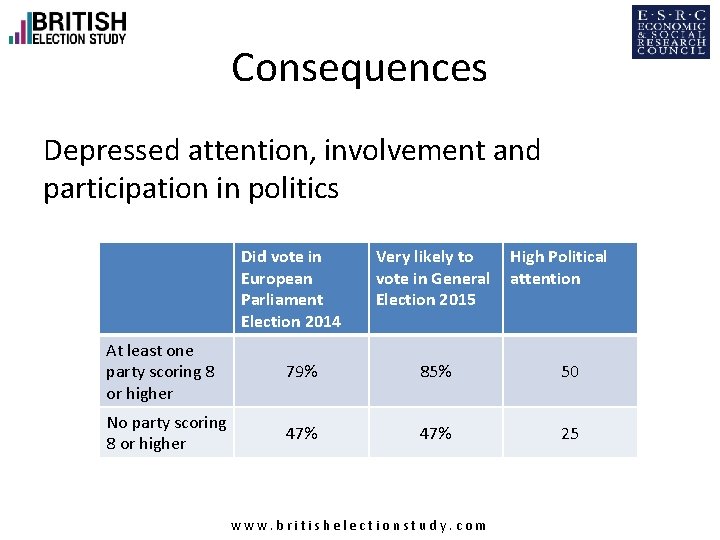
Consequences Depressed attention, involvement and participation in politics Did vote in European Parliament Election 2014 Very likely to vote in General Election 2015 High Political attention At least one party scoring 8 or higher 79% 85% 50 No party scoring 8 or higher 47% 25 www. britishelectionstudy. com
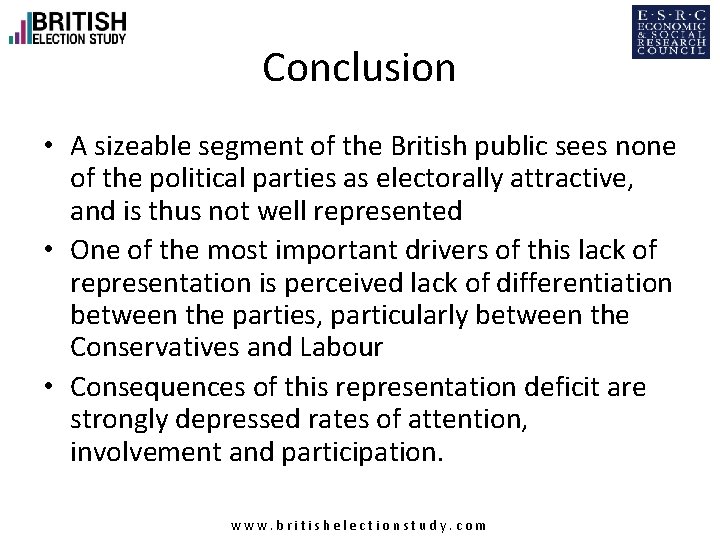
Conclusion • A sizeable segment of the British public sees none of the political parties as electorally attractive, and is thus not well represented • One of the most important drivers of this lack of representation is perceived lack of differentiation between the parties, particularly between the Conservatives and Labour • Consequences of this representation deficit are strongly depressed rates of attention, involvement and participation. www. britishelectionstudy. com
- Slides: 14