How are different types of maps distinguished Parts


- Slides: 25
How are different types of maps distinguished?
Parts of a map review https: //www. youtube. com/watch ? v=8 Ql. Jn_i. Me. Ag
Political Maps • Usually colored by country or by state • Political colors make it easy to compare size, shape, and location • Bold letters often make the country names stand out • Symbols make it easy to tell capitals from other cities • Political maps also name certain physical features, such as rivers and lakes
World Political Map
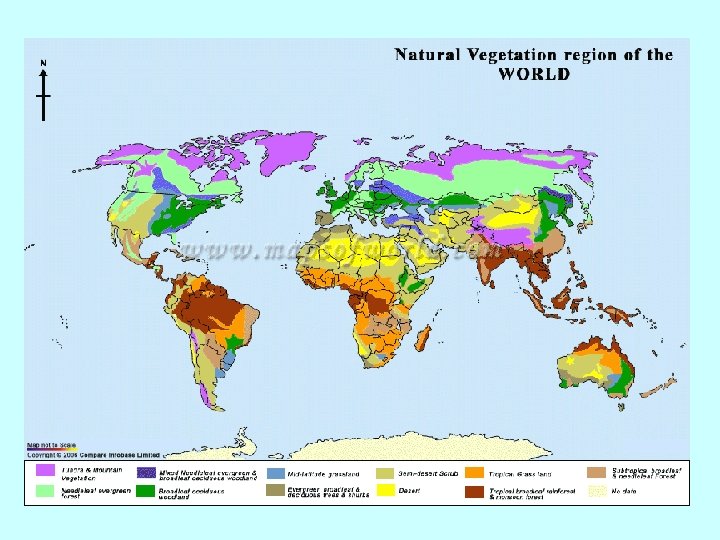
Physical Map • Has colors that make natural patterns stand out • The colors on the map can stand for types of vegetation, mountain, and natural features • Names of big natural features are easy to see • Physical maps also include some political information, such as boundaries
World Physical Map
Population Map • A population map is used to represent the overall distribution of population within a particular area. • Most maps represent the varying population data using color, while other population maps use symbols, such as circles or stars.
World Population Density Map
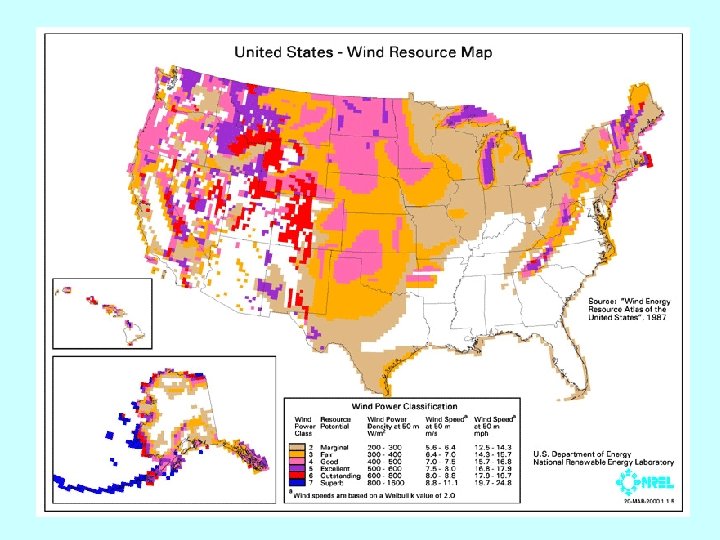
Climate Map • The climate of a place is the weather it has season by season, year after year • Rainfall and temperature are climate’s main ingredients • Climate is affected by elevation, distance from the ocean, and latitude
World Climate Map
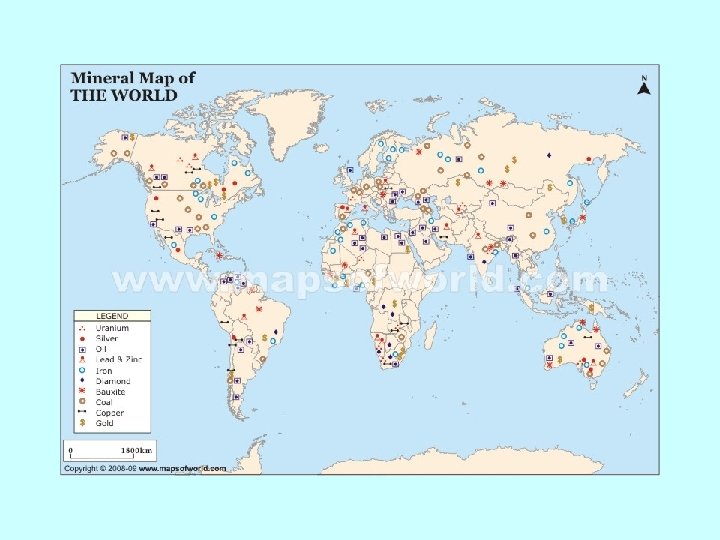
Land Use Resource Map • • • These maps show land is being used. This might refer to: vegetation crops being grown forest vs. Agriculture mines and wells city zoning.
Contour lines represent the elevation at that line. If you were to walk across a line, you are changing elevation. Contour maps
Contour map
Elevation Maps that show elevation change by using color or shading.
Elevation Map • What is the average elevation of most of this state?
Elevation Map of Tennessee
Elevation Map
Elevation Map
Topographic Map These maps generally represent a small area with a lot of detail. They show elevation with contour lines, and natural and man-made features.
Topographic Map
https: //www. youtube. com/watch? v=SXB 1 Z_Cx. BK 0
Types of Maps - Guided Notes 1. 2. 3. 4. 5. 6. 7. This map represents a small area with lots of detail. It has contour lines as well as natural and man-made features. ________ This map uses colors to show height above sea level. ______________ These colorful maps show lines that people use to divide countries and states. They also show major cities. ___________ These maps show physical features on the Earth like rivers, mountains, and deserts. ______________ These maps show population density. _________ These maps show land is being used. For example, they might show which crops are being grown or what animals are being raised. _____________ These maps show climate regions. __________