Housing Mike Reibel Geography Cal Poly Pomona Type

Housing Mike Reibel, Geography Cal Poly Pomona

Type of Housing Unit Frequency Percent Single family 811 79. 5 Multi-Family 209 20. 5
 Happy in Apt/Condo? Extremely unhappy Somewhat unhappy Neutral Somewhat happy Extremely happy")
(Would be) Happy in Apt/Condo? Extremely unhappy Somewhat unhappy Neutral Somewhat happy Extremely happy Freq 228 127 46 85 32 Pct 44. 0 24. 5 8. 9 16. 4 6. 2

Housing Tenure freq pct Own 719 72. 6 Rent 260 26. 3 Rent to Own 9 0. 9 Squatter 2 0. 2
 freq pct Fixed rate Adjustable, amortized Adjustable, interest only")
Type of Mortgage (Homeowners Only) freq pct Fixed rate Adjustable, amortized Adjustable, interest only Other type No mortgage 414 57. 4 32 16 4. 4 2. 2 6 0. 8 160 22. 2

Current Mortgage Interest Rate Less than 5% 5% to Less than 6% 6% to Less than 7% 7% and over freq 30 141 104 53 pct 9. 1 43. 0 31. 7 16. 2

Crowding Per 1000 sq ft: freq pct Less than 1 person 167 23. 7 1 to 2 people 336 47. 7 2 to 3 people 111 15. 8 3 to 4 people 62 8. 8 4 to 5 people 15 2. 1 5 to 6 people 6 0. 9 6 to 7 people 3 0. 4 More than 7 people 4 0. 6
 freq Less than 30% of gross income pct 289")
Housing Costs (% of Income) freq Less than 30% of gross income pct 289 63. 7 30 to less than 35% 41 9. 0 35 to less than 40% 32 7. 0 40 to less than 50% 37 8. 1 Greater than 50% 55 12. 1

Years Since Bought House Less than one 1 2 366 26 37 35. 8% 2. 5 3. 6 3 4 5 6 to 10 10 to 15 15 to 20 20 to 30 More than 30 30 33 31 148 77 73 93 108 2. 9 3. 2 3. 0 14. 5 7. 1 9. 1 10. 6

Housing Cost Stress by Country Born? Costs as % of Income < 30% 30 -35% 35 -40% 40 -50% >50% Total In US 65% 9% 7% 7% 11% 395 Not U. S 54% 11% 6% 15% 54

Housing Cost Stress by How Many People in Household Cost as % of 1 2 3 4 5 6+ Income < 30% 72% 76% 60% 61% 56% 40% 30 -35% 3% 10% 35 -40% 5% 40 -50% >50% Total 8% 11% 61 8% 5% 11% 8% 17% 9% 9% 3% 6% 4% 8% 9% 13% 14% 6% 12% 13% 8% 34% 111 106 89 52 35

Housing Cost Stress by # of Children Under 18 in Household Cost as % of Income < 30% 0 70% 1 53% 2 70% 3 58% 4+ 33% 30 -35% 8% 10% 9% 17% 5% 35 -40% 4% 16% 4% 8% 5% 40 -50% >50% Total 6% 11% 235 14% 7% 92 1% 16% 69 11% 6% 36 19% 38% 21

Housing Cost Stress by Tenure Cost as % of Income < 30% 30 -35% 35 -40% 40 -50% >50% Total Own 70% 9% 5% 8% 9% 287 Rent 52% 9% 10% 9% 162

Housing Cost Stress by Age Cost as >30 >40 >50 up to % of to to to Over Income 30 40 50 65 65 < 30% 53% 64% 71% 55% 30 -35% 11% 10% 8% 7% 13% 35 -40% 11% 6% 8% 7% 2% 40 -50% >50% Total 9% 16% 64 11% 83 7% 11% 107 7% 9% 147 9% 21% 47

Housing Cost Stress by Race or Ethnicity Cost as % of Income Black White Hisp Asians < 30% 58% 71% 51% 63% 30 -35% 9% 8% 12% 19% 35 -40% 9% 7% 8% 0% 40 -50% 7% 7% 10% 6% >50% 18% 7% 19% 13% Total 45 245 130 16

Housing Cost Stress by Mortgage Type Cost as % of Income < 30% Fixed Rate 74% Adjustable 42% 30 -35% 9% 4% 35 -40% 5% 4% 40 -50% >50% Total 6% 6% 249 15% 35% 26
 Happy in Apt/Condo? By race or ethnicity? Black Very Unhappy Neutral Happy")
(Would be) Happy in Apt/Condo? By race or ethnicity? Black Very Unhappy Neutral Happy Very Happy Total 38% 27% 9% 18% 9% 45 White Hisp 48% 24% 8% 15% 6% 295 39% 28% 7% 19% 7% 120 Asian 28% 28% 11% 6% 18
 Happy in Apt/Condo? by Tenure Own Rent Very Unhappy 49% 30% Unhappy")
(Would be) Happy in Apt/Condo? by Tenure Own Rent Very Unhappy 49% 30% Unhappy 25% 24% 7% 11% 13% 25% 5% 9% 367 131 Neutral Happy Very Happy Total Count

Foreclosures County/Region LOS ANGELES ORANGE 2006 Q 3 2007 Q 3 %Chg 535 3, 627 577. 9% 179 1, 280 615. 1% SAN DIEGO RIVERSIDE S. BERNARDINO VENTURA SOCAL TOTAL* 453 478 232 77 1, 960 2, 157 3, 462 2, 255 454 13, 314 376. 2% 624. 3% 872. 0% 489. 6% 579. 3% STATEWIDE 3, 435 24, 209 604. 8%

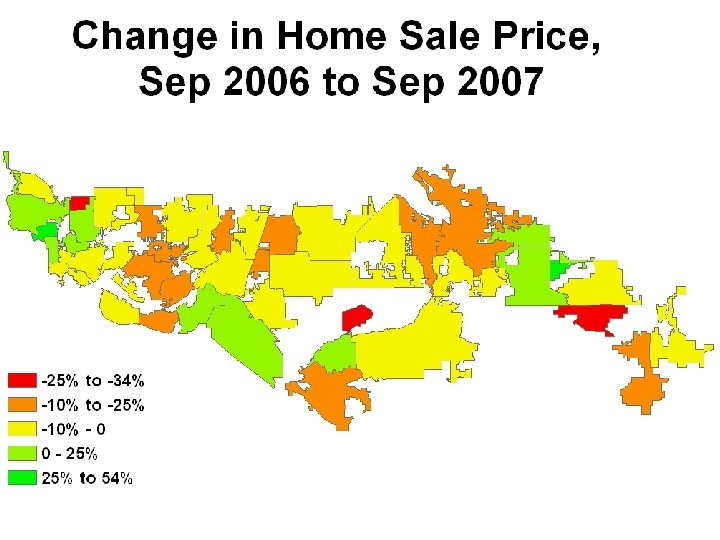
Median Price Change Los Angeles Orange Riverside San Bernardino San Diego Ventura So. Cal Sep 06 $519, 000 $630, 000 $421, 000 $365, 000 $485, 000 $592, 500 $481, 000 Sep 07 Change $525, 000 1. 2% $570, 000 -9. 5% $375, 500 -10. 8% $325, 000 -11. 0% $470, 000 -3. 1% $545, 500 -7. 9% $462, 000 -4. 0%
- Slides: 21