HOUSES HOUSEHOLD AMENITIES ASSETS IN SLUMS HIGHLIGHTS FROM


 Total No. of towns 2,")


")


- Slides: 20
HOUSES, HOUSEHOLD AMENITIES & ASSETS IN SLUMS HIGHLIGHTS FROM CENSUS 2011 DR. C. CHANDRAMOULI Registrar General & Census Commissioner, India Office of the Registrar General & Census Commissioner, India Ministry of Home Affairs
Houses, Household Amenities & Assets • After the conclusion of Census of India 2011, Tables on Houses, Household Amenities and Assets have been released in March, 2012 • Data from the above compilation are now being finalized to be released for the first time for slum households. • This will help to provide an insight into the living conditions of the slum households in the country.
Definition of a ‘Slum’ 1. All notified areas in a town or city notified as ‘Slum’ by State, UT Administration or Local Government under any Act including a ‘Slum Act’ 2. All areas recognised as ‘Slum’ by State, UT Administration or Local Government, Housing and Slum Boards, which may have not been formally notified as slum under any act 3. A compact area of at least 300 population or about 60 -70 households of poorly built congested tenements, in unhygienic environment usually with inadequate infrastructure and lacking in proper sanitary and drinking water facilities. (Identified)
SUMMARY FINDINGS
Number of Towns Reported Slum Total Statutory Towns in 2011 4, 041 Towns reported slum in 2011 2, 543* Towns reporting no slum in 2011 1, 498 * Includes 20 Census Towns
Type of slums Type of slum EB Number of Ebs % to total Households % to total Notified slum EBs 37, 072 34. 3 49, 65, 335 36. 1 Recognized slum EBs 30, 846 28. 5 37, 95, 800 27. 6 Identified slum EBs 40, 309 37. 2 49, 88, 289 36. 3 Total slum EBs 1, 08, 227 100. 0 13, 749, 424 100. 0
Number of Towns by range Range (% slum HH) Total No. of towns 2, 543 Households Percent share 1, 36, 88, 340 100. 0 <10. 0 563 8, 45, 055 6. 2 10. 0 -20. 0 605 23, 91, 397 17. 5 20. 0 -30. 0 491 32, 21, 786 23. 5 30. 0 -40. 0 346 23, 42, 752 17. 1 40. 0 -50. 0 228 28, 52, 764 20. 8 >50. 0 299 20, 01, 952 14. 6 100. 0 11 32, 634 0. 2
Slum and Non-Slum Households Indicator Households of total Urban area Households of Slum reported towns Number of Households (in lakh) Total 786 Slum 137 Non-Slum 649 Number of Households (in %) Slum 17. 4 17. 5 Non-Slum 82. 6 82. 5
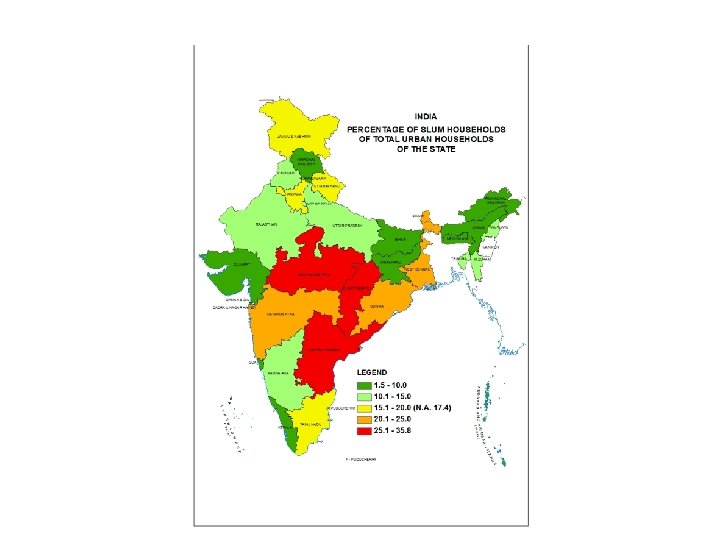
Top/Bottom 5 States reporting slum Top 5 States State Bottom 5 States % slum HH to to urban HH of Towns HH reported slum State % slum HH to to urban HH of Towns HH reported slum Andhra Pradesh 35. 8 42. 5 Chandigarh# 9. 7 10. 3 Chhattisgarh 31. 9 37. 0 Assam 4. 8 8. 7 Madhya Pradesh 28. 3 31. 8 Jharkhand 5. 3 8. 5 West Bengal 21. 9 30. 8 Gujarat 6. 7 8. 1 Odisha 23. 1 28. 6 Kerala 1. 5 7. 7
Data on Houses, Household Amenities & Assets (Based of slum reported towns)
TYPE OF CENSUS HOUSES In slum reporting Towns Type of Census Houses Slum Non-Slum Permanent 78. 9 86. 7 Semi permanent 15. 1 9. 7 Temporary 5. 0 2. 6 Any other 1. 1 1. 0
Source of Drinking Water Slum Non-Slum Source: Tap water Well Hand-pump Tube well/ Bore hole Other sources 74. 0 70. 0 3. 0 6. 8 12. 7 11. 7 7. 6 9. 2 2. 0 1. 8 56. 7 74. 4 31. 9 18. 3 11. 4 7. 3 Location: Within premises Near the premises Away
Number of Dwelling Rooms Number of dwelling rooms No exclusive room Slum Non-Slum 4. 4 2. 8 One room 44. 8 29. 4 Two rooms 29. 5 30. 8 Three rooms 12. 3 19. 6 8. 9 17. 3 Four rooms and above
Main Source of lighting Slum Non-Slum Electricity 90. 5 93. 1 Kerosene 8. 2 6. 1 Other Sources 0. 2 0. 1
Availability of Sanitation Slum Non-Slum Latrine 66. 0 84. 6 Bathing facilty 81. 0 88. 3 Closed Drainage 36. 9 46. 2 Open Drainage 44. 3 35. 7
Type of latrine facility Type of latrine Slum Non-Slum 1 Having latrine facility within the premises Piped sewer system Septic tank Other system With slab/ Without slab/ open pit 2. Night soil disposed into open drain 3. Service Latrine Night soil removed by human Night soil removed by animal 4. Not having latrine facility within the premises Public latrine Open 24. 5 31. 4 1. 8 5. 5 0. 7 1. 6 34. 5 39. 5 1. 7 6. 6 0. 7 1. 1 0. 3 34. 0 15. 1 18. 9 0. 3 0. 2 15. 4 4. 1 11. 3
Fuel used for cooking Fuel used Slum Non-Slum Fire-wood 25. 8 18. 9 Crop residue Cowdung cake Coal, Lignite, Charcoal Kerosene LPG/PNG Electricity Biogas Any other No cooking 1. 6 2. 1 3. 9 14. 0 51. 3 0. 1 0. 5 0. 3 0. 5 1. 4 1. 7 2. 7 6. 1 68. 0 0. 2 0. 4 0. 2 0. 5
Possession of Assets Slum Non-Slum Radio/ Transistor 18. 7 26. 6 Television 69. 6 78. 3 Computer/Laptop - With Internet 3. 3 9. 3 Computer/Laptop - Without Internet 7. 1 11. 1 Telephone (Land line only) 4. 4 6. 3 Mobile phone 63. 5 64. 5 Bicycle 40. 2 42. 3 Scooter/Motorcycle/Moped 22. 0 38. 0 3. 6 11. 1 10. 7 6. 2 Car/ Jeep/ Van None of the specified assets
Thank you …. . For more information please visit: censusindia. gov. in Our Census, Our Future