Household and Corporate Debts and the Real Economy

Household and Corporate Debts and the Real Economy Donghyun Park, Kwanho Shin, and Shu Tian May 2018 Research Seminar at Bank of Korea 2 July 2018
 experienced rapid accumulations of private")
Motivation • Before the GFC, most advanced economies (AEs) experienced rapid accumulations of private debts, particularly household debts, which are related to severe economic downturns during the great recession. • AEs have reduced the levels of private debts after the GFC, but EMEs continue to amass significant amounts of private debts.
 survey a")
Why Private Debts Matter? • Mian, Sufi and Verner (2017; MSV, hereafter) survey a recent body of theoretical research. • Depending on the structure of models and nature of the shocks, either positive or negative relationship between private debt buildups and the real economy is possible. – Rational-expectations models with credit demand shocks imply a positive relationship. – Models based on credit supply shocks explain the rise in private debts during the boom and subsequent downturn of the economy.

On the empirical front • A majority of studies confirm that financial crisis recessions, followed by rapid buildups of private debts, are more severe relative to normal recessions. – Jordà, Schularick and Taylor (2013; JST, hereafter) – Claessens, Kose and Terrones (2012) – Bernardini and Forni (2017)

What we do here… § Understanding the impact of both household and corporate debt buildups on the real economy and asset prices in both AEs and EMEs. § We define financial peaks (FPs) solely based on the accumulation speed of private debts and compare recessions following them with those following normal peaks (NPs). § We consider financial peaks driven by both household and corporate debts and analyze if there is any difference in recession dynamics after them.

Findings • We find that, in both AEs and EMEs, the level of household debts is smaller than that of corporate debts, but the former increases slightly faster with less volatility (SD) than the latter. • We confirm MSV (Mian, Sufi and Verner; 2017)’s results that while buildups of household debts boost output growth in the very short run, they predict lower output growth three or more years later.

Findings • In contrast, buildups of corporate debts never increase output growth even in the short run, and predict lower output growth in one to three years. § However, the negative impacts of corporate debts buildups are comparable to those of household debt buildups. § We also find that approximately half of the impacts are explained by changes in asset prices in AEs, but much more in EMEs.

Findings • We find that more FPs are driven by corporate, rather than household, debt buildups in both AEs and EMEs. • The impact of corporate financial recessions on output is as damaging as in AEs and more damaging in EMEs than that of household financial recessions. • Higher excess credits, either to households or corporations, from the previous expansion create more painful recession trajectories of output after FPs.

Data § We collect private debts of nonfinancial sector as share of GDP from the BIS Debt Securities database. § Private debts of nonfinancial sector are then divided into household debts and non-financial corporate debts for 21 AEs and 17 EMEs from 1990 to 2016.


The dynamics of private debts, household debts and corporate debts in AEs and EMEs. Advanced Economies 250 Emerging Economies 120 100 200 80 150 60 100 40 50 20 0 0 1995 2000 2005 2010 2015 USA Only 160 140 120 100 80 60 40 200 180 1990 150 1995 2000 2005 2010 2015 Four Asian Emerging Economies 2005 2010 2015 120 90 90 60 60 30 30 0 0 1995 2000 2005 Private Debt to GDP 2010 2015 1990 Household Debt to GDP 1995 2000 2005 2010 Corporate Debt to GDP 2015

Findings in Figure 1 • While both household and corporate debts increased before the global financial crisis in AEs, the dynamics of household debts is more dramatic. • Unlike AEs, EMEs continue to accumulate private debts even after the GFC. • In Asian emerging economies, the increase in private debts is most pronounced before the Asian financial crisis (AFC) in 1997, which is largely driven by corporate debts.

Table 1. Dynamic Correlations between Increases in Household and Corporate Debts

Table 2. Summary Statistics Table 2. 1. Advanced Economies

Table 2. 2. Emerging Economies

Findings in Table 2 • The means of private debts, household debts and corporate debts as shares of GDP are higher in AEs than in. • In both groups, the level of household debts is smaller than that of corporate debts, but the former increases slightly faster than the latter. • However, the volatility (SD) of percentage points per year (ppy) increases in corporate debts is much higher than that in household debts.

Dynamic relations between private debts and the real economy •

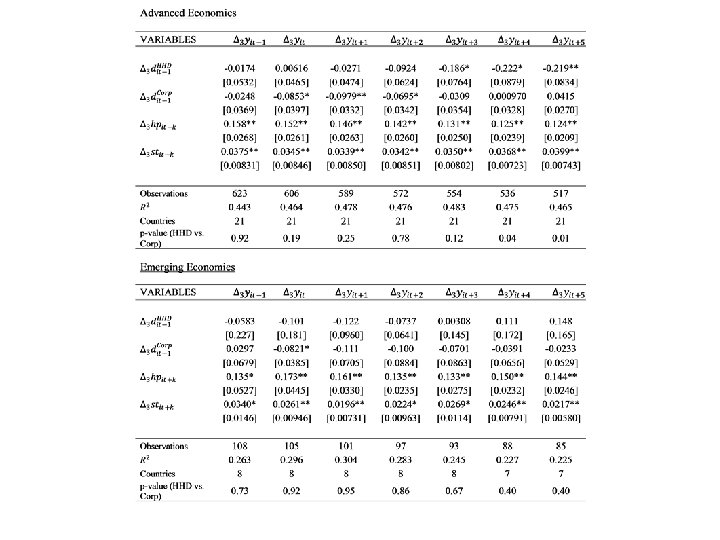
Table 3. 1 Household- and Corporate-Debt Expansion and Future Three-Year GDP Growth

Table 3. 2 Household- and Corporate-Debt Expansion and Future Three-Year Consumption Growth

Table 3. 3 Household- and Corporate-Debt Expansion and Future Three-Year Investment Growth

Table 3. 4 Household- and Corporate-Debt Expansion and Future Three-Year Housing-Price Growth

Table 3. 5 Household- and Corporate-Debt Expansion and Future Three-Year Stock-Price Growth

Findings in Table 3 • We confirm MSV’s results for AEs: buildups of household debts are more related to boom and bust of GDP. • While the size of estimated coefficients of corporate debts are smaller, their negative impacts are comparable to household debts: one SD ppy increase in household and corporate debts lowers future output growth by 1. 34 % and 1. 06 %, respectively. • In EMEs, the coefficients show the same pattern, but the magnitude of the negative impact is larger for corporate debts, which is mainly due to their larger volatility.
 • For consumption growth, we observe the same")
Findings in Table 3 (cont. ) • For consumption growth, we observe the same pattern in AEs. • In EMEs, no coefficient is statistically significant. • On investment growth, corporate debts have more negative impacts than household debts and this feature is more pronounced in EMEs.
 • In AEs, household debts lead to similar")
Findings in Table 3 (cont. ) • In AEs, household debts lead to similar booms and busts of housing prices, but corporate debts have only negative impacts on housing prices. • In EMEs, household debts have only negative impacts on housing prices in the medium run and corporate debts have almost no impacts. • On stock prices, both household and corporate debts exhibit negative prediction in both AEs and EMEs.

Are asset prices one of the channels through which private debts have impacts? • We add changes in asset prices such as housing and stock prices as additional regressors. • While the estimated coefficients of household and corporate debts are lowered approximately by halves, they are still statistically significant with the same pattern. • Interestingly, however, in EMEs, all coefficients of household and corporate debts become statistically insignificant.

Normal vs. Financial Peaks • We use the Hodrick-Prescott filter to extract business cycle fluctuations. – cf. the Bry-Boschan algorithm • We find total of 195 peaks and 140 peaks in AEs and EMEs, respectively. • We define financial peaks (FPs) solely based on buildup speed of private debts. – We calculate annual change in private debts in the preceding expansion, and if it is higher than the median in the sample, the corresponding peak is defined as a FP and otherwise as a NP.

Household vs. Corporate FPs • We divide FPs into household-debt driven and corporate-debt driven peaks by comparing annual changes in household debts and corporate debts in the preceding expansion. • Out of 98 FPs, we have both household and corporate debts data in 66 cases, and they are divided into 20 (6) household FPs and 24 (14) corporate FPs in AEs (EMEs).

Cumulative response of recessions • Following JST, we estimate the following unconditional path of the cumulative response of the variable y to a treatment x at time t(r):

Table 6. Recession Paths of GDP, Consumption and Investment after Normal and Financial Peaks Table 6. 1 Advanced Economies VARIABLES Normal Peak 0. 481+ 1. 397** 2. 992** 5. 275** 7. 833** Financial Peak [0. 255] -0. 177 [0. 514] -0. 852+ [0. 680] 0. 316 [0. 870] 1. 819* [1. 017] 2. 940** [0. 229] [0. 462] [0. 612] [0. 783] [0. 915] 0. 036 0. 06 51. 00 63. 00 0. 088 0. 00 51. 00 63. 00 0. 149 0. 00 51. 00 63. 00 0. 273 0. 00 51. 00 63. 00 0. 383 0. 00 51. 00 63. 00 VARIABLES Normal Peak 0. 831+ 1. 608* 2. 797** 4. 959** 7. 485** Financial Peak [0. 434] 1. 729** [0. 618] 1. 681** [0. 892] 2. 627** [1. 089] 4. 488** [1. 206] 6. 784** [0. 391] [0. 556] [0. 803] [0. 980] [1. 085] 0. 172 0. 13 51. 00 63. 00 0. 125 0. 93 51. 00 63. 00 0. 155 0. 89 51. 00 63. 00 0. 271 0. 75 51. 00 63. 00 0. 409 0. 67 51. 00 63. 00 -3. 054** -5. 147** -4. 349* -1. 477 2. 100 [1. 154] [1. 877] [2. 158] [2. 656] [2. 895] F-test equality of coefficients, normal = financial (p) N Normal Peaks N Financial Peaks F-test equality of coefficients, normal = financial (p) Observations, Normal Peaks Observations, Financial Peaks VARIABLES Normal Peak

Table 6. 2 Whole Countries VARIABLES Normal Peak . 3406 1. 718** 4. 505** 7. 245** 10. 26** Financial Peak [0. 328] -0. 557+ [0. 514] -1. 122* [0. 685] 0. 804 [0. 879] 2. 632** [1. 014] 4. 521** [0. 309] [0. 484] [0. 646] [0. 828] [0. 956] 0. 025 0. 05 80. 00 90. 00 0. 090 0. 00 80. 00 90. 00 0. 211 0. 00 80. 00 90. 00 0. 317 0. 00 80. 00 90. 00 0. 426 0. 00 80. 00 90. 00 VARIABLES Normal Peak 1. 716** 2. 947** 5. 477** 8. 040** 11. 35** Financial Peak [0. 516] 1. 098* [0. 776] 1. 142 [1. 016] 3. 382** [1. 285] 6. 282** [1. 453] 9. 438** [0. 487] [0. 731] [0. 958] [1. 212] [1. 370] Observations, Financial Peaks 0. 088 0. 38 80. 00 90. 00 0. 091 0. 09 80. 00 90. 00 0. 198 0. 14 80. 00 90. 00 0. 282 0. 32 80. 00 90. 00 0. 392 0. 34 80. 00 90. 00 VARIABLES Normal Peak -2. 064 -3. 308 -0. 522 3. 622 7. 528** [1. 533] [2. 011] [2. 289] [2. 672] [2. 887] F-test equality of coefficients, normal = financial (p) N Normal Peaks N Financial Peaks F-test equality of coefficients, normal = financial (p) Observations, Normal Peaks

Findings in Table 6 • Table 6 compares recession paths of cumulative changes in output, consumption and investment, 1 -5 years. – treating x as a binary indicator for normal or financial recession. • We find that cumulative changes in output and investment are lower after FPs than after NPs with high statistical significance. • This is more so in EMEs.

Household vs. Corporate FPs • We divide FPs into household-debt driven and corporate-debt driven peaks by comparing annual changes in household debts and corporate debts in the preceding expansion. • Out of 98 FPs, we have both household and corporate debts data in 66 cases, and they are divided into 20 (6) household FPs and 24 (14) corporate FPs in AEs (EMEs).

Table 7. Recession Paths of GDP Table 7. 1 Advanced Economies VARIABLES Normal Peak 0. 481+ 1. 397** 2. 992** 5. 275** 7. 833** Household Financial Peak [0. 251] 0. 152 [0. 502] -1. 238 [0. 662] -1. 007 [0. 858] -0. 0390 [1. 026] 1. 389 Corporation Financial Peak [0. 411] -0. 830* [0. 823] -1. 402+ [1. 084] 0. 473 [1. 405] 2. 067 [1. 681] 2. 850+ [0. 374] [0. 748] [0. 985] [1. 277] [1. 528] Observations, Normal Peaks Observations, Household Financial Peaks Observations, Corporate Financial Peaks 0. 088 0. 50 0. 08 51. 00 19. 00 23. 00 0. 130 0. 01 0. 00 0. 88 51. 00 19. 00 23. 00 0. 193 0. 00 0. 04 0. 31 51. 00 19. 00 23. 00 0. 310 0. 04 0. 27 51. 00 19. 00 23. 00 0. 410 0. 01 0. 52 51. 00 19. 00 23. 00 Normal Peak 0. 346 1. 718** 4. 505** 7. 245** 10. 26** Household Financial Peak [0. 280] 0. 384 [0. 479] -0. 794 [0. 647] 0. 0467 [0. 849] 1. 611 [1. 008] 3. 140 Corporation Financial Peak [0. 534] -0. 470 [0. 914] -0. 888 [1. 234] 1. 595 [1. 619] 3. 309* [1. 921] 4. 670** [0. 430] [0. 735] [0. 992] [1. 302] [1. 545] 0. 024 0. 95 0. 11 0. 22 80. 00 22. 00 0. 102 0. 00 0. 94 80. 00 22. 00 0. 277 0. 00 0. 02 0. 33 80. 00 22. 00 0. 376 0. 00 0. 01 0. 42 80. 00 22. 00 0. 465 0. 00 0. 54 80. 00 22. 00 F-test equality of coefficients, normal = household (p) F-test equality of coefficients, normal = corporate (p) F-test equality of coefficients, Household = corporate (p) Table 7. 2 Whole Countries F-test equality of coefficients, normal = household (p) F-test equality of coefficients, normal = corporate (p) F-test equality of coefficients, Household = corporate (p) Observations, Normal Peaks Observations, Household Financial Peaks

Table 7. Recession Paths of Investment Table 7. 1 Advanced Economies Table 7. 2 Whole Countries Normal Peak 0. 346 1. 718** 4. 505** 7. 245** 10. 26** Household Financial Peak [0. 280] 0. 384 [0. 479] -0. 794 [0. 647] 0. 0467 [0. 849] 1. 611 [1. 008] 3. 140 Corporation Financial Peak [0. 534] -0. 470 [0. 914] -0. 888 [1. 234] 1. 595 [1. 619] 3. 309* [1. 921] 4. 670** [0. 430] [0. 735] [0. 992] [1. 302] [1. 545] 0. 024 0. 95 0. 11 0. 22 80. 00 22. 00 34. 00 0. 102 0. 00 0. 94 80. 00 22. 00 34. 00 0. 277 0. 00 0. 02 0. 33 80. 00 22. 00 34. 00 0. 376 0. 00 0. 01 0. 42 80. 00 22. 00 34. 00 0. 465 0. 00 0. 54 80. 00 22. 00 34. 00 F-test equality of coefficients, normal = household (p) F-test equality of coefficients, normal = corporate (p) F-test equality of coefficients, Household = corporate (p) Observations, Normal Peaks Observations, Household Financial Peaks Observations, Corporate Financial Peaks

Figure 2 A. Advanced Countries Real Consumption Real GDP 20 15 10 5 20 0 -5 -10 15 -20 10 5 0 -5 -10 -15 -20 -5 -4 -3 -2 -1 0 1 2 3 4 5 Paths around NP 20 -215 10 5 0 -5 -10 -15 -20 -1 0 Real Investment 1 -5 -4 -3 -2 -1 0 1 2 3 4 5 Paths around Household FP 20 215 10 5 0 -5 -10 -15 -20 3 4 5 -5 -4 -3 -2 -1 0 1 2 3 4 5 Paths around Corporate FP Figure 2 B. Emerging Countries 20 15 10 20 5 0 -5 15 -10 -15 -20 10 Real GDP Real Consumption 20 -5 -4 -3 5 15 -2 10 20 -1 0 1 5 0 -5 Real Investment -5 4 5 0 -5 -4 -3 -2 -1 0 1 2 3 4 5 -5 -10 -10 -15 -15 -20 -20 Paths around NP 3 5 0 -5 -4 -3 -2 -1 0 1 2 3 4 5 15 2 10 Paths around Household FP -5 -4 -3 -2 -1 0 1 2 3 4 5 Paths around Corporate FP

Findings in Table 7 • Cumulative changes in output are substantially lower in both household and corporate financial recessions than in normal recessions. • However, the difference of cumulative changes in output between household and corporate financial recessions is not statistically significant. • Corporate financial recessions are equally damaging as household financial recessions is even more strengthened if we include EMEs in the sample.

Excess Credit as a Continuous Treatment • We include interaction terms with excess credits to households and corporations in the expansion to capture marginal treatment responses due to deviations of excess credit from its specific recession-type mean.

Table 8. 1. A. Recession Paths of GDP Table 8. 1. A. Advanced Economies, Output VARIABLES Normal Peak Financial Peak Household Excess credit × Normal Peak Household Excess credit × Financial Peak 0. 0403 0. 216 0. 693 0. 672 1. 795* 2. 048* 3. 647** 3. 882** 5. 678** 5. 682** [0. 403] [0. 442] [0. 705] [0. 773] [0. 875] [1. 020] [1. 130] [1. 326] [1. 280] [1. 475] -0. 394 -0. 381 -1. 222* -1. 371* -0. 00746 -0. 381 1. 366 0. 873 2. 491* 1. 817+ [0. 310] [0. 314] [0. 543] [0. 549] [0. 673] [0. 724] [0. 869] [0. 942] [0. 985] [1. 047] 0. 00185 -0. 140 -0. 819 -0. 773 -0. 668 [0. 266] [0. 464] [0. 576] [0. 744] [0. 843] 0. 0525 -0. 676* -1. 211** -1. 614** -1. 936** [0. 187] [0. 327] [0. 406] [0. 524] Corporation Excess credit × Normal Peak Corporation Excess credit × Financial Peak [0. 594] -0. 0229 0. 266 -0. 0547 -0. 263 -0. 230 [0. 186] [0. 326] [0. 429] [0. 558] [0. 621] -0. 220 -0. 799* -0. 962* -1. 166* -1. 529* [0. 177] [0. 310] [0. 409] [0. 532] [0. 591] 0. 025 0. 050 0. 154 0. 197 0. 203 0. 146 0. 273 0. 201 0. 370 0. 307 F-test equality of coefficients, normal = financial (p) 0. 40 0. 28 0. 04 0. 11 0. 06 0. 11 0. 07 0. 05 0. 04 F-test equality of coefficients, interaction terms (p) 0. 88 0. 45 0. 35 0. 02 0. 58 0. 13 0. 36 0. 25 0. 22 0. 14 Observations, Normal Peaks 25. 00 23. 00 Observations, Financial Peaks 42. 00 40. 00

Table 8. 2. A. Whole Countries, Output VARIABLES Normal Peak Financial Peak Household Excess credit × Normal Peak Household Excess credit × Financial Peak 9. 026** 0. 112 0. 197 1. 068 1. 177+ 3. 990** 4. 115** 6. 473** 6. 531** 9. 040** [0. 412] [0. 425] [0. 662] [0. 677] [0. 869] [0. 899] [1. 145] [1. 190] [1. 328] [1. 378] -0. 135 -0. 109 -0. 851 -0. 817 0. 987 0. 953 2. 642* 2. 591* 4. 069** 3. 957** [0. 374] [0. 384] [0. 600] [0. 611] [0. 788] [0. 812] [1. 038] [1. 074] [1. 204] [1. 244] 0. 118 0. 333 -0. 299 -0. 0914 0. 186 [0. 282] [0. 453] [0. 595] [0. 784] [0. 909] 0. 0770 -0. 0452 -0. 430 -0. 601 -0. 728 [0. 190] [0. 305] [0. 401] [0. 528] [0. 612] Corporation Excess credit × Normal Peak Corporation Excess credit × Financial Peak -0. 120 -0. 0338 -0. 200 -0. 300 -0. 211 [0. 149] [0. 237] [0. 315] [0. 416] [0. 482] -0. 0105 -0. 540 -0. 494 -0. 596 -0. 876 [0. 207] [0. 330] [0. 438] [0. 580] [0. 672] 0. 005 0. 010 0. 050 0. 074 0. 197 0. 203 0. 289 0. 285 0. 377 0. 369 F-test equality of coefficients, normal = financial (p) 0. 66 0. 59 0. 03 0. 01 0. 02 0. 01 F-test equality of coefficients, interaction terms (p) 0. 91 0. 67 0. 49 0. 22 0. 86 0. 59 0. 68 0. 41 0. 42 Observations, Normal Peaks 46. 00 44. 00 Observations, Financial Peaks 56. 00 54. 00

Figure 3. Recession Paths under Continuous Excess Credit Treatment Figure 3 A. Advanced Countries Real GDP Real Consumption Real Investment 10 10 10 5 0 -5 0 -15 5 5 0 1 0 2 3 4 1 5 0 0 2 1 3 4 3 0 5 -5 -10 -10 -15 -15 4 0 1 3 5 4 5 Normal Recession +1 sd (Household Debt) +1 sd (Corporate Debt) Financial Recession +1 sd (Household Debt) +1 sd (Corporate Debt)

Figure 3 B. Whole Countries Real GDP Real Consumption Real Investment 15 15 15 10 10 5 0 5 -5 -10 -15 0 1 0 5 2 5 3 0 0 1 2 3 4 5 0 1 3 4 5 0 0 -5 -5 -5 -10 -10 1 3 4 5 Normal Recession +1 sd (Household Debt) +1 sd (Corporate Debt) Financial Recession +1 sd (Household Debt) +1 sd (Corporate Debt)

Findings in Table 8 • For Output, while the interaction terms with excess credits to households and corporations are not statistically significant for NPs, they are statistically significant for FPs in AEs. • 1 SD perturbation of corporation debts places the trajectory even more below than the same shock of household debts does in EMEs.

Table 8. 1. C Advanced Economies, Investment VARIABLES Normal Peak Financial Peak Household Excess credit × Normal Peak Household Excess credit × Financial Peak Corporation Excess credit × Normal Peak Corporation Excess credit × Financial Peak F-test equality of coefficients, normal = financial (p) F-test equality of coefficients, interaction terms (p) Observations, Normal Peaks Observations, Financial Peaks -3. 594* [1. 687] -4. 413** [1. 298] -1. 256 [1. 111] 0. 571 [0. 783] -3. 594+ [1. 909] -4. 286** [1. 355] -6. 268** [2. 183] -11. 55** [1. 680] -0. 86 [1. 437] -2. 090* [1. 013] -6. 712** [2. 357] -11. 66** [1. 673] -4. 314 [2. 672] -8. 310** [2. 056] -1. 199 [1. 759] -4. 083** [1. 239] -3. 589 [3. 214] -9. 197** [2. 281] -2. 135 [3. 313] -4. 808+ [2. 550] -0. 385 [2. 181] -4. 983** [1. 537] -0. 454 [3. 986] -5. 655+ [2. 829] 0. 46 [3. 596] -2. 688 [2. 767] 1. 31 [2. 368] -5. 239** [1. 668] 1. 06 [4. 330] -3. 776 [3. 074] 0. 661 1. 207 -0. 299 -1. 609 -1. 614 [0. 804] [0. 992] [1. 353] [1. 678] [1. 823] -0. 121 -2. 299* -2. 421+ -2. 374 -2. 339 [0. 765] [0. 945] [1. 288] [1. 598] [1. 736] 0. 213 0. 187 0. 509 0. 342 0. 261 0. 2 0. 107 0. 158 0. 063 0. 77 0. 06 0. 09 0. 24 0. 16 0. 52 0. 29 0. 49 0. 37 0. 18 0. 49 0. 01 0. 18 0. 26 0. 09 0. 74 0. 03 0. 77 25 23 25 23 42 40 42 40

Table 8. 2. C Whole Countries, Investment VARIABLES Normal Peak Financial Peak Household Excess credit × Normal Peak Household Excess credit × Financial Peak -1. 873 [1. 967] -4. 339* [1. 783] -1. 988 [1. 346] 0. 524 [0. 907] Corporation Excess credit × Financial Peak Observations, Normal Peaks Observations, Financial Peaks -4. 059+ [2. 335] -11. 13** [2. 116] -0. 860 [1. 598] -0. 552 [1. 076] -0. 530 [0. 721] 0. 0306 [1. 005] Corporation Excess credit × Normal Peak F-test equality of coefficients, normal = financial (p) F-test equality of coefficients, interaction terms (p) -1. 631 [2. 062] -4. 304* [1. 862] -3. 746 [2. 369] -10. 80** [2. 139] 0. 335 [2. 825] -6. 357* [2. 560] -1. 328 [1. 933] -1. 611 [1. 302] 0. 233 [0. 829] -2. 174+ [1. 155] 0. 673 [2. 924] -6. 298* [2. 640] 4. 187 [3. 187] -3. 358 [2. 888] -0. 182 [2. 181] -1. 968 [1. 469] -0. 538 [1. 023] -2. 387+ [1. 425] 4. 605 [3. 274] -3. 181 [2. 955] 7. 313* [3. 585] -1. 034 [3. 249] 1. 354 [2. 454] -2. 361 [1. 653] -1. 637 [1. 145] -2. 415 [1. 596] 7. 360+ [3. 737] -0. 999 [3. 374] -1. 123 [1. 307] -2. 433 [1. 822] 0. 087 0. 065 0. 242 0. 252 0. 077 0. 086 0. 047 0. 074 0. 063 0. 065 0. 36 0. 34 0. 03 0. 08 0. 09 0. 10 0. 12 46. 00 56. 00 0. 65 44. 00 54. 00 0. 87 46. 00 56. 00 0. 09 44. 00 54. 00 0. 90 46. 00 56. 00 0. 29 44. 00 54. 00 0. 50 46. 00 56. 00 0. 69 44. 00 54. 00 0. 21 46. 00 56. 00 0. 56 44. 00 54. 00
 • For investment, we observe clear difference between")
Findings in Table 8 (cont. ) • For investment, we observe clear difference between trajectories after NPs and FPs. • Excess credits further aggravate the recession recovery, particularly after FPs. • While the investment trajectory perturbed by 1 SD ppy increase in household debts is placed below than that perturbed by the same shock in AEs, they are placed reversely in the whole countries.

Conclusion § We try to comprehensively understand the impact of both household and corporate debt buildups on the real economy in both AEs and EMEs. § While the size of estimated coefficients of corporate debts are smaller, their negative impacts, as measured by one SD shock, are comparable to those of household debt buildups.
 § We find that more FPs are driven by corporate, rather")
Conclusion (cont. ) § We find that more FPs are driven by corporate, rather than household, debt buildups in both AEs and EMEs. § The impact of corporate financial recessions on output is as damaging as that of household financial recessions in AEs. § Corporate debt buildups are particularly more painful in EMEs.
- Slides: 49