Hospital Alcohol Project James Crosbie Gastroenterologist Alcohol Delivery

Hospital Alcohol Project James Crosbie, Gastroenterologist Alcohol Delivery Group 1 st July 2011

Hospital Alcohol Project James Crosbie, Gastroenterologist Alcohol Delivery Group 1 st July 2011


Hospital Alcohol Project • Background • Objectives • Personnel • Activity & outcomes – 1. Emergency Dept – 2. Gastroenterology – 3. Turning Point • The way forward (& barriers)

RPIW Sarah Fox & Ben Seale


Background
 • Measures rate of alcohol related admissions using Hospital")
National Indicator 39 (NI 39) • Measures rate of alcohol related admissions using Hospital Episodes Statistics (HES) • “Alcohol Attributable Fractions” for medical conditions applied to HES • 47 conditions : – 13 wholly attributable conditions – 22 partially attributable chronic conditions – 2 partially attributable acute consequences. – eg ALD =1, hypertension <1 (depending on age & sex). . . • 60 -70% NI 39 admissions in NE “partially attributable”

 • Increase hospital based")
Objective • Reduce Alcohol Related Hospital admissions (NI 39? ) • Increase hospital based resources for patients with alcohol related illness • Alcohol Steering group


CHS Personnel • Emergency Dept – Kate Lambert – Cain Thomason • Gastroenterology – James Crosbie – Deb Smith • Turning Point – Geoff Anderson – Laura Thubrun – Tracey Stewart ED Consultant Data manager Clinical Lead Alcohol Specialist Nurse Senior Alcohol Worker


1. Emergency Department

1. Emergency Department The Scale of the Problem: • April 2009 – March 2011 – 9150 Alcohol related ED attendances – 1337 Alcohol related admissions via ED – 269 of these readmissions by 136 individuals • June 2010 – May 2011 – Top 50 attendees accounted for 598 attendances – Top 10 attendees accounted for 328 attendances

1. Emergency Department The Scale of the Problem: • April 2009 – March 2011 – 9150 Alcohol related ED attendances – 1337 Alcohol related admissions via ED – 269 of these readmissions by 136 individuals • June 2010 – May 2011 – Top 50 attendees accounted for 598 attendances – Top 10 attendees accounted for 328 attendances
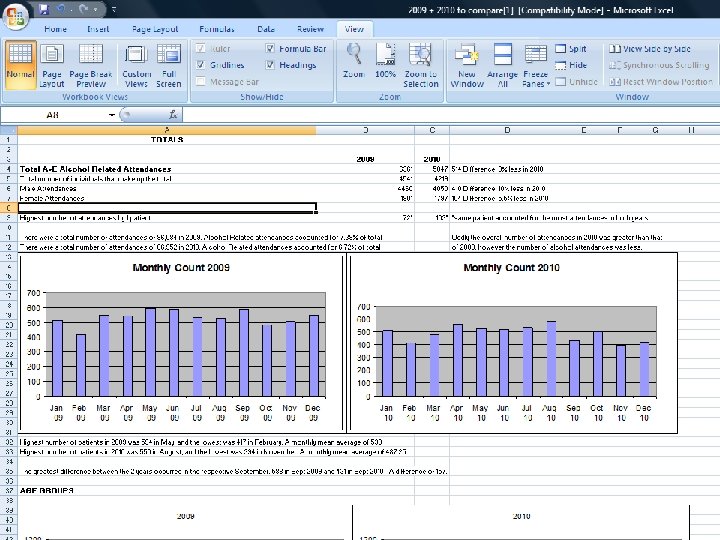
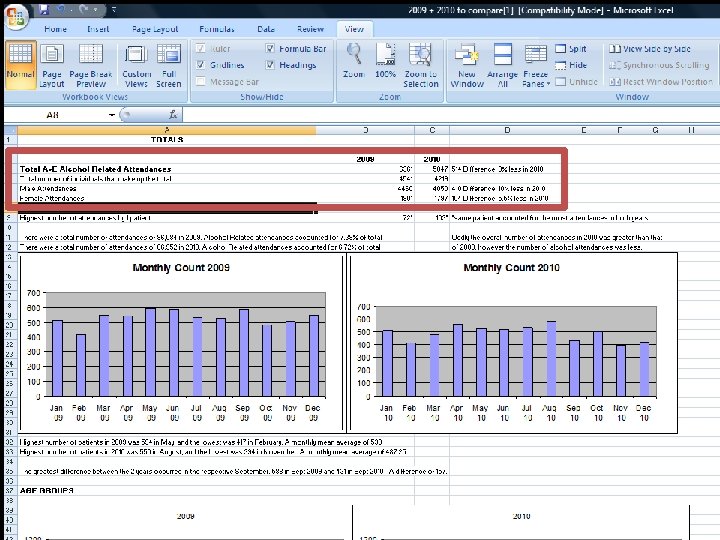


Year 1 of the Hospital Alcohol Project 2009/10 – 2010/11: – Total ED attendances increased by 1% – Alcohol related attendances fell by 8% (10% men 5% women) – Alcohol % total attendances fell by 0. 66%


Heavy Service Users Group • Initial activity stopped due to info sharing barriers • Restarting following RPIW – Info sharing protocol v 5. 1 – Care Navigator post • Top 20 frequent attenders & others from ED dashboard (or if complex needs identified) – – Kate Lambert Data manager ASN DAT -Probation -Mental Health -Housing -C 4

Heavy Service Users Group • Initial activity stopped due to info sharing barriers • Restarting following RPIW – Info sharing protocol v 5. 1 – Care Navigator post • Top 20 frequent attenders & others from ED dashboard (or if complex needs identified) – – – Kate Lambert Data manager ASN DAT James Crosbie -Probation -Mental Health -Housing -C 4 -GP


Youth Drug and Alcohol Project • Service reinstated with permanent Hospital Link Worker March 2011 • 36 alcohol related ED attendances < 18 since then (2. 25 /week) • Age range 10 – 17 years (median 15 mean 14) • 19 referred to YDAP – 10 attended Brief Intervention – 3 sent information packs – 2 already known to YDAP, – 2 open referrals to YDAP – 2 declined any input. • Of the 17 not referred, 13 have been sent letters from YDAP offering follow up and information packs.


BREAK


2. Gastroenterology
 • Introduction of symptom triggered detox •")
2. Gastroenterology • Alcohol Specialist Nurse (ASN) • Introduction of symptom triggered detox • Alcohol IBA training – Targeted clinical areas & staff – Embedded in junior doctor teaching programme – SASQ embedded in medical admission proforma


Alcohol Specialist Nurse – Inpatient referrals: harmful drinkers – Liaison with : • Gastroenterology • Community team (Counted 4) • Turning Point • DAT • Other agencies – Facilitate discharge of gastro patients through early follow up – Phoneline, voicemail & bleep for direct patient access – Clinic for review of discharged patients, direct access and scheduled follow up – Day case paracentesis service with view to nurse led service – Nurse prescribing – Alcohol Link Nurse Network (all wards)

A&E Drug & Alcohol Team Turning Point Ne. RAF NECA Hospital wards Deb Smith ALN Gastroenterolog y Primary care Counted 4

 June 2011 • 392 referrals (70")
Alcohol Specialist Nurse Activity Jan 2011 – (mid) June 2011 • 392 referrals (70 / month) • Onward Referrals: – TP: 122 C 4: 7 DAT: 17 – Housing: 17 Other: 29 Huntercoombe: 8 • 285 clinic follow up • 165 BI • 161 liver disease blood tests + 38 liver USS • 128 telephone referrals (56 onward referral / discussion • Direct access paracentesis 26

Age 91 -1 00 0 -9 81 0 -8 71 0 -7 61 0 -6 51 0 -5 41 0 -4 31 0 -3 21 0 -2 11 10 0 - E AG No. of pts. Alcohol Specialist Nurse AGE GROUPS 140 120 100 80 Series 1 60 40 20 0

Profile

Staff Education & Training • Alcohol Link Nurse network • Nursing Clinical skills • Medical students • Hospital meetings


Inpatient detox • Previous model: Fixed dose detox – 5 -7 day admission with controlled reduction – Standard dosing to all “increasing risk” drinkers • Symptom triggered detox (NICE recommended) – Identify dependence (withdrawal) – Reduce LOS for those not requiring treatment – Increased monitoring & treatment for withdrawal – Reduction in overall drug dispensing & cost – Increased effectiveness of treatment when needed

CIWA-Ar for the management of Alcohol Withdrawal Syndrome Patient name___________ Date started___________ X number_____________ Time (24 hour)___________
 audit June – August 2010 • 239 admissions for 194 unique")
Pre CIWA (baseline) audit June – August 2010 • 239 admissions for 194 unique patients • 26 (13%) had been admitted >1 occassion (group A) Average amount of chlordiazepoxide used during admission from both single admission (group B) and repeat admission (group A) patients Average total amount per patient (mg) Average Daily Amount (mg) 0 -24 hours (mg) 24 -48 hours(mg) 48 hours +(mg) Group A Group B 258. 99 47. 93 89. 82 87. 38 198. 25 213. 76 31. 02 78. 58 77. 76 213. 49
 audit June – August 2010 • 239 admissions for 194 unique")
Pre CIWA (baseline) audit June – August 2010 • 239 admissions for 194 unique patients • 26 (13%) had been admitted >1 occassion number of admissions and average length of stay of both repeat and single admission patients. Total Admissions Number of Patients Average length of stay (days) Range (days) Repeat Patients 70 26 4. 27 0 -20 Single Admission patients 168 6. 83 0 -78


Turning Point

Turning Point • All inpatients & A&E attendances identified as problem drinkers • Monday to Saturday service (diary appointment if intoxicated or out of hours) • Delivery of alcohol interventions • Initial assessment with onward referral to community services: – Ne. RAF – NECCA – Drug & Alcohol Team – Counted 4


Turning Point No of Referrals Brief Interventions December 2010 66 Assessed 12 Previously Assessed 54 25 January 2011 No of Referrals Assessed Brief Interventions Declined Service Previously Assessed 80 12 65 3 29 February 2011 No of Referrals Assessed Brief Interventions Declined Service Previously Assessed 80 10 69 1 18 March 2011 No of Referrals Brief Interventions 58 40 Assessed Previously Assessed 18 April 2011 No of Referrals Assessed and Referred On Assessed and Taken Onto Caseload Extended Brief Intervention Only Out of Area Referrals Follow Up Appointments 64 8 6 42 8 24

Turning Point No of Referrals Brief Interventions December 2010 66 Assessed 12 Previously Assessed 54 25 January 2011 No of Referrals Assessed Brief Interventions Declined Service Previously Assessed 80 12 65 3 29 February 2011 No of Referrals Assessed Brief Interventions Declined Service Previously Assessed 80 10 69 1 18 March 2011 No of Referrals Brief Interventions 58 40 Assessed Previously Assessed 18 April 2011 No of Referrals Assessed and Referred On Assessed and Taken Onto Caseload Extended Brief Intervention Only Out of Area Referrals Follow Up Appointments 64 8 6 42 8 24

Turning Point April 2011 Level of Alcohol Use 3 4. 7%Harmful 13 20. 3%Hazardous 29 45. 3%Sensible Abstinent Binge Dependent Male 13 2 4 Follow Up Appointments 20. 3% 3. 1% 18 -24 6. 3% 25 -34 35 -44 45 -54 Gender 62. 5%Female Age 1. 6%55 -64 25. 0%65 -74 31. 3%75+ 20. 3% Ethnicity 98. 4%Other White Accommodation 6. 3%Owned 9. 4%Rented - Gentoo 23. 4%Rented - RSL 1. 6%Supported Housing 40 1 16 20 13 Out of Area Referrals White British Extended Brief Intervention Only Assessed and Referred On Abdominal Pain Alcohol Withdrawal Cellulitis Collapsed Fall Overdose Stomach Cancer Suicidal Ideation N/A 0 10 20 Postcode 7. 8%DH 3 12. 5%DH 4 9. 4%DH 5 9. 4%NE 37 17. 2%NE 38 6. 3%TS 8 10. 9% 1. 6% Presenting Complaints 3 4. 7%Alcohol Excess 5 7. 8%Assaulted 2 3. 1%Chest Pain 2 3. 1%Depression 8 12. 5%Generally Unwell 12 18. 8%Self Harm 1 1. 6%Stroke 9 14. 1%Vomiting 8 12. 5% 5 8 6 6 11 4 7 1 Hostel Parental Rented - Private Sheltered Accommodation Assessed and Taken Onto Caseload SR 1 SR 2 SR 3 SR 4 SR 5 SR 6 SR 7 SR 8 63 30 40 50 1 3 7 1 3 1 1 1 2 1 1 5 1 2 1. 6% 4. 7% 10. 9% 1. 6% 4. 7% 1. 6% 0. 0% 1. 6% 3. 1% 1. 6% 7. 8% 1. 6% 3. 1% 0. 0% AA Cruise Durham CAS NERAF None Low 4 6 15 1 Referrals Made 1. 6%Counted 4 1. 6%Dual Diagnosis Nurse 7. 8%NECA 1. 6%Self Harm Team Complex Needs 6 9. 4%Medium 34 53. 1%High A&E AMU B 28 C 36 D 57 Self 0 63 2 37 1 6 Children 37. 5%Children Living in Property Armed Forces 0. 0% Forces Attributable? 98. 4% Referral Source 3. 1%Alcohol Nurse 4. 7%ASN 3. 1%C 33 57. 8%ESAU 1. 6%F 51 9. 4%Self Harm Team 37. 5% 8 3 3 12. 5% 4. 7% 0. 0% 1 1. 6% 9 20 7 2 14. 1% 31. 3% 10. 9% 3. 1% 1 2 5 1 1. 6% 3. 1% 7. 8% 1. 6% 12 12 18. 8% 1 1 5 1 Parent/Childcare Responsibilities 24 Yes No 24 7 10. 9% 0 0. 0% 7 1 1 2 10. 9% 1. 6% 3. 1%


The way forward • Implement RPIW outcomes – Care Navigator – Enhanced data set & data management – 7 day alcohol liaison service • Roll out CIWA across all (non medical) wards – Complete audit (post CIWA) • Enhanced ASN role including – Increased outpatient capacity – Prescribing role – Further bid for additional post (readmission funds)

Barriers
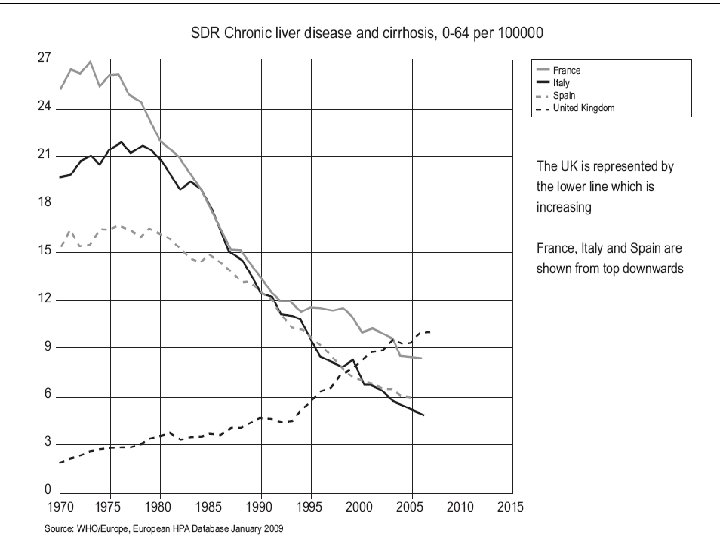
 – Newcastle model: wholly attributable")
Barriers • NI 39 – Unresponsive (majority partially attributable) – Newcastle model: wholly attributable analysis

- Slides: 59