Horizontal and Vertical lines Warm up Graph the


")

")


- Slides: 19
Horizontal and Vertical lines
Warm up • Graph the lines.
5. 6 – Day 1 Finding Intercepts and Graphing in Standard Form
Intercepts x-intercept y-intercept • Place where graph crosses x – axis • Always in the form of (#, 0) • Can be found by plugging in 0 for y and solving for x • Place where graph crosses y – axis • Always in the form of (0, #) • Can be found by plugging in 0 for x and solving for y
Example 1 • x-intercept y-intercept ( ( , )
Graphing in Standard Form •
Example 2 • x-intercept y-intercept ( ( , )
Example 3 Graph the equation 2 x + 6 y = -18. x-intercept y-intercept ( ( , )
Homework • Worksheet
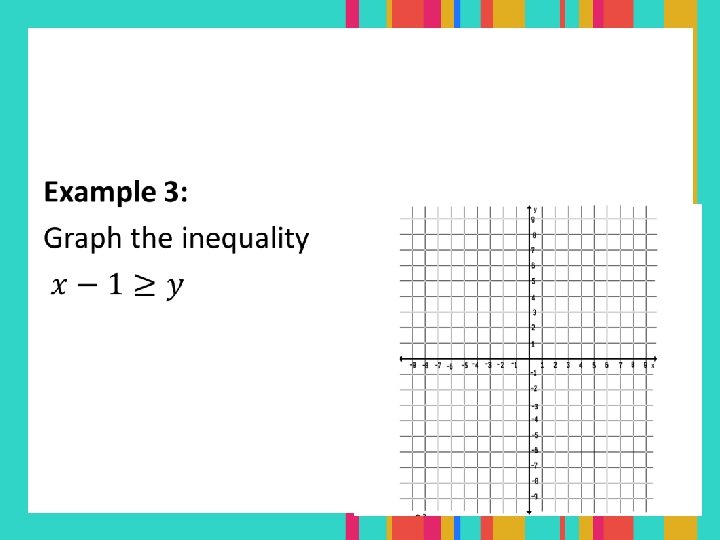
5. 6 Day 2 Graphing Inequalities in Two Variables
Example 1 •
The graph of a linear inequality is the set of points that represent all of the possible solutions of that inequality. An equation defines a boundary, which divides the coordinate plane into two half planes. The boundary may or not be included in the solution. When it is included, the solution is a closed half-plane (solid line). When not included, the solution is an open half-plane (dashed line).
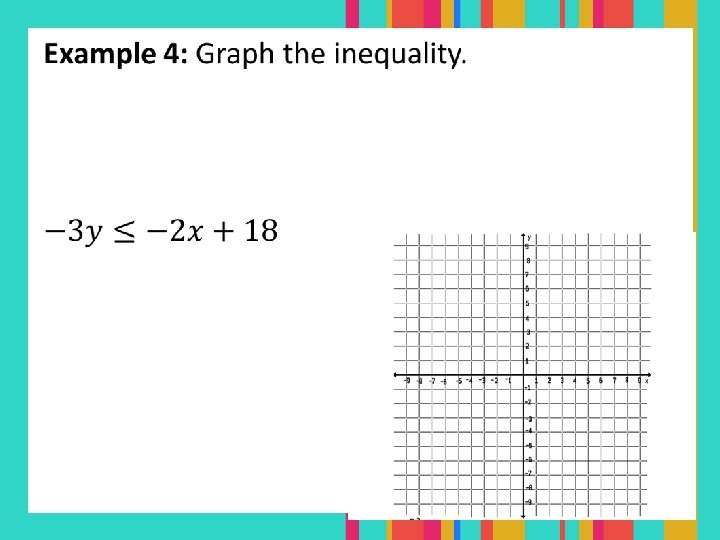
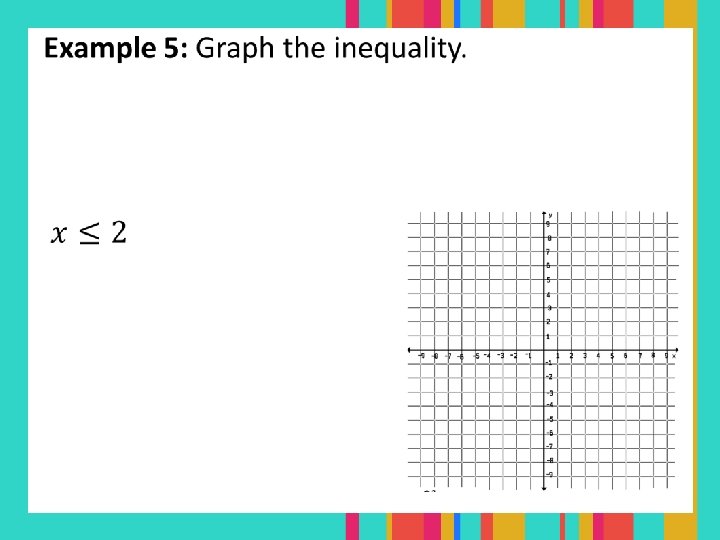
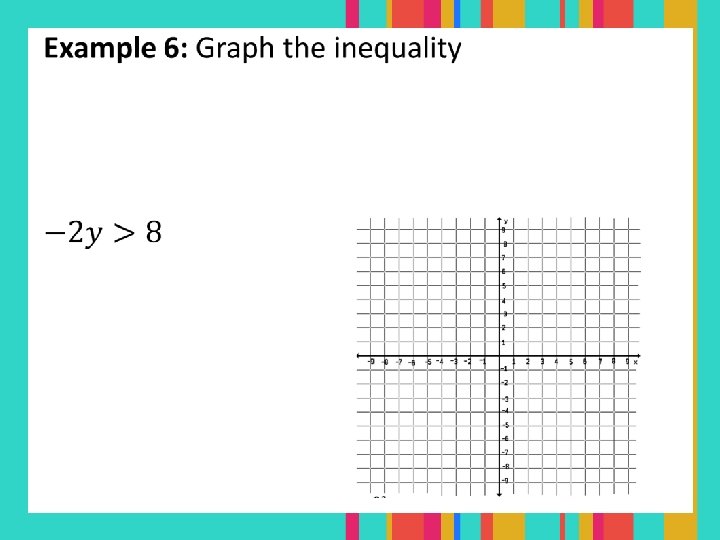
Steps for Graphing Linear Inequalities Plot 2 -3 points on the boundary line. Decide if the boundary line should be SOLID or DASHED. Use a test point to determine which half of plane needs to be shaded. SHADE the half that contains the solution. Don’t forget about HOY VUX!
Example 2
Homework • Worksheet