
HOMEROOM BELLWORK Correlation Vs Causation There is much
HOME-ROOM
BELL-WORK
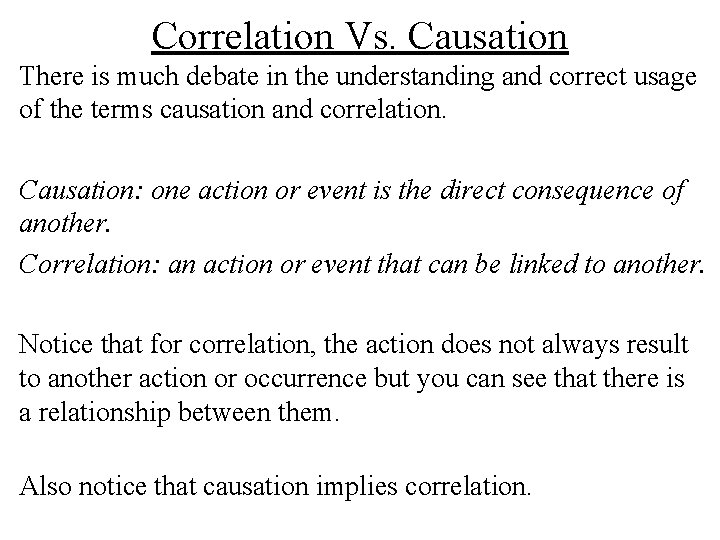
Correlation Vs. Causation There is much debate in the understanding and correct usage of the terms causation and correlation. Causation: one action or event is the direct consequence of another. Correlation: an action or event that can be linked to another. Notice that for correlation, the action does not always result to another action or occurrence but you can see that there is a relationship between them. Also notice that causation implies correlation.
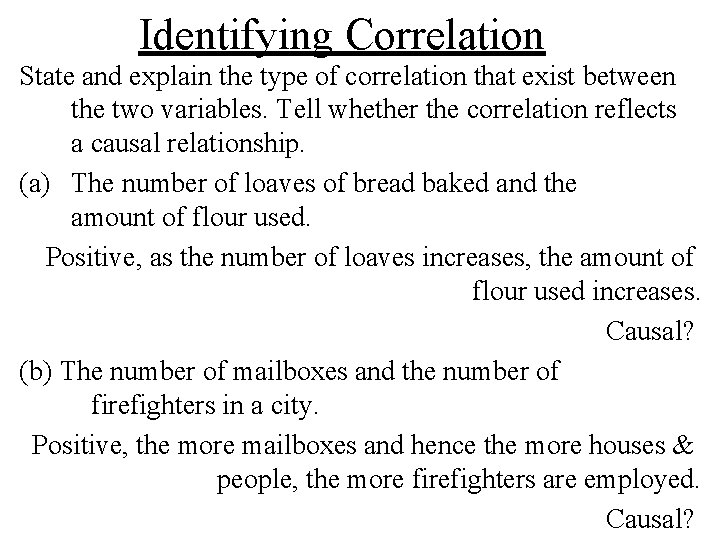
Identifying Correlation State and explain the type of correlation that exist between the two variables. Tell whether the correlation reflects a causal relationship. (a) The number of loaves of bread baked and the amount of flour used. Positive, as the number of loaves increases, the amount of flour used increases. Causal? (b) The number of mailboxes and the number of firefighters in a city. Positive, the more mailboxes and hence the more houses & people, the more firefighters are employed. Causal?
Correlation Vs. Causation Can we say that exposing kids to too much violence on television and films causes them to become violent adults? It is better to say that there is a correlation between watching violent television shows and films and violent behavior. The strength of a correlation is an important aspect to consider especially when trying to determine causation.
The Strength of a Correlation If the data points in a scatter plot lie close to the trend line, the scatter plot shows a strong correlation.
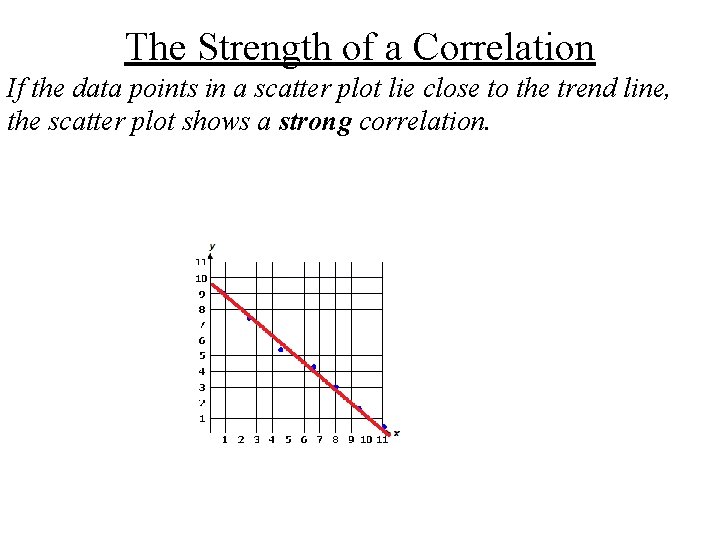
The Strength of a Correlation If the data points in a scatter plot lie close to the trend line, the scatter plot shows a strong correlation.
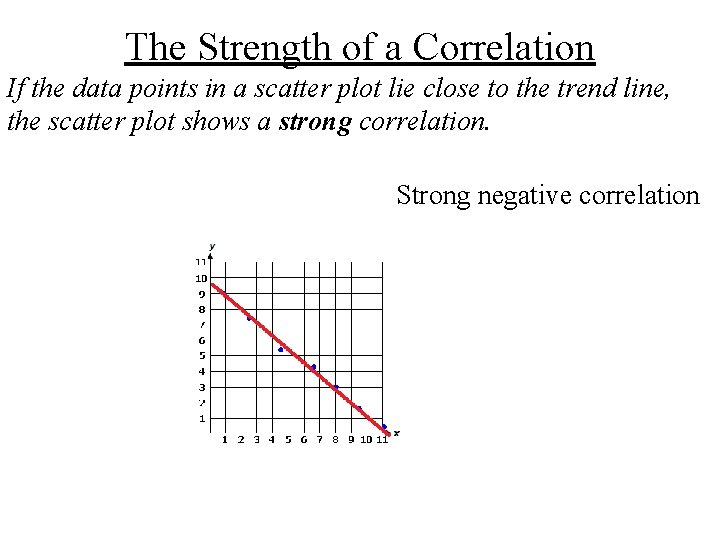
The Strength of a Correlation If the data points in a scatter plot lie close to the trend line, the scatter plot shows a strong correlation. Strong negative correlation
The Strength of a Correlation If the data points in a scatter plot do not lie close to the trend line, the scatter plot shows a weak correlation.
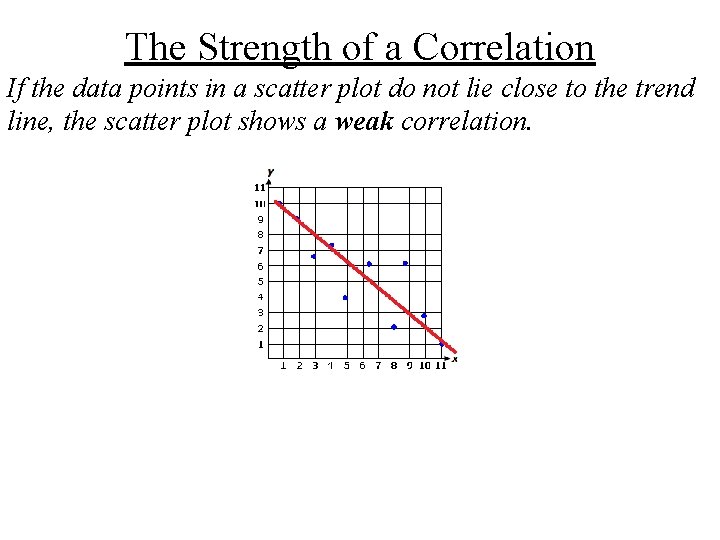
The Strength of a Correlation If the data points in a scatter plot do not lie close to the trend line, the scatter plot shows a weak correlation.
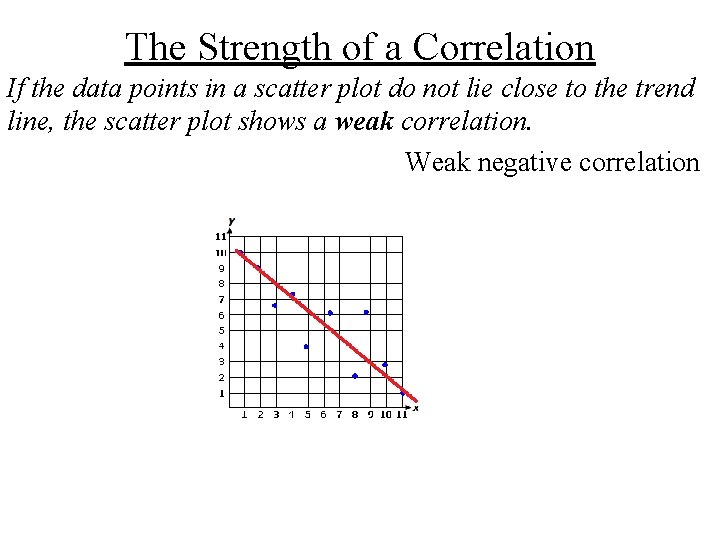
The Strength of a Correlation If the data points in a scatter plot do not lie close to the trend line, the scatter plot shows a weak correlation. Weak negative correlation
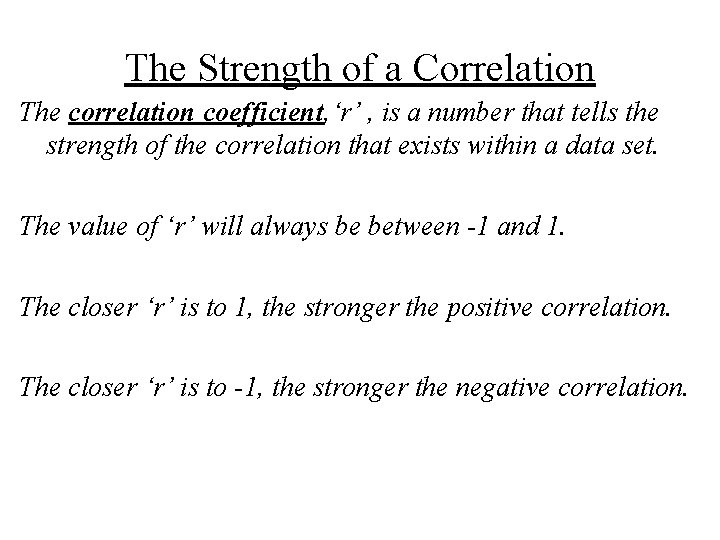
The Strength of a Correlation The correlation coefficient, ‘r’ , is a number that tells the strength of the correlation that exists within a data set. The value of ‘r’ will always be between -1 and 1. The closer ‘r’ is to 1, the stronger the positive correlation. The closer ‘r’ is to -1, the stronger the negative correlation.
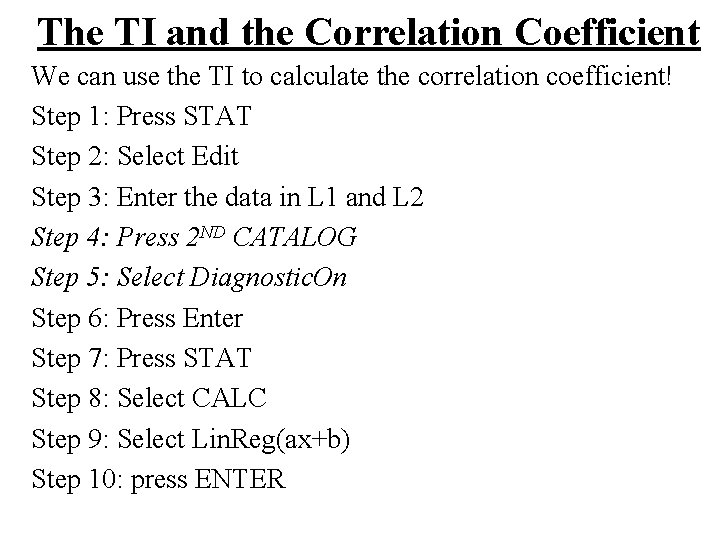
The TI and the Correlation Coefficient We can use the TI to calculate the correlation coefficient! Step 1: Press STAT Step 2: Select Edit Step 3: Enter the data in L 1 and L 2 Step 4: Press 2 ND CATALOG Step 5: Select Diagnostic. On Step 6: Press Enter Step 7: Press STAT Step 8: Select CALC Step 9: Select Lin. Reg(ax+b) Step 10: press ENTER
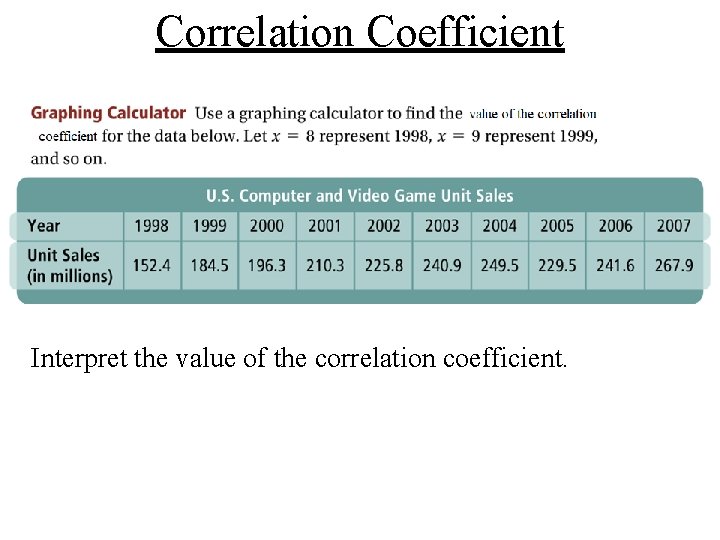
Correlation Coefficient Interpret the value of the correlation coefficient.

Materials Check

IREADY Update

Assessment 3. 5 Return My hand written solutions are on the class website. Please review them and we will discuss them in class tomorrow!
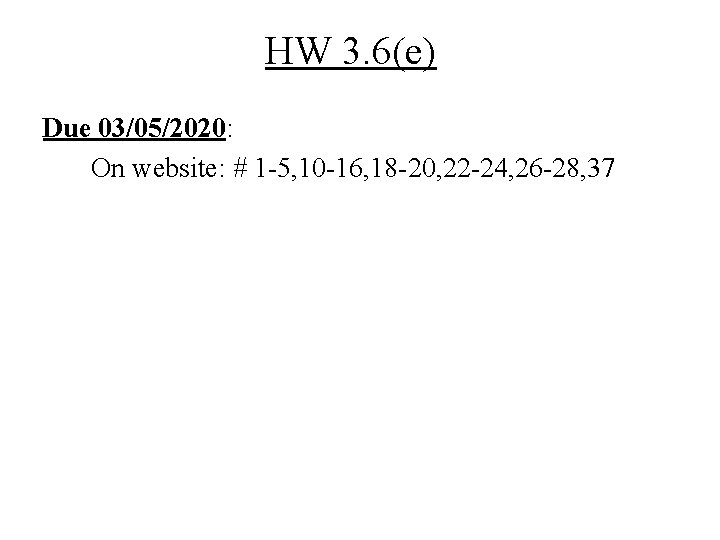
HW 3. 6(e) Due 03/05/2020: On website: # 1 -5, 10 -16, 18 -20, 22 -24, 26 -28, 37
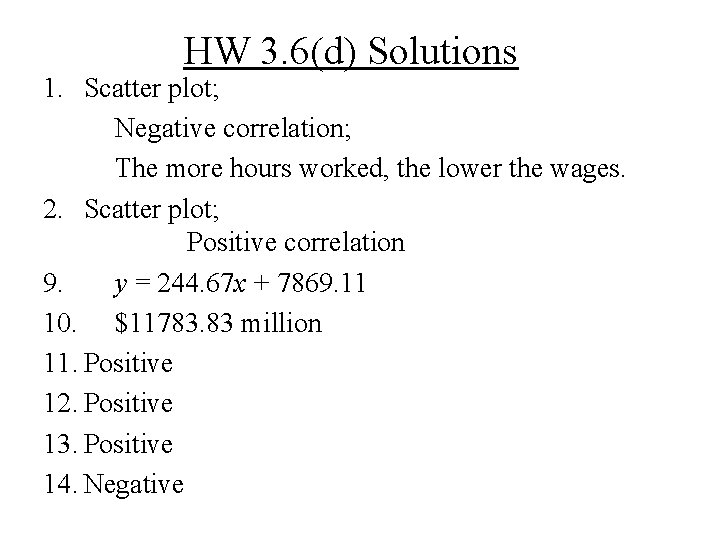
HW 3. 6(d) Solutions 1. Scatter plot; Negative correlation; The more hours worked, the lower the wages. 2. Scatter plot; Positive correlation 9. y = 244. 67 x + 7869. 11 10. $11783. 83 million 11. Positive 12. Positive 13. Positive 14. Negative
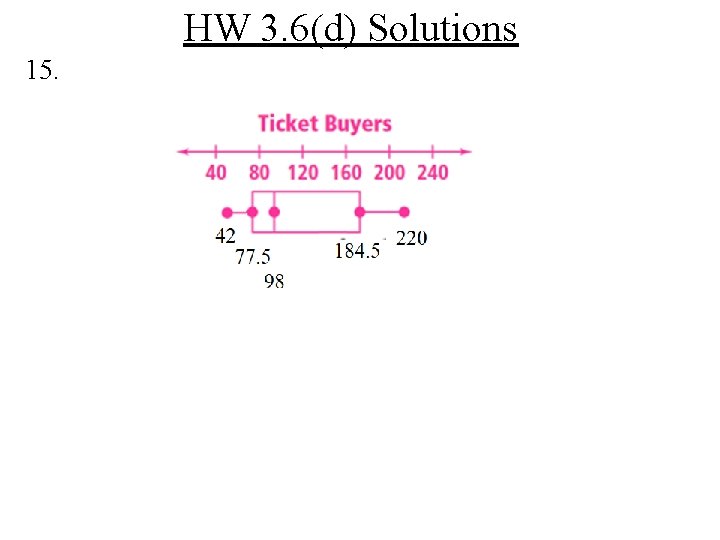
HW 3. 6(d) Solutions 15.
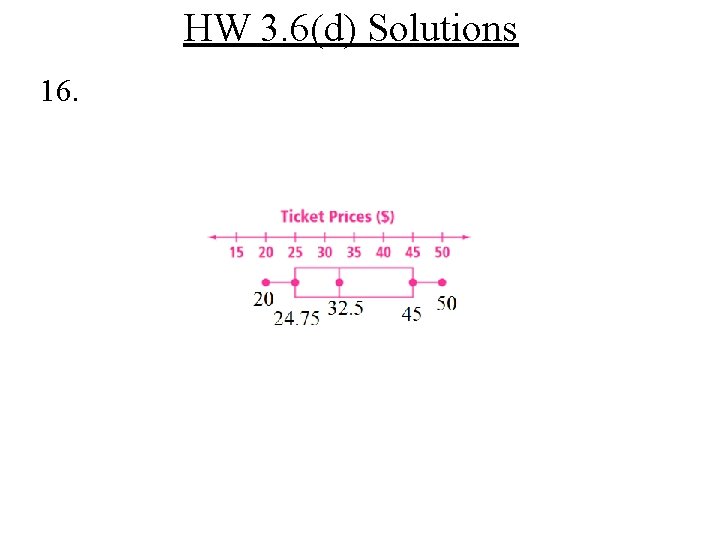
HW 3. 6(d) Solutions 16.
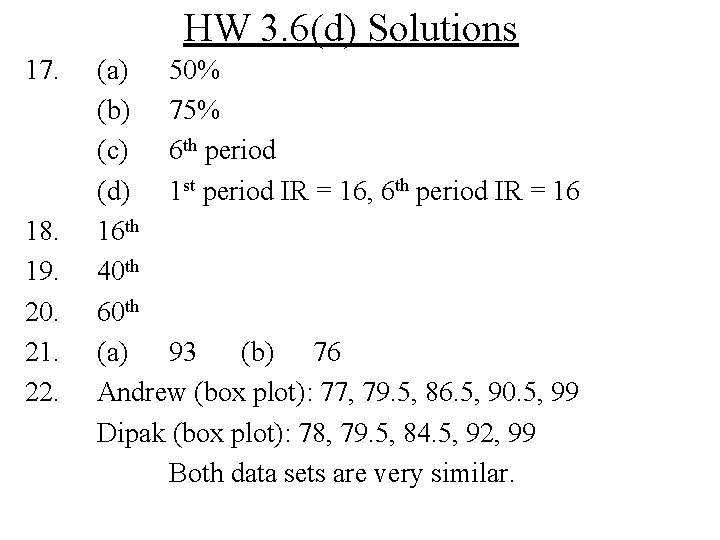
HW 3. 6(d) Solutions 17. 18. 19. 20. 21. 22. (a) 50% (b) 75% (c) 6 th period (d) 1 st period IR = 16, 6 th period IR = 16 16 th 40 th 60 th (a) 93 (b) 76 Andrew (box plot): 77, 79. 5, 86. 5, 90. 5, 99 Dipak (box plot): 78, 79. 5, 84. 5, 92, 99 Both data sets are very similar.
Guiding question: How are rates converted?
Converting Rates Sometimes we need to change the units of comparison in a rate. If we are given a rate, for example in feet per second we may need to convert this rate to miles per hour which is the norm for speed. This process of conversion is known as unit analysis. Let us first look at some common measures.
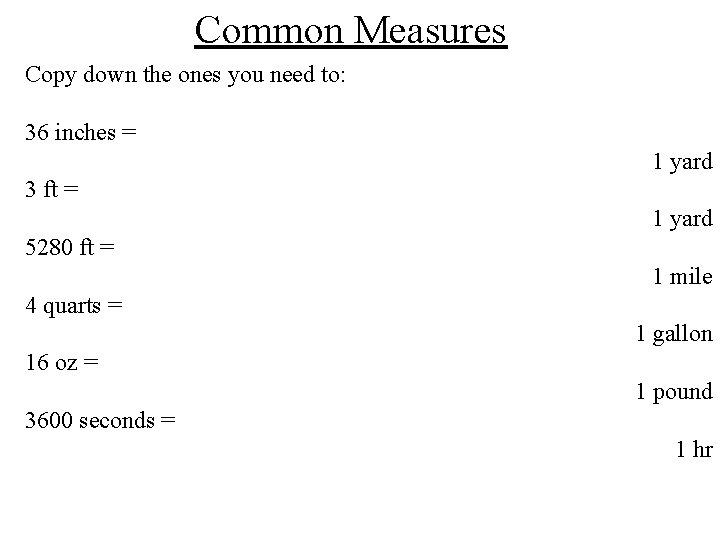
Common Measures Copy down the ones you need to: 36 inches = 1 yard 3 ft = 1 yard 5280 ft = 1 mile 4 quarts = 1 gallon 16 oz = 1 pound 3600 seconds = 1 hr
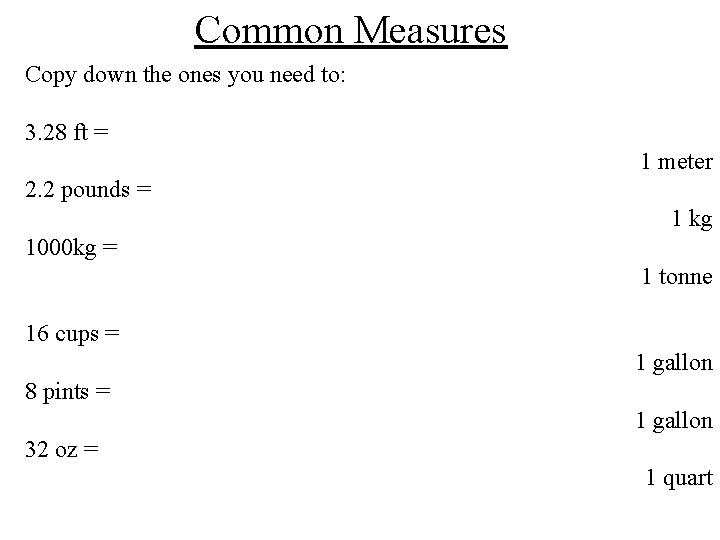
Common Measures Copy down the ones you need to: 3. 28 ft = 1 meter 2. 2 pounds = 1 kg 1000 kg = 1 tonne 16 cups = 1 gallon 8 pints = 1 gallon 32 oz = 1 quart
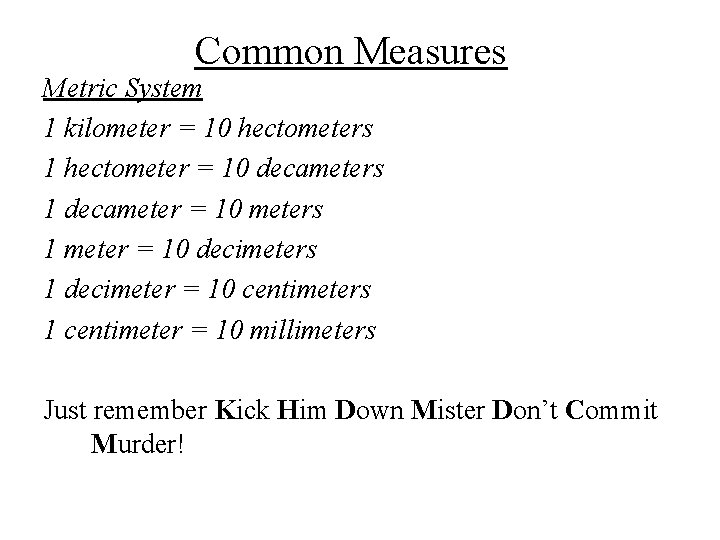
Common Measures Metric System 1 kilometer = 10 hectometers 1 hectometer = 10 decameters 1 decameter = 10 meters 1 meter = 10 decimeters 1 decimeter = 10 centimeters 1 centimeter = 10 millimeters Just remember Kick Him Down Mister Don’t Commit Murder!
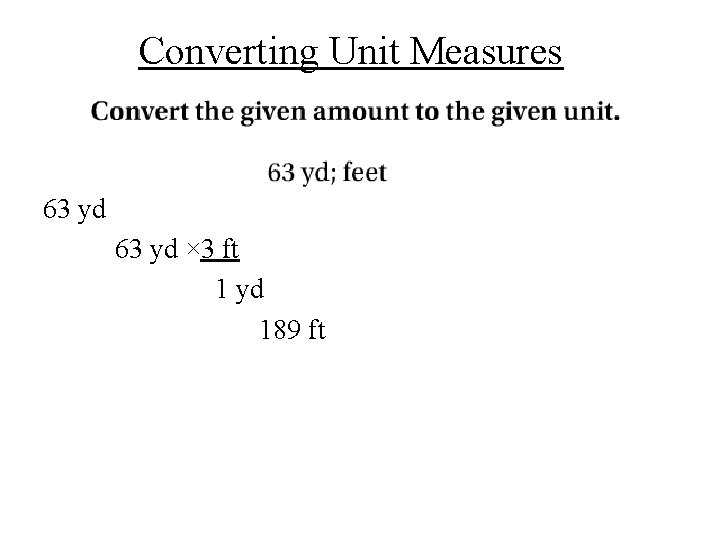
Converting Unit Measures 63 yd × 3 ft 1 yd 189 ft
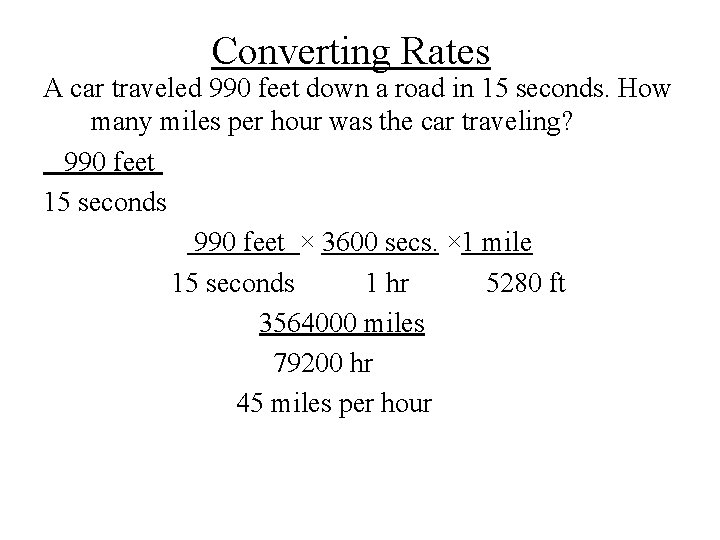
Converting Rates A car traveled 990 feet down a road in 15 seconds. How many miles per hour was the car traveling? 990 feet 15 seconds 990 feet × 3600 secs. × 1 mile 15 seconds 1 hr 5280 ft 3564000 miles 79200 hr 45 miles per hour
Who wants to answer the Guiding question? How are rates converted?
- Slides: 30