hold hold on hold off hold t2pi0 2020
/20; y=cos(t). *exp(-0. 4*t); stem(t,")
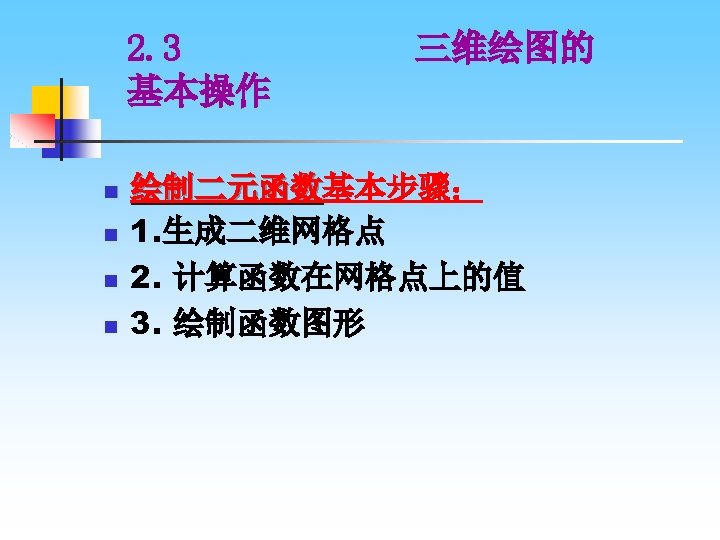
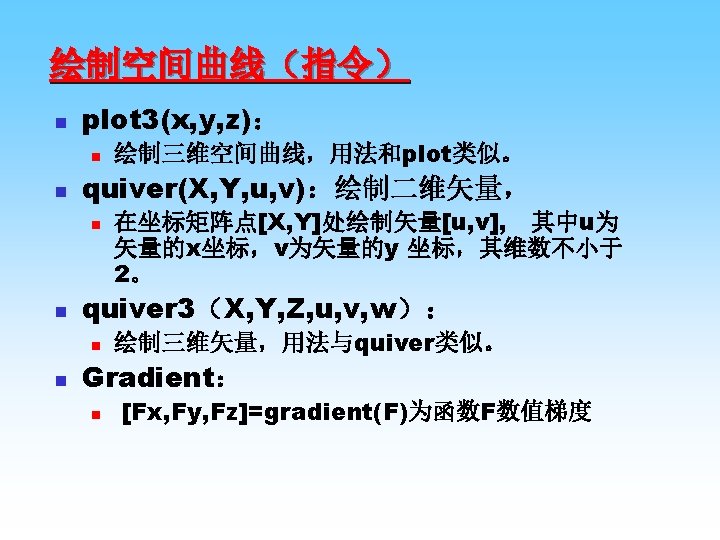
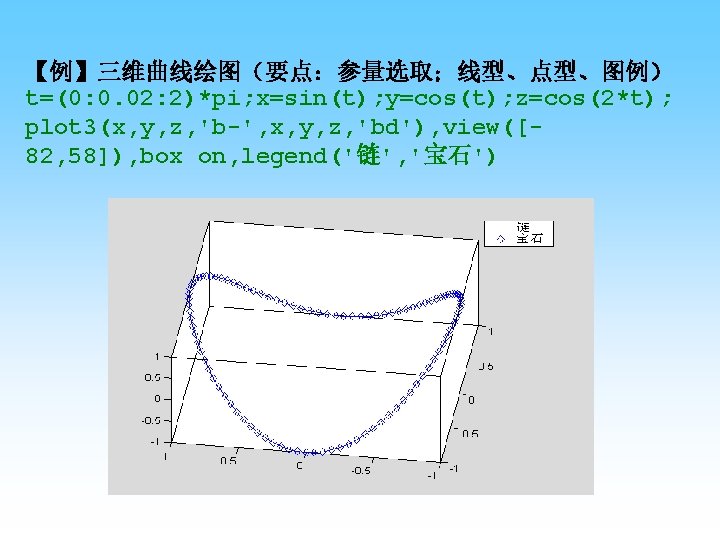
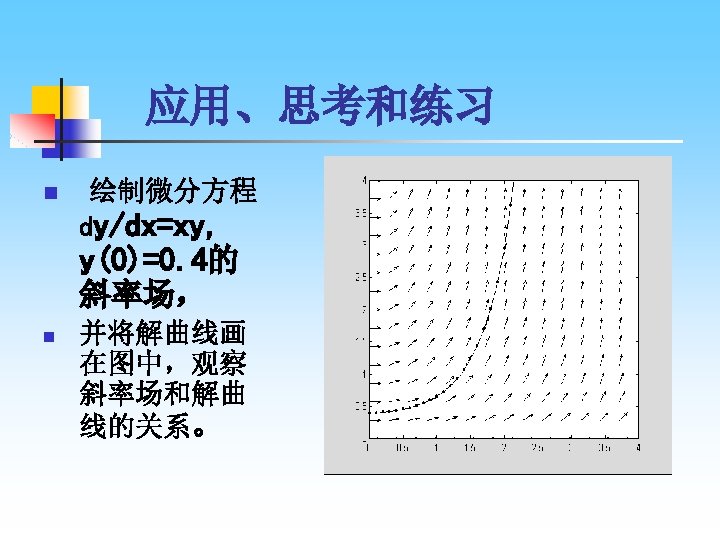
 【例】画出函数 和积分 在区间 上的曲线。")
![例 改变绘图的线型和颜色。 n 程序 n h=plot([0: 0. 1: 2*pi], sin([0: 0. 1: 2*pi])); n](https://slidetodoc.com/presentation_image_h/245b5a83eab90050bda33d34f84dcf4e/image-10.jpg "例 改变绘图的线型和颜色。 n 程序 n h=plot([0: 0. 1: 2*pi], sin([0: 0. 1: 2*pi])); n")
![坐标轴的控制 n n n axis指令 axis([xmin xmax ymin ymax]): 设定二维图形的x和y坐标的范围; axis([xmin xmax ymin ymax](https://slidetodoc.com/presentation_image_h/245b5a83eab90050bda33d34f84dcf4e/image-11.jpg "坐标轴的控制 n n n axis指令 axis([xmin xmax ymin ymax]): 设定二维图形的x和y坐标的范围; axis([xmin xmax ymin ymax")
![【例】用图形表示连续调制波形 及其包络线。 t=(0: pi/100: pi)'; y 1=sin(t)*[1, -1]; y 2=sin(t). *sin(9*t); t 3=pi*(0: 9)/9;](https://slidetodoc.com/presentation_image_h/245b5a83eab90050bda33d34f84dcf4e/image-12.jpg "【例】用图形表示连续调制波形 及其包络线。 t=(0: pi/100: pi)'; y 1=sin(t)*[1, -1]; y 2=sin(t). *sin(9*t); t 3=pi*(0: 9)/9;")
, grid off (不画出分格线) box : box on (坐标呈封闭形式), box")
; plot(x, y) xlabel ('x'), ylabel ('y') legend('y=sin(x)')")
![【例】 clf; t=0: pi/50: 2*pi; y=sin(t); plot(t, y); axis([0, 2*pi, -1. 2, 1. 2])](https://slidetodoc.com/presentation_image_h/245b5a83eab90050bda33d34f84dcf4e/image-16.jpg "【例】 clf; t=0: pi/50: 2*pi; y=sin(t); plot(t, y); axis([0, 2*pi, -1. 2, 1. 2])")
 n n n clf, t=0: 0. 1: 3*pi; alpha=0: 0. 1:")
![【例】采用模型 画一组椭圆。 th = [0: pi/50: 2*pi]'; a = [0. 5: 4. 5]; X](https://slidetodoc.com/presentation_image_h/245b5a83eab90050bda33d34f84dcf4e/image-18.jpg "【例】采用模型 画一组椭圆。 th = [0: pi/50: 2*pi]'; a = [0. 5: 4. 5]; X")
/11*pi; y 1=sin(t 1). *sin(9*t 1); t 2=(0: 100)/100*pi; y 2=sin(t")
 对数绘图:loglog(x, y) 半对数绘图:semilogx(x, y), semilogy(x, y) 【例】 clf; t=0: . 05:")
![若干特殊图形 n n n n x=[1: 10]; y=[5 6 3 4 8 1 10](https://slidetodoc.com/presentation_image_h/245b5a83eab90050bda33d34f84dcf4e/image-24.jpg "若干特殊图形 n n n n x=[1: 10]; y=[5 6 3 4 8 1 10")
; y=linspace(c, d, n);")
![【例】用曲面图表现函数 clf, x=-4: 4; y=x; [X, Y]=meshgrid(x, y); Z=X. ^2+Y. ^2; surf(X, Y, Z);](https://slidetodoc.com/presentation_image_h/245b5a83eab90050bda33d34f84dcf4e/image-29.jpg "【例】用曲面图表现函数 clf, x=-4: 4; y=x; [X, Y]=meshgrid(x, y); Z=X. ^2+Y. ^2; surf(X, Y, Z);")
![【例】用色图阵表现函数的不同特征。演示:当三维网线图、 曲面图的第四个输入宗量取一些特殊矩阵时,色彩就能表现或 加强函数的某特征(如本例的全导数和曲率)。 x=3*pi*(-1: 1/15: 1); y=x; [X, Y]=meshgrid(x, y); R=sqrt(X. ^2+Y. ^2)+eps; Z=sin(R).](https://slidetodoc.com/presentation_image_h/245b5a83eab90050bda33d34f84dcf4e/image-30.jpg "【例】用色图阵表现函数的不同特征。演示:当三维网线图、 曲面图的第四个输入宗量取一些特殊矩阵时,色彩就能表现或 加强函数的某特征(如本例的全导数和曲率)。 x=3*pi*(-1: 1/15: 1); y=x; [X, Y]=meshgrid(x, y); R=sqrt(X. ^2+Y. ^2)+eps; Z=sin(R).")
![三维图形的精细控制 1. 视点控制 View([az, el]) 例: View([-37. 5, 30]) View([vx, vy, vz]) 2. 色彩控制](https://slidetodoc.com/presentation_image_h/245b5a83eab90050bda33d34f84dcf4e/image-32.jpg "三维图形的精细控制 1. 视点控制 View([az, el]) 例: View([-37. 5, 30]) View([vx, vy, vz]) 2. 色彩控制")
: 自动注释 clabel(h, 'manual') : 用鼠标选 择添加数字的位置. xm=-2:")
![Contour命令可以用来绘制隐函数的图形 clear, clf xm=-3: . 2: 3; ym=-2: . 2: 1; [x, y]=meshgrid(xm, ym);](https://slidetodoc.com/presentation_image_h/245b5a83eab90050bda33d34f84dcf4e/image-35.jpg "Contour命令可以用来绘制隐函数的图形 clear, clf xm=-3: . 2: 3; ym=-2: . 2: 1; [x, y]=meshgrid(xm, ym);")
 n exp 2_2. m n clf, t=linspace(0, 1. 5, 20); x=t. ^2;")
*cos(sqrt(3)/2*t); s=subs(int(y, t,")
 ezsurf(F, dom-f, ’circ’) ezsurf(x, y, z, dom-st, ngrid) ezsurf(x, y,")
![【例】使用球坐标参量画部分球壳。 x='cos(s)*cos(t)'; y='cos(s)*sin(t)'; z='sin(s)'; ezsurf(x, y, z, [0, pi/2, 0, 3*pi/2]) view(17, 40); shading](https://slidetodoc.com/presentation_image_h/245b5a83eab90050bda33d34f84dcf4e/image-46.jpg "【例】使用球坐标参量画部分球壳。 x='cos(s)*cos(t)'; y='cos(s)*sin(t)'; z='sin(s)'; ezsurf(x, y, z, [0, pi/2, 0, 3*pi/2]) view(17, 40); shading")
)-sin(y)') ezcontourf 画填色等位线 ezmesh 画网线图, ezmesh ('exp(-s)*cos(t)', 'exp(-s)*sin(t) ', 't', [0,")
![2. 6 影片动画 【例】三维图形的影片动画。 clf; shg, x=3*pi*(-1: 0. 05: 1); y=x; [X, Y]=meshgrid(x, y);](https://slidetodoc.com/presentation_image_h/245b5a83eab90050bda33d34f84dcf4e/image-48.jpg "2. 6 影片动画 【例】三维图形的影片动画。 clf; shg, x=3*pi*(-1: 0. 05: 1); y=x; [X, Y]=meshgrid(x, y);")
- Slides: 49
多次叠绘 hold :hold on, hold off 【例】利用hold绘制离散信号通过零阶保持器后产生的波形。 t=2*pi*(0: 20)/20; y=cos(t). *exp(-0. 4*t); stem(t, y, 'g'); hold on; stairs(t, y, 'r'); hold off
双纵坐标图 plotyy(x 1, y 1, x 2, y 2) 【例】画出函数 和积分 在区间 上的曲线。 clf; dx=0. 1; x=0: dx: 4; y=x. *sin(x); s=cumtrapz(y)*dx; plotyy(x, y, x, s), text(0. 5, 0, 'fontsize{14}ity=xsinx') text(2. 5, 3. 5, ['fontsize{14}its=', sint, 'fontsize{14 }itxsinxdx']) cumtrapz:求累计积分 text:标识内容的位置
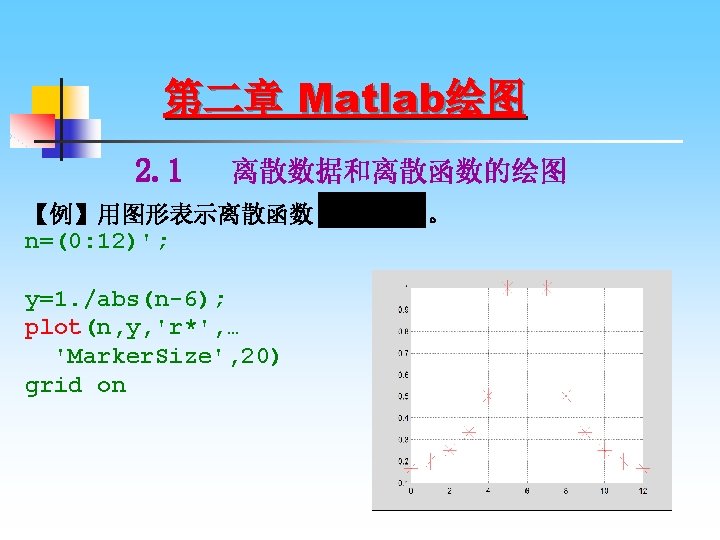
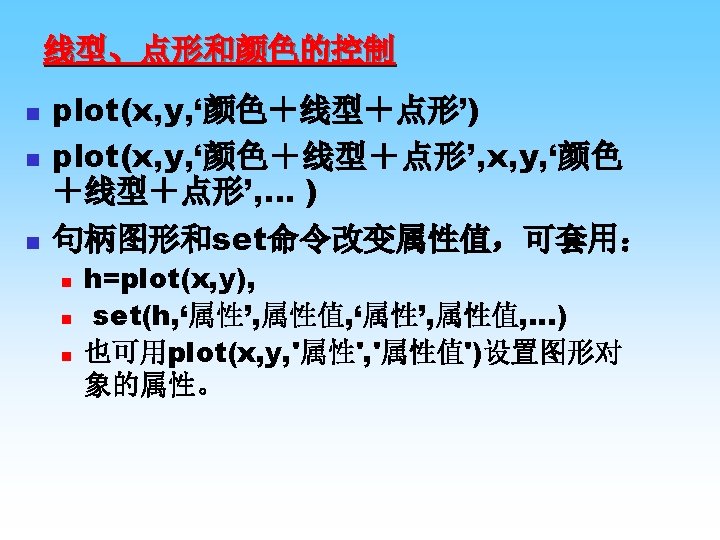
例 改变绘图的线型和颜色。 n 程序 n h=plot([0: 0. 1: 2*pi], sin([0: 0. 1: 2*pi])); n set(h, 'Line. Width', 5, 'color', 'red'); 【例】用图形表示离散函数 。 n=(0: 12)'; y=1. /abs(n-6); plot(n, y, 'r*', … 'Marker. Size', 20) grid on
坐标轴的控制 n n n axis指令 axis([xmin xmax ymin ymax]): 设定二维图形的x和y坐标的范围; axis([xmin xmax ymin ymax zmin ymax]): 设定三维图形的坐标范围 ; 其 中 xmin<x<xmax, ymin<y<ymax , zmin<z<zmax。 axis: axis on(使用轴背景), axis off(取消轴背景) axis equal, axis fill, axis image, axis normal, axis square, axis tight, axis vis 3 d
【例】用图形表示连续调制波形 及其包络线。 t=(0: pi/100: pi)'; y 1=sin(t)*[1, -1]; y 2=sin(t). *sin(9*t); t 3=pi*(0: 9)/9; y 3=sin(t 3). *sin(9*t 3); plot(t, y 1, 'r: ', t, y 2, 'b' , t 3, y 3, 'bo') axis([0, pi, -1, 1])
分格线和坐标框 grid: grid on(画出分格线), grid off (不画出分格线) box : box on (坐标呈封闭形式), box off (坐标呈开启形式) 【例】 n=(0: 12)'; y=1. /abs(n-6); Subplot(1, 2, 1), plot(n, y, 'r*', 'Marker. Size', 20), box on Subplot(1, 2, 2), plot(n, y, 'r*', 'Marker. Size', 20), box off
例: x=0: 0. 05: 5; y=sin(x); plot(x, y) xlabel ('x'), ylabel ('y') legend('y=sin(x)') clf; 例: clf; x=0: 0. 05: 5; y=sin(x); plot(x, y) gtext('y=sin(x)')
【例】 clf; t=0: pi/50: 2*pi; y=sin(t); plot(t, y); axis([0, 2*pi, -1. 2, 1. 2]) text(pi/2, 1, 'leftarrowit{sin(t)}极 大 � ', 'fontsize', 18, 'color', 'r') 注:图形中文本的颜色和字号可以改变
绘制平面曲线(程序讲解,exp 2_1. m) n n n clf, t=0: 0. 1: 3*pi; alpha=0: 0. 1: 3*pi; plot(t, sin(t), 'r-'); hold on; plot(alpha, 3*exp(0. 5*alpha), 'k: '); xlabel('it{t(deg)}'); ylabel('it{magnitude}'); title(' it{sine wave and {it{Ae}}^{-alpha{itt}}wave}');
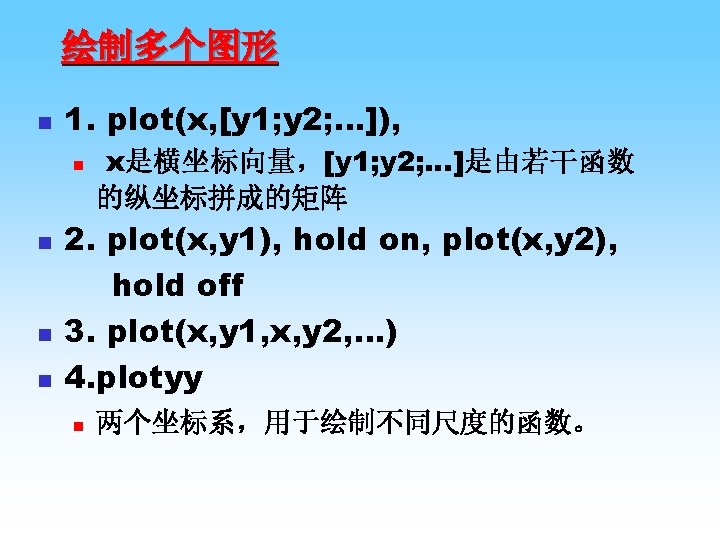
【例】采用模型 画一组椭圆。 th = [0: pi/50: 2*pi]'; a = [0. 5: 4. 5]; X = cos(th)*a; Y = sin(th)*sqrt(25 -a. ^2); plot(X, Y) axis('equal') xlabel('x'), ylabel('y') title('A set of Ellipses')
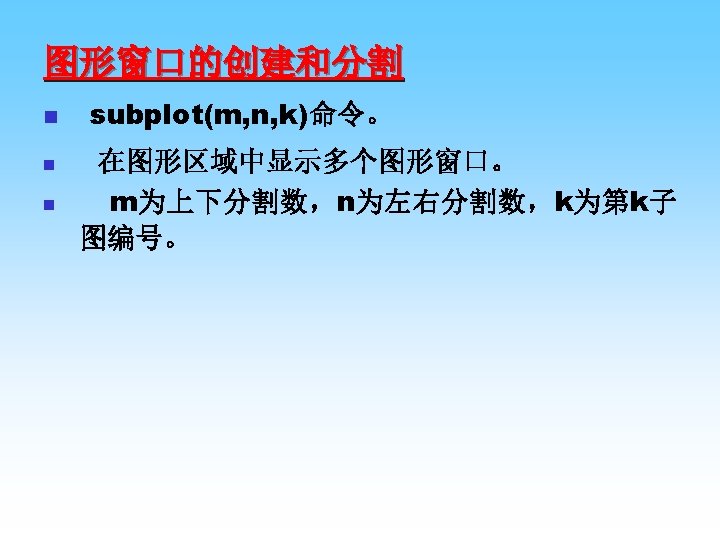
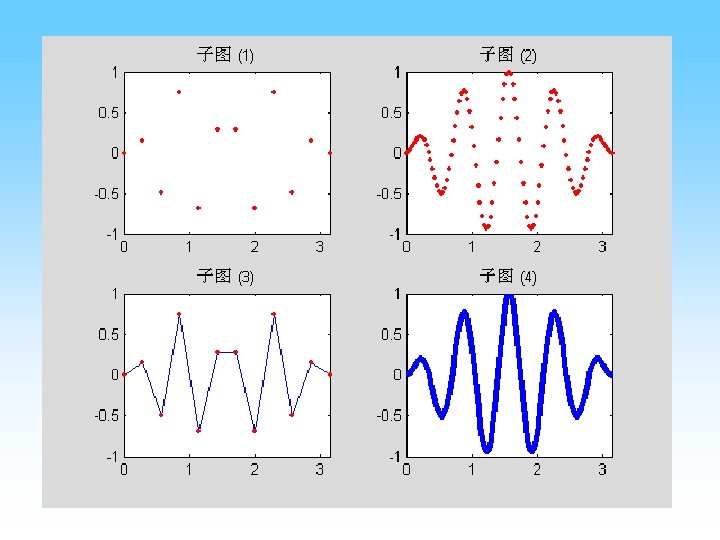
【例】用图形表示连续调制波形 t 1=(0: 11)/11*pi; y 1=sin(t 1). *sin(9*t 1); t 2=(0: 100)/100*pi; y 2=sin(t 2). *sin(9*t 2); subplot(2, 2, 1), plot(t 1, y 1, 'r. '), axis([0, pi, -1, 1]), title('子图 (1)') subplot(2, 2, 2), plot(t 2, y 2, 'r. '), axis([0, pi, -1, 1]), title('子图 (2)') subplot(2, 2, 3), plot(t 1, y 1, 'r. ') axis([0, pi, -1, 1]), title('子图 (3)') subplot(2, 2, 4), plot(t 2, y 2, 'linewidth', 4) axis([0, pi, -1, 1]), title('子图 (4)')
其它绘图命令 极坐标绘图:polar(x, y) 对数绘图:loglog(x, y) 半对数绘图:semilogx(x, y), semilogy(x, y) 【例】 clf; t=0: . 05: pi+. 01; clf; t=0. 1: 3; y=sin(3*t). *exp(-0. 3*t); y=exp(t. *t); polar(t, y) semilogy(t, y) title('polar plot') grid xlabel('t'); ylabel('exp(t. *t) ');
若干特殊图形 n n n n x=[1: 10]; y=[5 6 3 4 8 1 10 3 5 6]; subplot(2, 3, 1), bar(x, y), axis([1 10 1 11]) subplot(2, 3, 2), hist(y, x), axis([1 10 1 4]) subplot(2, 3, 3), stem(x, y, 'k'), axis([1 10 1 11]) subplot(2, 3, 4), stairs(x, y, 'k'), axis([1 10 1 11]) subplot(2, 3, 5), x = [1 3 0. 5 5]; explode = [0 0 0 1]; pie(x, explode) subplot(2, 3, 6), z=0: 0. 1: 100; x=sin(z); y=cos(z). *10; comet 3(x, y, z)
meshgrid指令:生成网格点 a=-0. 98; b=0. 98; c=-1; d=1; n=10; nx=linspace(a, b, n); y=linspace(c, d, n); n[X, Y]=meshgrid(x, y); nplot(X, Y, '+') n xm=[0 1 2]; ym=[1 2 3]; [x, y]=meshgrid(xm, ym);
【例】用曲面图表现函数 clf, x=-4: 4; y=x; [X, Y]=meshgrid(x, y); Z=X. ^2+Y. ^2; surf(X, Y, Z); hold on, colormap(hot), hold on, stem 3(X, Y, Z, 'bo') 注:meshgrid通过一维数组生成二维阵列
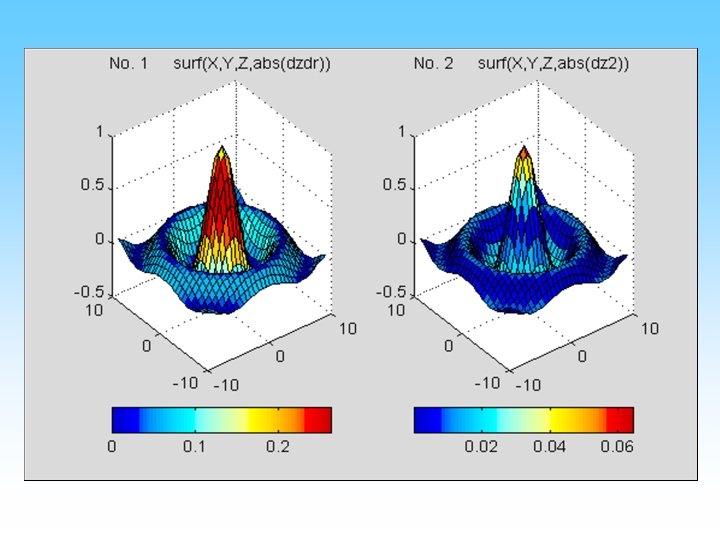
【例】用色图阵表现函数的不同特征。演示:当三维网线图、 曲面图的第四个输入宗量取一些特殊矩阵时,色彩就能表现或 加强函数的某特征(如本例的全导数和曲率)。 x=3*pi*(-1: 1/15: 1); y=x; [X, Y]=meshgrid(x, y); R=sqrt(X. ^2+Y. ^2)+eps; Z=sin(R). /R; [dzdx, dzdy]=gradient(Z); dzdr=sqrt(dzdx. ^2+dzdy. ^2); dz 2=del 2(Z); subplot(1, 2, 1), surf(X, Y, Z, abs(dzdr)) shading faceted; brighten(0. 6); colorbar('horiz') title('No. 1 surf(X, Y, Z, abs(dzdr))') subplot(1, 2, 2), surf(X, Y, Z, abs(dz 2)) shading faceted; colorbar('horiz') title('No. 2 surf(X, Y, Z, abs(dz 2))')
三维图形的精细控制 1. 视点控制 View([az, el]) 例: View([-37. 5, 30]) View([vx, vy, vz]) 2. 色彩控制 用色风格 colordef(fig, options), options=white, black 色图 colormap(CM), CM=hot, jet, cool, …
绘等值线图 clear, clc, clf, axis square clabel(h): 自动注释 clabel(h, 'manual') : 用鼠标选 择添加数字的位置. xm=-2: . 2: 2; ym=-2: . 2: 2; [x, y]=meshgrid(xm, ym); z=x. *exp(-x. ^2 -y. ^2); zmax=max(z)); zmin=min(z)); dz=(zmax-zmin)/10; level=(zmin+0. 5*dz): dz: zmax; %[c, h]=contour(x, y, z); clabel(c, h) h=contour(x, y, z, level); clabel(h) %h=contour(x, y, z, level); clabel(h, 'manual') title('contour plot by contour(x, y, z, level)'), xlabel('x'), ylabel('y')
Contour命令可以用来绘制隐函数的图形 clear, clf xm=-3: . 2: 3; ym=-2: . 2: 1; [x, y]=meshgrid(xm, ym); f=y. ^3+exp(y)-tanh(x); contour(x, y, f, [0, 0]) xlabel('x'), ylabel('y')
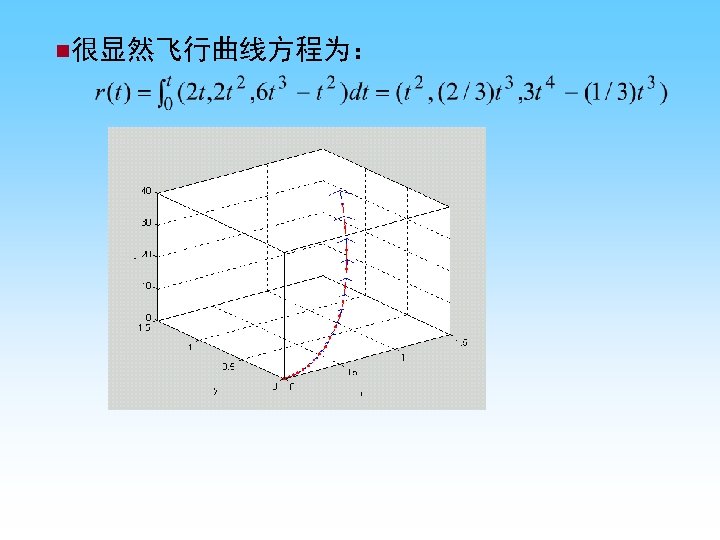
(程序讲解exp 2_2) n exp 2_2. m n clf, t=linspace(0, 1. 5, 20); x=t. ^2; y=(2/3)*t. ^3; z=(6/4)*t. ^4 -(1/3)*t. ^3; plot 3(x, y, z, 'r. ', 'linewidth', 1, 'markersize', 10), hold on Vx=gradient(x); Vy=gradient(y); Vz=gradient (z); h=quiver 3(x, y, z, Vx, Vy, Vz), set(h, 'linewidth', 1), grid on axis([0 1. 5 0 40]) xlabel('x'), ylabel('y'), zlabel('z'),box on n 运行程序 n n n
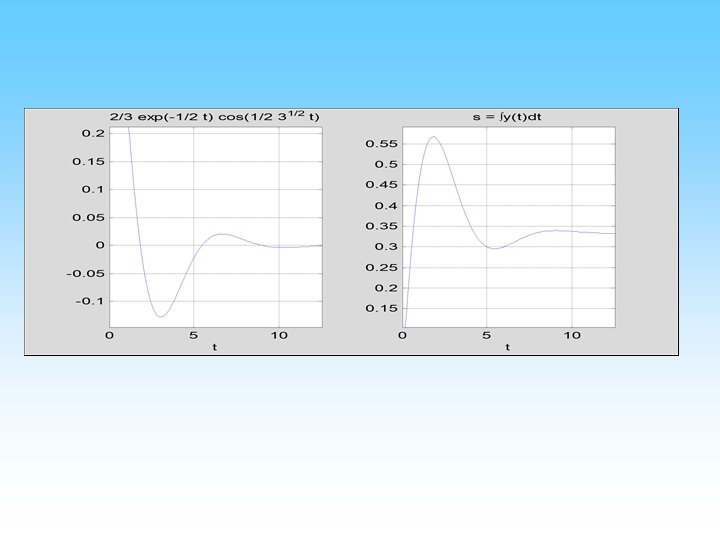
2. 5 函数绘图的简捷指令 一元函数简捷绘图指令 【例】绘制 和它的积分 在 间的图形。 syms t tao; y=2/3*exp(-t/2)*cos(sqrt(3)/2*t); s=subs(int(y, t, 0, tao), tao, t); subplot(1, 2, 1), ezplot(y, [0, 4*pi]); grid subplot(1, 2, 2), ezplot(s, [0, 4*pi]); grid title('s = inty(t)dt')
二元函数简捷绘图指令 ezsurf(F, dom-f, ngrid) ezsurf(F, dom-f, ’circ’) ezsurf(x, y, z, dom-st, ngrid) ezsurf(x, y, z, dom-st, ’circ’) 【例】在园域上画 的图形。 ezsurf('x*y', 'circ'); shading flat; view([-18, 28])
【例】使用球坐标参量画部分球壳。 x='cos(s)*cos(t)'; y='cos(s)*sin(t)'; z='sin(s)'; ezsurf(x, y, z, [0, pi/2, 0, 3*pi/2]) view(17, 40); shading interp; colormap(spring) light('position', [0, 0, -10], 'style', 'local') light('position', [-1, -0. 5, 2], 'style', 'local') material([0. 5, 10, 0. 3])
简捷绘图指令汇总 ezcontour 画等位线, ezcontour('cos(x+sin(y))-sin(y)') ezcontourf 画填色等位线 ezmesh 画网线图, ezmesh ('exp(-s)*cos(t)', 'exp(-s)*sin(t) ', 't', [0, 8, 0, 4*pi]) ezmeshc 画带等位线的网线图, ezmeshc('y/(1+x^2+y^2)', [-5, 5, -2*pi, 2*pi]) ezplot 画二维曲线, ezplot('1/y-log(y)+log(-1+y)+x-1') ezplot 3 画三维曲线 ezplot 3('sin(3*t)*cos(t)', 'sin(3*t)*sin(t)', 't', 'animate') ezpolar 画极坐标曲线, ezpolar('sin(tan(t))') ezsurf 画曲面图 ezsurfc 画带等位线的曲面图, ezsurfc('sin(x)*sin(y)')
2. 6 影片动画 【例】三维图形的影片动画。 clf; shg, x=3*pi*(-1: 0. 05: 1); y=x; [X, Y]=meshgrid(x, y); R=sqrt(X. ^2+Y. ^2)+eps; Z=sin(R). /R; h=surf(X, Y, Z); colormap(jet); axis off n=12; mmm=moviein(n); for i=1: n rotate(h, [0 0 1], 25); mmm(: , i)=getframe; end movie(mmm, 5, 10)