
HMI 7530 Programming in R STATISTICS MODULE Basic
HMI 7530– Programming in R STATISTICS MODULE: Basic Data Analysis Jennifer Lewis Priestley, Ph. D. Kennesaw State University
STATISTICS MODULE ü Basic Descriptive Statistics and Confidence Intervals ü Basic Visualizations ü Histograms ü Pie Charts ü Bar Charts ü Scatterplots ü Ttests ü One Sample ü Paired ü Independent Two Sample ü ANOVA ü Chi Square and Odds ü Regression Basics 2 2
Statistics Module: Descriptive Statistics Center, or where do we find most of the data Distribution or shape, such as a bell shaped curve Variation or dispersion, how far spread out is the data, on average, how far are observations from the center? Outliers…do we have points that are so unusual that we need to address them separately? 3 3
Statistics Module: Descriptive Statistics The “center” of a data set can be described using three different measures: 1. Mean – the commonly known “average” 2. Median – the midpoint 3. Mode – the most frequently occurring value Without any additional information, the “center” of the data is the expected value of any observation pulled at random. 4 4
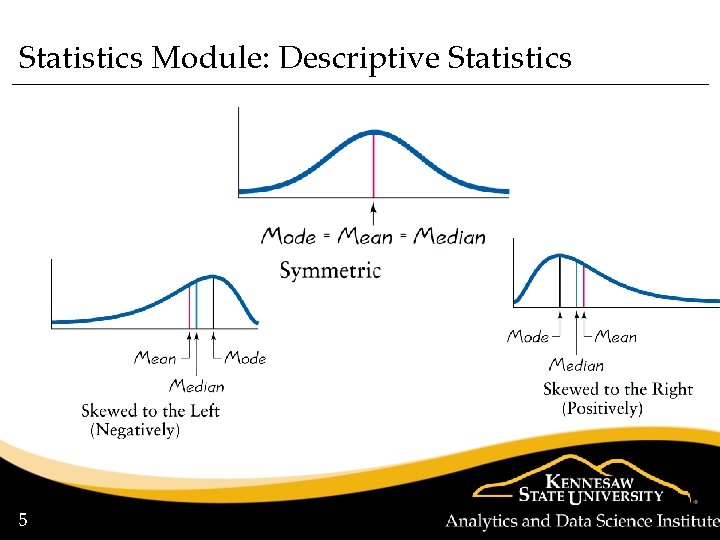
Statistics Module: Descriptive Statistics 5 5
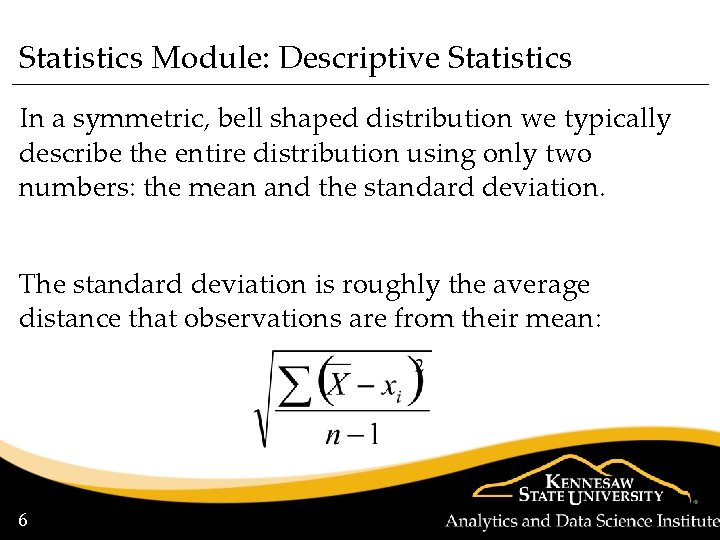
Statistics Module: Descriptive Statistics In a symmetric, bell shaped distribution we typically describe the entire distribution using only two numbers: the mean and the standard deviation. The standard deviation is roughly the average distance that observations are from their mean: 6 6
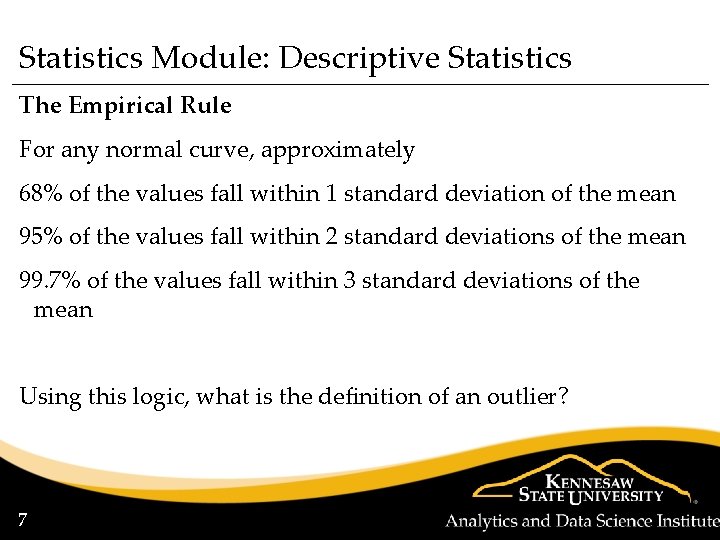
Statistics Module: Descriptive Statistics The Empirical Rule For any normal curve, approximately 68% of the values fall within 1 standard deviation of the mean 95% of the values fall within 2 standard deviations of the mean 99. 7% of the values fall within 3 standard deviations of the mean Using this logic, what is the definition of an outlier? 7 7
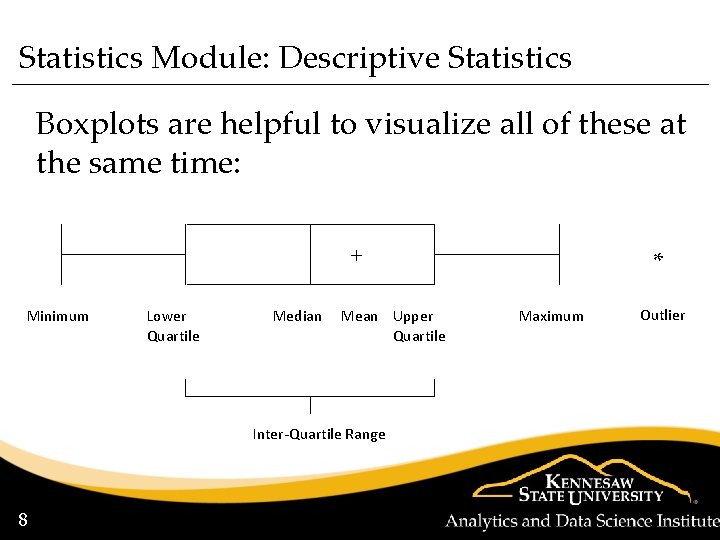
Statistics Module: Descriptive Statistics Boxplots are helpful to visualize all of these at the same time: + Minimum Lower Quartile Median Mean Upper Quartile * Maximum Inter-Quartile Range 8 8 Outlier
Statistics Module: Descriptive Statistics When developing a visual representation of a single variable, the most common tools are – Histograms, Pie Charts, Bar Charts, Box Plots and Stem and Leaf Plots. Visualizations are as much a part of the data discovery process as descriptive statistics. These visualizations will be addressed in a separate set of notes. 9 9
- Slides: 9