
History May Not Repeat But It Does Rhyme

History May Not Repeat, But It Does Rhyme* Looking at the 2000 s through a 1930 s Lens *Mark Twain Mark D. Vaughan American University / Economics 639
Disclaimer The views expressed are mine alone and do not represent official positions of the: § National Credit Union Administration Don’t look for a hidden political agenda either! Ghost of Career Past Vaughan - Eco 639 2 - 26
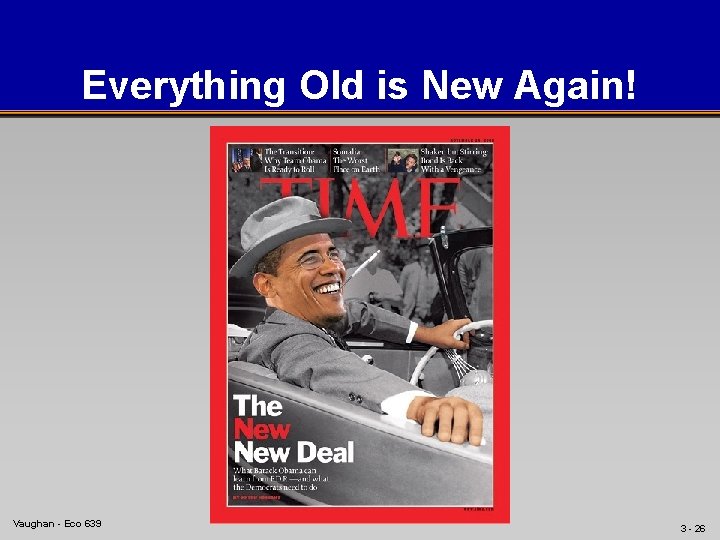
Everything Old is New Again! Vaughan - Eco 639 3 - 26
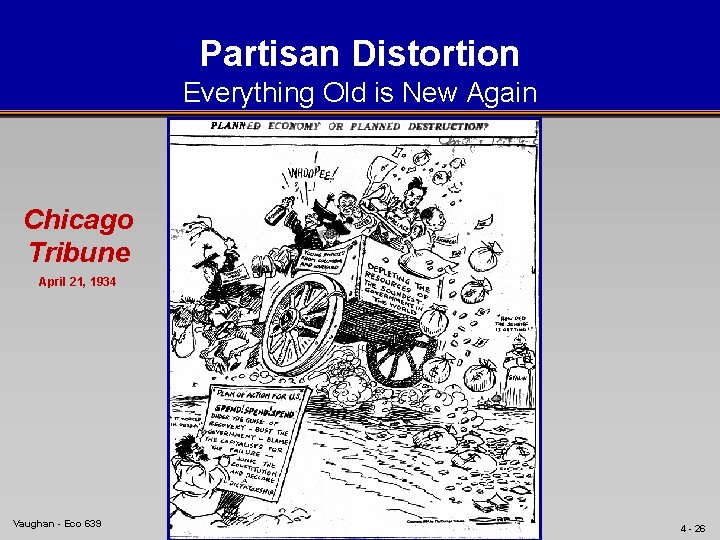
Partisan Distortion Everything Old is New Again Chicago Tribune April 21, 1934 Vaughan - Eco 639 4 - 26
Great Depression vs. Great Recession Interesting Similarities § Both preceded by good economic times. 1921 -29: Annual real GNP growth = 4. 4% (2 mild recessions) 1982 -2007: Annual real GNP growth = 3. 2% (2 mild recessions) § Both preceded by era in which Fed was highly regarded. § Both preceded by movement of banks into new business lines. 1920 s: Banks ramped up real-estate lending/investment banking. 1990 s-2000 s: Banks ramped up real-estate lending/securitization. § Both preceded by innovations in consumer finance. 1920 s: Installment credit 2000 s: Mortgage/credit-card lending driven by credit-scoring/securitization Vaughan - Eco 639 5 - 26
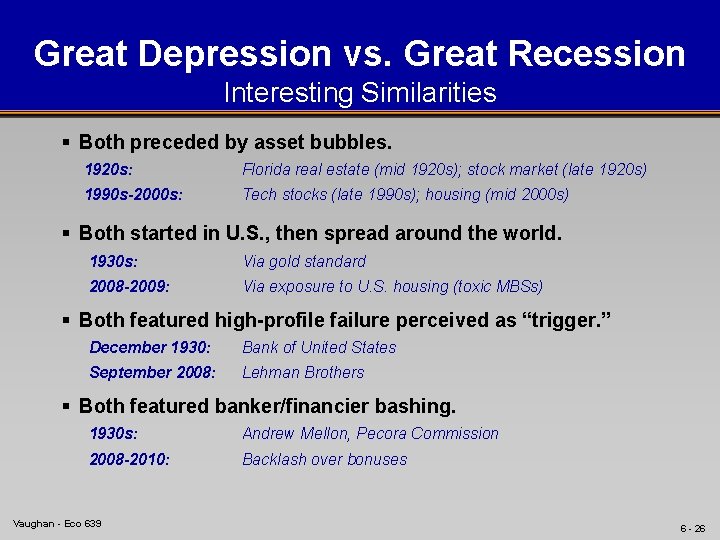
Great Depression vs. Great Recession Interesting Similarities § Both preceded by asset bubbles. 1920 s: Florida real estate (mid 1920 s); stock market (late 1920 s) 1990 s-2000 s: Tech stocks (late 1990 s); housing (mid 2000 s) § Both started in U. S. , then spread around the world. 1930 s: Via gold standard 2008 -2009: Via exposure to U. S. housing (toxic MBSs) § Both featured high-profile failure perceived as “trigger. ” December 1930: Bank of United States September 2008: Lehman Brothers § Both featured banker/financier bashing. 1930 s: Andrew Mellon, Pecora Commission 2008 -2010: Backlash over bonuses Vaughan - Eco 639 6 - 26
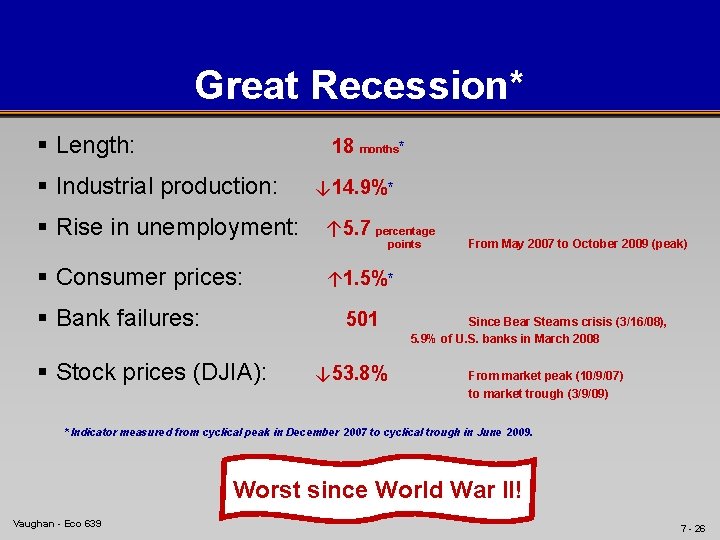
Great Recession* § Length: 18 months* § Industrial production: ↓ 14. 9%* § Rise in unemployment: ↑ 5. 7 percentage § Consumer prices: ↑ 1. 5%* § Bank failures: points 501 § Stock prices (DJIA): ↓ 53. 8% From May 2007 to October 2009 (peak) Since Bear Stearns crisis (3/16/08), 5. 9% of U. S. banks in March 2008 From market peak (10/9/07) to market trough (3/9/09) * Indicator measured from cyclical peak in December 2007 to cyclical trough in June 2009. Worst since World War II! Vaughan - Eco 639 7 - 26
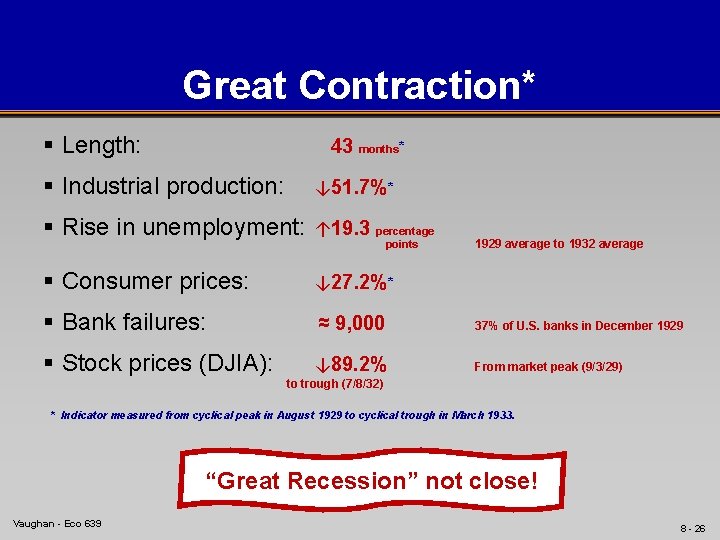
Great Contraction* § Length: 43 months* § Industrial production: ↓ 51. 7%* § Rise in unemployment: ↑ 19. 3 § Consumer prices: ↓ 27. 2%* § Bank failures: ≈ 9, 000 § Stock prices (DJIA): ↓ 89. 2% percentage points 1929 average to 1932 average 37% of U. S. banks in December 1929 From market peak (9/3/29) to trough (7/8/32) * Indicator measured from cyclical peak in August 1929 to cyclical trough in March 1933. “Great Recession” not close! Vaughan - Eco 639 8 - 26
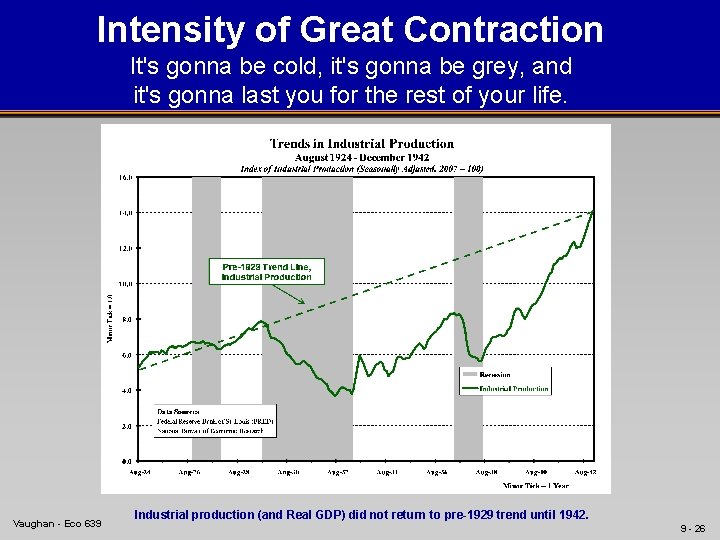
Intensity of Great Contraction It's gonna be cold, it's gonna be grey, and it's gonna last you for the rest of your life. Vaughan - Eco 639 Industrial production (and Real GDP) did not return to pre-1929 trend until 1942. 9 - 26
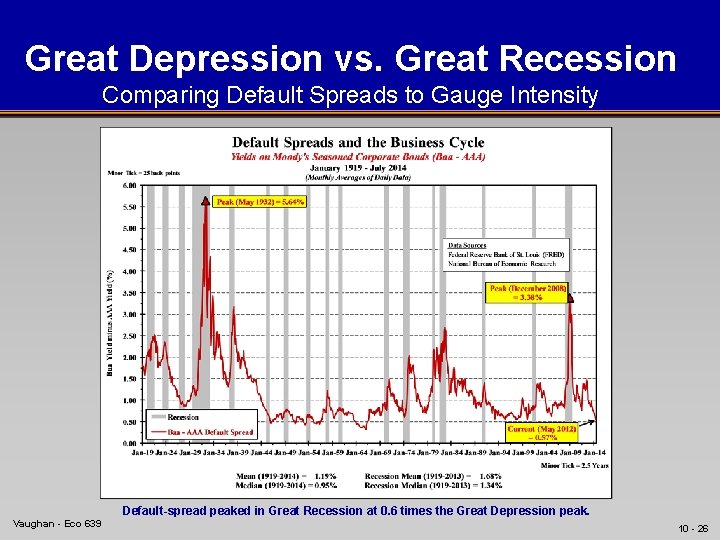
Great Depression vs. Great Recession Comparing Default Spreads to Gauge Intensity Vaughan - Eco 639 Default-spread peaked in Great Recession at 0. 6 times the Great Depression peak. 10 - 26
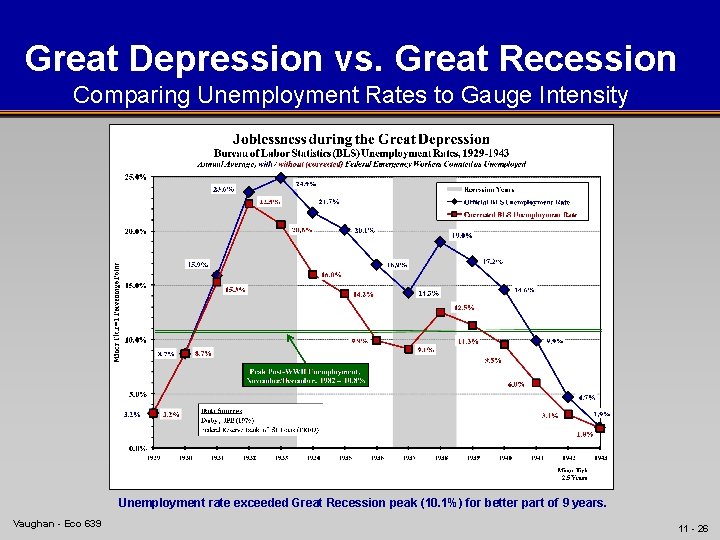
Great Depression vs. Great Recession Comparing Unemployment Rates to Gauge Intensity Unemployment rate exceeded Great Recession peak (10. 1%) for better part of 9 years. Vaughan - Eco 639 11 - 26
What Caused the Great Depression? Phase I – The Great Contraction (1929 -33) Early 1928 Fed tightened money to stop stock speculation; resulting hike in real interest rates discouraged spending. § Construction sector weakened first. Fall 1929 Stock-market crash reduced household wealth/liquidity and increased uncertainty, thereby provoking larger decline in spending. Fall 1930 - Spring 1933 Four banking panics turned a bad recession into a depression. § Currency / reserve hording caused money-supply collapse [M 2 ↓ = 35. 2% from August 1929 to March 1933] § Real interest rates soared, further depressing spending. § Waves of failures intensified gloom/uncertainty, even further depressing spending. § Failures destroyed lending relationships, depressing spending still further. Vaughan - Eco 639 12 - 26
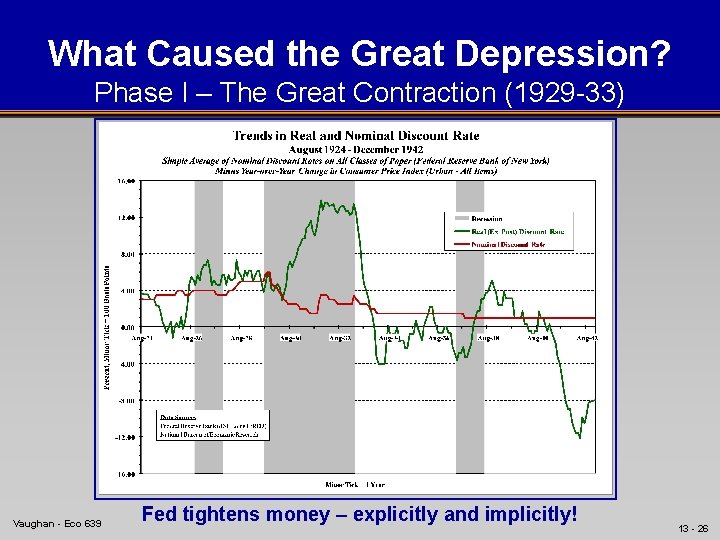
What Caused the Great Depression? Phase I – The Great Contraction (1929 -33) Vaughan - Eco 639 Fed tightens money – explicitly and implicitly! 13 - 26
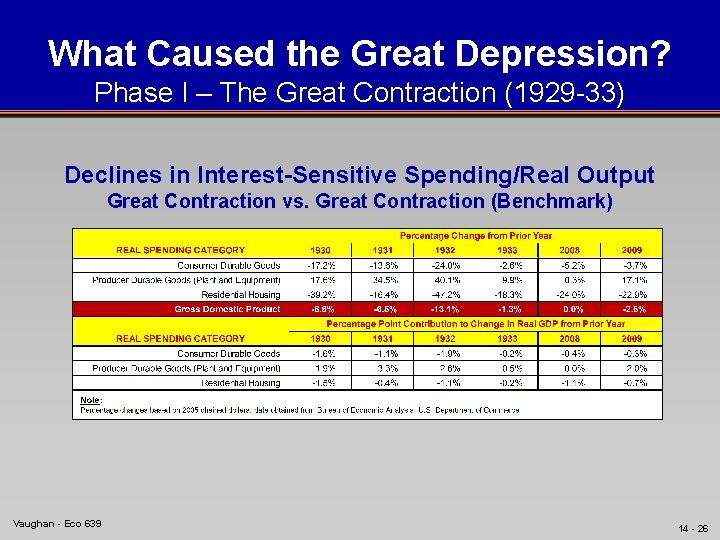
What Caused the Great Depression? Phase I – The Great Contraction (1929 -33) Declines in Interest-Sensitive Spending/Real Output Great Contraction vs. Great Contraction (Benchmark) Vaughan - Eco 639 14 - 26
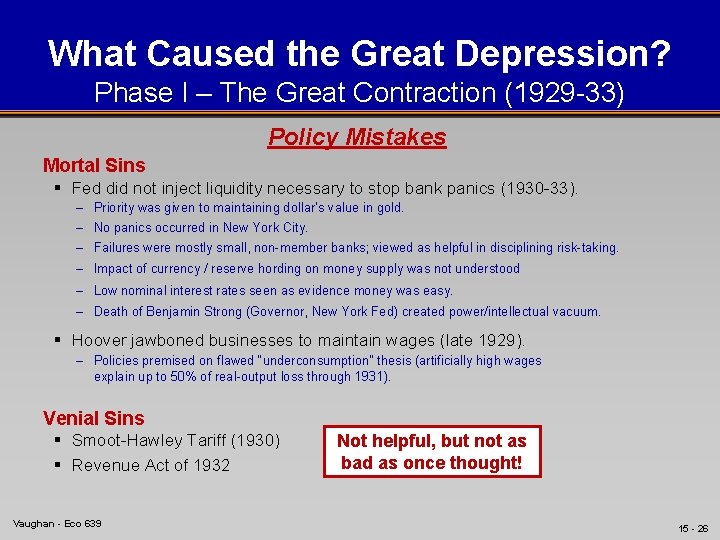
What Caused the Great Depression? Phase I – The Great Contraction (1929 -33) Policy Mistakes Mortal Sins § Fed did not inject liquidity necessary to stop bank panics (1930 -33). – Priority was given to maintaining dollar’s value in gold. – No panics occurred in New York City. – Failures were mostly small, non-member banks; viewed as helpful in disciplining risk-taking. – Impact of currency / reserve hording on money supply was not understood – Low nominal interest rates seen as evidence money was easy. – Death of Benjamin Strong (Governor, New York Fed) created power/intellectual vacuum. § Hoover jawboned businesses to maintain wages (late 1929). – Policies premised on flawed “underconsumption” thesis (artificially high wages explain up to 50% of real-output loss through 1931). Venial Sins § Smoot-Hawley Tariff (1930) § Revenue Act of 1932 Vaughan - Eco 639 Not helpful, but not as bad as once thought! 15 - 26
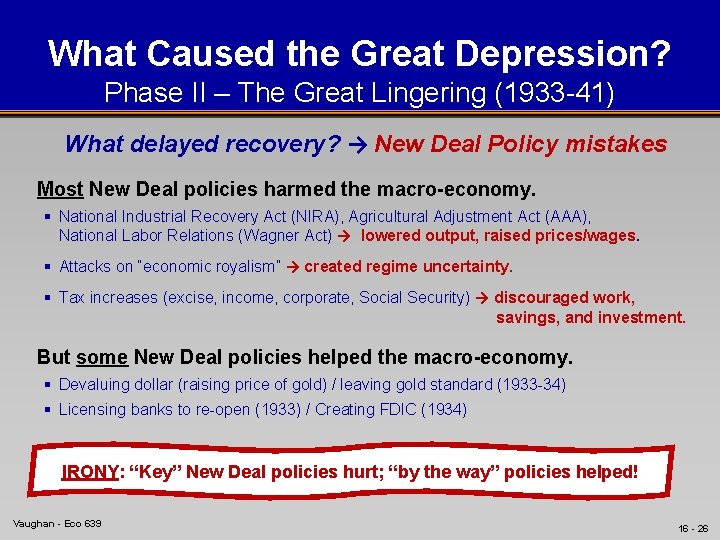
What Caused the Great Depression? Phase II – The Great Lingering (1933 -41) What delayed recovery? → New Deal Policy mistakes Most New Deal policies harmed the macro-economy. § National Industrial Recovery Act (NIRA), Agricultural Adjustment Act (AAA), National Labor Relations (Wagner Act) → lowered output, raised prices/wages. § Attacks on “economic royalism” → created regime uncertainty. § Tax increases (excise, income, corporate, Social Security) → discouraged work, savings, and investment. But some New Deal policies helped the macro-economy. § Devaluing dollar (raising price of gold) / leaving gold standard (1933 -34) § Licensing banks to re-open (1933) / Creating FDIC (1934) IRONY: “Key” New Deal policies hurt; “by the way” policies helped! Vaughan - Eco 639 16 - 26
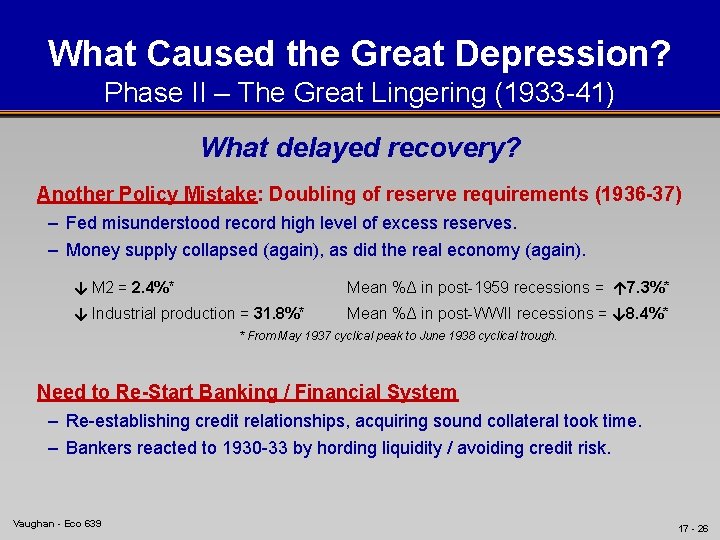
What Caused the Great Depression? Phase II – The Great Lingering (1933 -41) What delayed recovery? Another Policy Mistake: Doubling of reserve requirements (1936 -37) – Fed misunderstood record high level of excess reserves. – Money supply collapsed (again), as did the real economy (again). ↓ M 2 = 2. 4%* Mean %Δ in post-1959 recessions = ↑ 7. 3%* ↓ Industrial production = 31. 8%* Mean %Δ in post-WWII recessions = ↓ 8. 4%* * From May 1937 cyclical peak to June 1938 cyclical trough. Need to Re-Start Banking / Financial System – Re-establishing credit relationships, acquiring sound collateral took time. – Bankers reacted to 1930 -33 by hording liquidity / avoiding credit risk. Vaughan - Eco 639 17 - 26
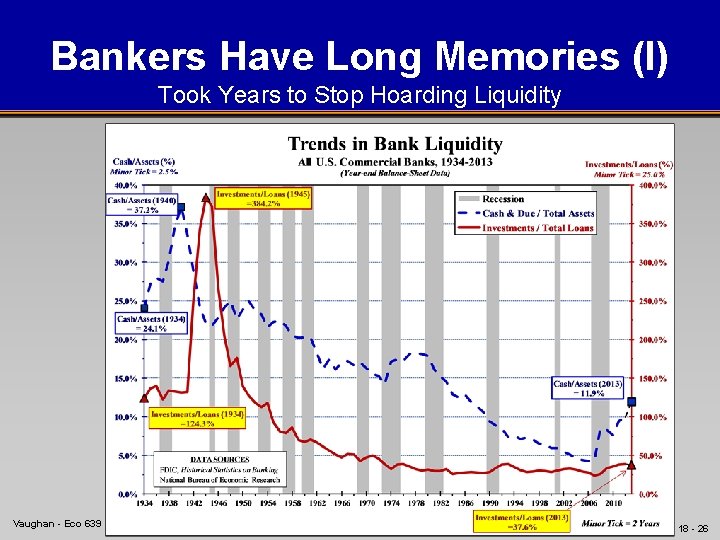
Bankers Have Long Memories (I) Took Years to Stop Hoarding Liquidity Vaughan - Eco 639 Cash-to-assets ratio did not fall below 1934 level until 1944. Investment-to-loans ratio did not fall below 1934 level until 1952. 18 - 26
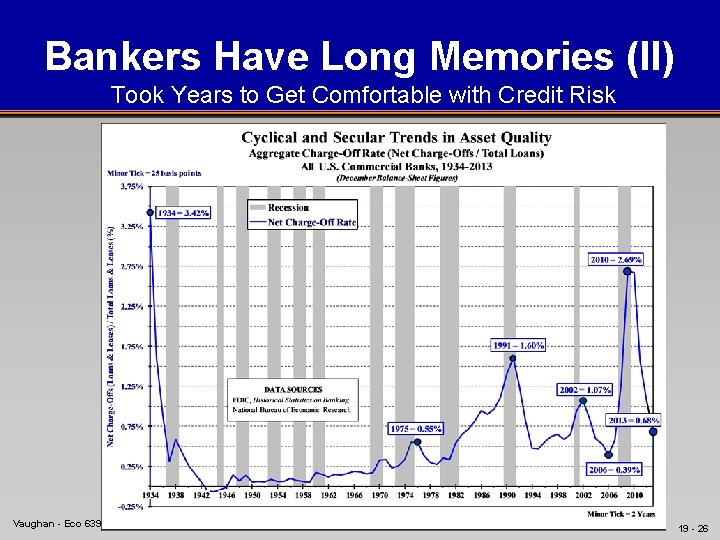
Bankers Have Long Memories (II) Took Years to Get Comfortable with Credit Risk Vaughan - Eco 639 19 - 26
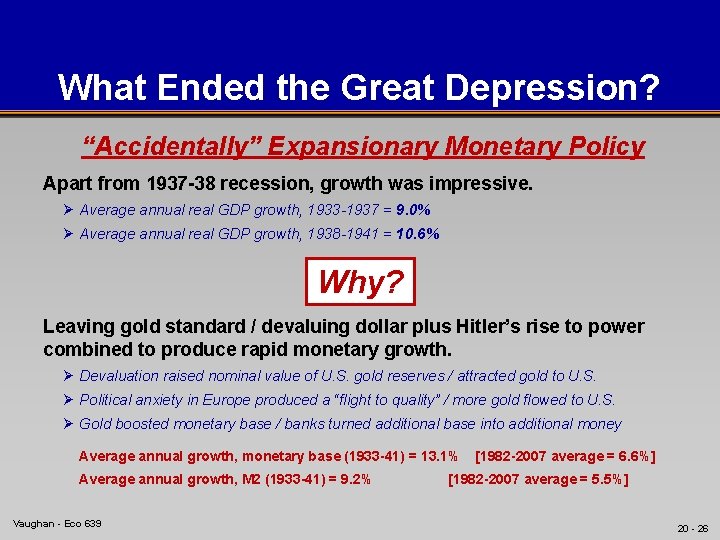
What Ended the Great Depression? “Accidentally” Expansionary Monetary Policy Apart from 1937 -38 recession, growth was impressive. Ø Average annual real GDP growth, 1933 -1937 = 9. 0% Ø Average annual real GDP growth, 1938 -1941 = 10. 6% Why? Leaving gold standard / devaluing dollar plus Hitler’s rise to power combined to produce rapid monetary growth. Ø Devaluation raised nominal value of U. S. gold reserves / attracted gold to U. S. Ø Political anxiety in Europe produced a “flight to quality” / more gold flowed to U. S. Ø Gold boosted monetary base / banks turned additional base into additional money Average annual growth, monetary base (1933 -41) = 13. 1% Average annual growth, M 2 (1933 -41) = 9. 2% Vaughan - Eco 639 [1982 -2007 average = 6. 6%] [1982 -2007 average = 5. 5%] 20 - 26
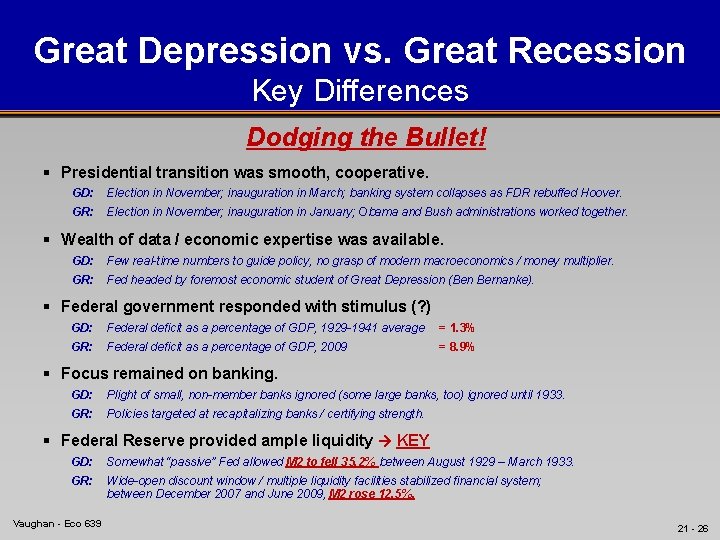
Great Depression vs. Great Recession Key Differences Dodging the Bullet! § Presidential transition was smooth, cooperative. GD: Election in November; inauguration in March; banking system collapses as FDR rebuffed Hoover. GR: Election in November; inauguration in January; Obama and Bush administrations worked together. § Wealth of data / economic expertise was available. GD: Few real-time numbers to guide policy, no grasp of modern macroeconomics / money multiplier. GR: Fed headed by foremost economic student of Great Depression (Ben Bernanke). § Federal government responded with stimulus (? ) GD: Federal deficit as a percentage of GDP, 1929 -1941 average = 1. 3% GR: Federal deficit as a percentage of GDP, 2009 = 8. 9% § Focus remained on banking. GD: Plight of small, non-member banks ignored (some large banks, too) ignored until 1933. GR: Policies targeted at recapitalizing banks / certifying strength. § Federal Reserve provided ample liquidity → KEY GD: Somewhat “passive” Fed allowed M 2 to fell 35. 2% between August 1929 – March 1933. GR: Wide-open discount window / multiple liquidity facilities stabilized financial system; between December 2007 and June 2009, M 2 rose 12. 5%. Vaughan - Eco 639 21 - 26
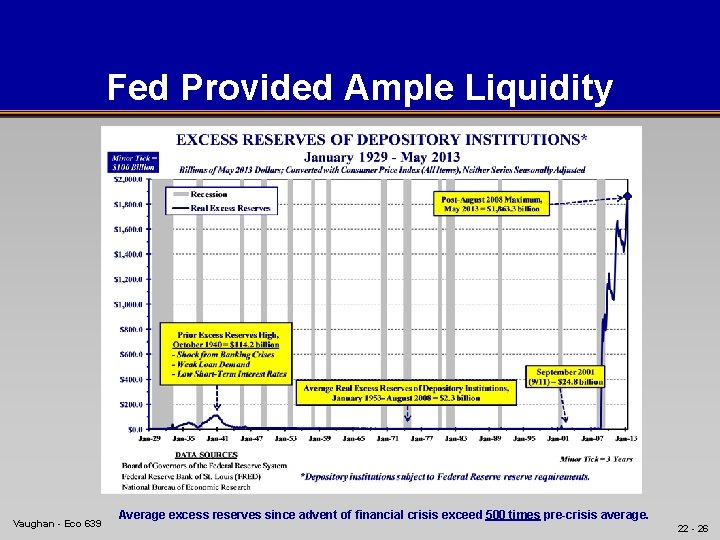
Fed Provided Ample Liquidity Vaughan - Eco 639 Average excess reserves since advent of financial crisis exceed 500 times pre-crisis average. 22 - 26
Intermediate-Term Outlook The Economy Sluggish Growth! § Monetary policy has done all it can do. – On the bright side, 1930 s deflation did not happened. § Bank lending apt to recover slowly. – – Dodd-Frank and continuing regulatory uncertainty discourage risk-taking. Recapitalizing takes time. Interest on reserves provides attractive alternative to lending. “Other shoe” could drop, thereby making liquidity insurance valuable (Greece and parallel to 1931 Creditanstalt failure). Vaughan - Eco 639 23 - 26
Intermediate-Term Outlook The Economy Sluggish Growth! § Anti-supply policies will impair recovery. – “Obamacare” taxes job creation. – Increase in minimum wage taxes job creation. – Extension of unemployment compensation discourages job search. § Economic/policy uncertainty will impair recovery. All the following will encourage businesses to defer putting capital at risk… – Uncertainty about timetable for phasing in Obamacare. – Uncertainty about fiscal policy due to structural deficits. – Uncertainty about macro prospects for Euro-zone. Vaughan - Eco 639 24 - 26
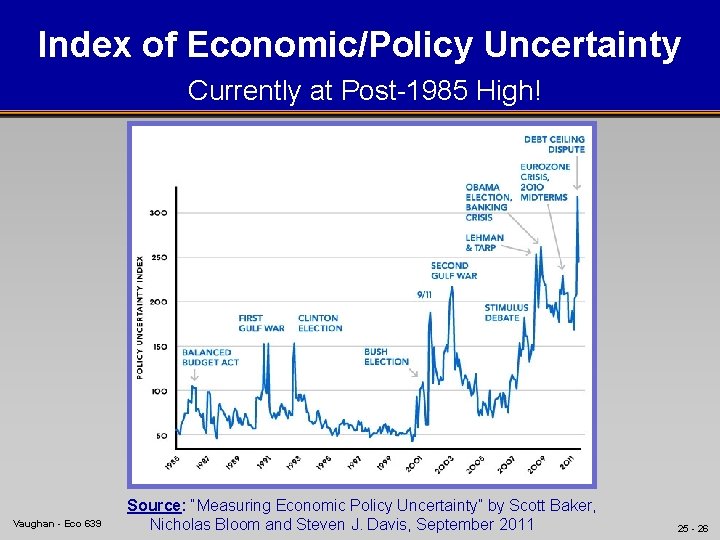
Index of Economic/Policy Uncertainty Currently at Post-1985 High! Vaughan - Eco 639 Source: “Measuring Economic Policy Uncertainty” by Scott Baker, Nicholas Bloom and Steven J. Davis, September 2011 25 - 26
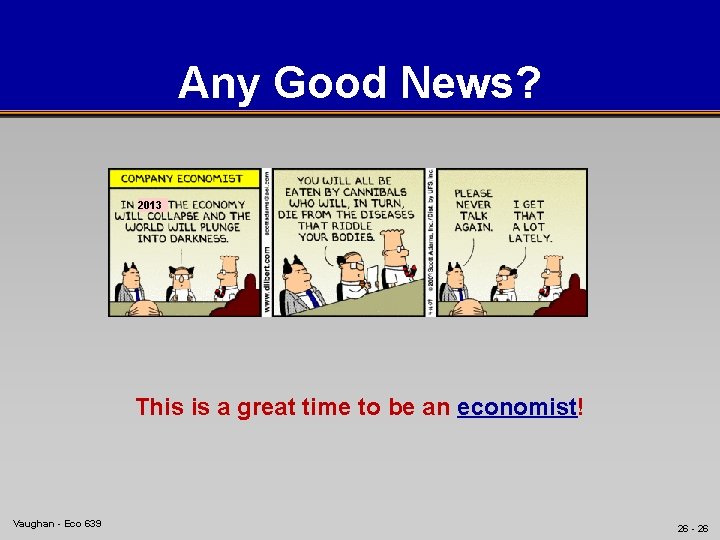
Any Good News? 2013 This is a great time to be an economist! Vaughan - Eco 639 26 - 26
Questions over History May Not Repeat, But It Does Rhyme: Lessons from the 1930 s for the 2000 s? Mark D. Vaughan American University / Economics 639
- Slides: 27