Histograms Worksheet B The worksheet is in 2

Histograms – Worksheet B The worksheet is in 2 sizes.

Printing To print handouts from slides Select the slide from the left. Then click: File > Print > ‘Print Current Slide’ To print multiple slides Click on a section title to highlight all those slides, or press ‘Ctrl’ at the same time as selecting slides to highlight more than one. Then click: File > Print > ‘Print Selection’ To print double-sided handouts Highlight both slides before using ‘Print Selection’. Choose ‘Print on Both Sides’ and ‘Flip on Short Edge’.
 The histogram shows temperatures on different winter days. Time, t, (mins)")
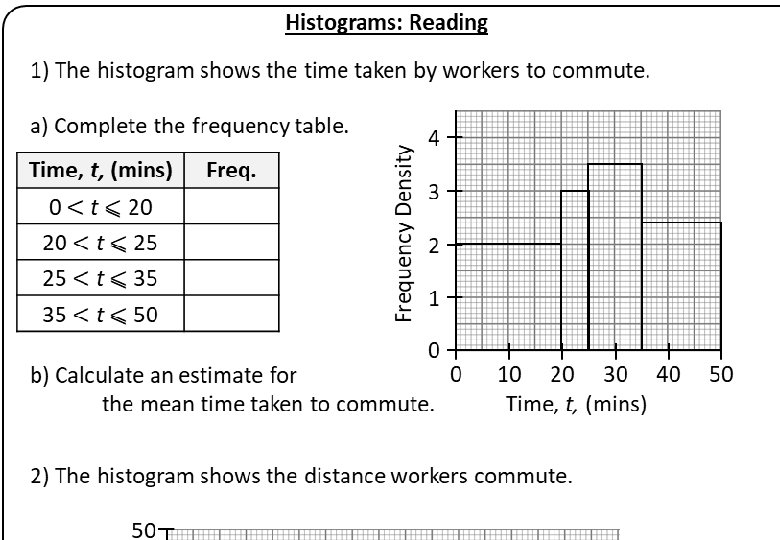
Histograms: Reading 3) The histogram shows temperatures on different winter days. Time, t, (mins) Frequency Density a) Complete the frequency table. Frequency Density 1) The histogram shows the time taken by workers to commute. 4 3 2 1 0 0 b) Calculate an estimate for the mean time taken to commute. 10 20 30 40 Time, t, (mins) 50 40 50 2 4 6 8 10 12 Temperature, t, (°C) 4) The histogram shows the weight of different packages. 30 5 20 4 10 0 0 Use the histogram to estimate… a) …the median. b) …the lower quartile. c) …the upper quartile. d) What is the inter-quartile range? 0 5 10 15 20 25 30 Distance, d, (km) 35 How many people commute …less than 10 km? …more than 20 km? …between 10 km and 15 km? …less than 2 km? …more than 22 km? …more than 7 km? 40 Frequency Density 10 0 2) The histogram shows the distance workers commute. a) b) c) d) e) f) 20 3 2 1 0 0 10 20 30 40 50 60 Weight, g, (kg) a) Estimate the median. b) Estimate the inter-quartile range. c) Estimate the mean. 70 80
 The histogram shows temperatures on different winter days. Freq. 400 337.")
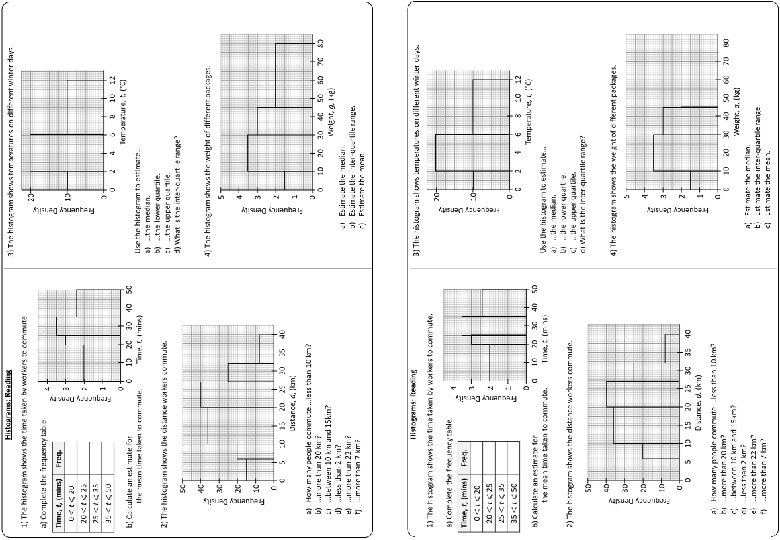
Histograms: Reading 3) The histogram shows temperatures on different winter days. Freq. 400 337. 5 1050 540 2327. 5 40 15 35 36 126 4 3 2 1 0 0 b) Calculate an estimate for the mean time taken to commute. 10 20 30 40 Time, t, (mins) 18. 5 minutes 2) The histogram shows the distance workers commute. Frequency Density 50 30 10 0 2 4 6 8 10 12 Temperature, t, (°C) 4) The histogram shows the weight of different packages. 5 64 5 10 280 10 0 60 20 Use the histogram to estimate… 5 °C a) …the median. 3 °C b) …the lower quartile. 8 °C c) …the upper quartile. d) What is the inter-quartile range? 5 °C 125 80 90 20 0 a) b) c) d) e) f) 360 40 50 80 20 0 15 20 25 30 Distance, d, (km) 35 40 How many people commute …less than 10 km? 170 …more than 20 km? 469 180 …between 10 km and 15 km? 30 …less than 2 km? …more than 22 km? 389 …more than 7 km? 889 Frequency Density Time, t, (mins) Frequency Density a) Complete the frequency table. Frequency Density 1) The histogram shows the time taken by workers to commute. 70 4 3 70 15 2 45 1 0 0 10 20 30 40 50 60 Weight, g, (kg) 70 80 35 kg a) Estimate the median. b) Estimate the inter-quartile range. 20 to 55 kg = 35 kg c) Estimate the mean. 37. 7 kg
 The histogram shows temperatures on different winter days. Time, t, (mins)")
Histograms: Reading 3) The histogram shows temperatures on different winter days. Time, t, (mins) Frequency Density a) Complete the frequency table. Frequency Density 1) The histogram shows the time taken by workers to commute. 4 3 2 1 0 0 b) Calculate an estimate for the mean time taken to commute. 10 20 30 40 Time, t, (mins) 50 40 50 2 4 6 8 10 12 Temperature, t, (°C) 4) The histogram shows the weight of different packages. 30 5 20 4 10 0 0 Use the histogram to estimate… a) …the median. b) …the lower quartile. c) …the upper quartile. d) What is the inter-quartile range? 0 5 10 15 20 25 30 Distance, d, (km) 35 How many people commute …less than 10 km? …more than 20 km? …between 10 km and 15 km? …less than 2 km? …more than 22 km? …more than 7 km? 40 Frequency Density 10 0 2) The histogram shows the distance workers commute. a) b) c) d) e) f) 20 3 2 1 0 0 10 20 30 40 50 60 Weight, g, (kg) a) Estimate the median. b) Estimate the inter-quartile range. c) Estimate the mean. 70 80

Questions? Comments? Suggestions? …or have you found a mistake!? Any feedback would be appreciated . Please feel free to email: tom@goteachmaths. co. uk
- Slides: 8