
Histograms Isosurface Statistics Hamish Carr Brian Duffy Barry

Histograms & Isosurface Statistics Hamish Carr, Brian Duffy & Barry Denby University College Dublin
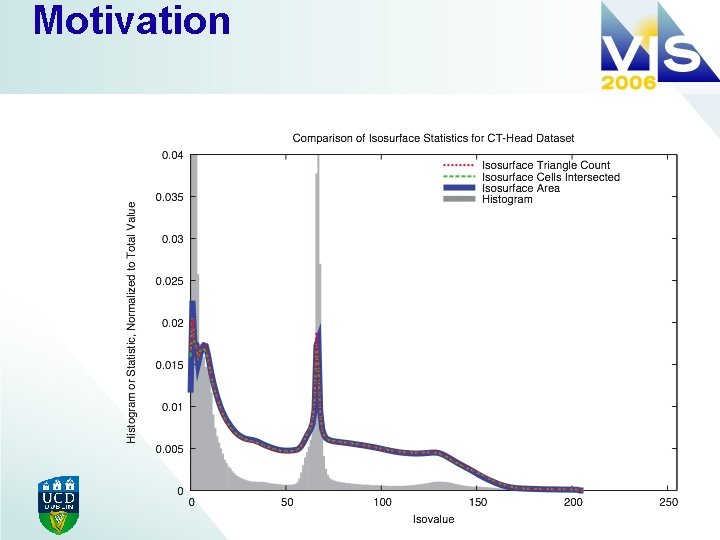
Motivation

Overview 4 Mathematical Analysis 4 Analytical Functions • where we know the correct answer 4 Experimental Results • where we don’t know the correct answer 4 Isosurface Complexity • a related problem 4 Conclusions 3
Mathematics of Histograms 4 Histograms represent distributions • the proportion at each value 4 Fundamentally discrete 4 But volumetric functions are continuous • by assumption, analysis or reconstruction 4

Continuous Distributions 4 Continuous distributions use: 4 The area of the isosurface 5
Nearest Neighbour 4 Nearest Neighbour Interpolant 4 Regular grids use uniform Voronoi cells • all of the same size ζ 4 Let’s look at the distribution of F 6
Histograms use Nearest Neighbour 7
Isosurface Statistics 4 Histogram (Count) 4 Active Cell Count 4 Triangle Count 4 Isosurface Area • Marching Cubes approximation • (Montani & al. , 1994) 8
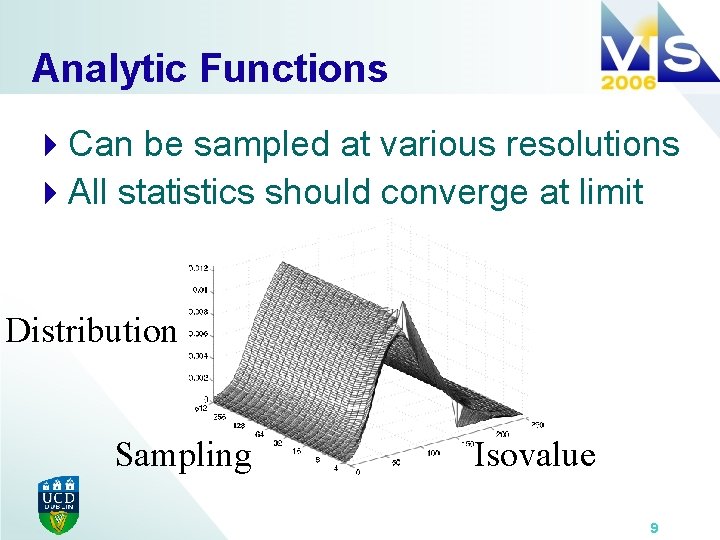
Analytic Functions 4 Can be sampled at various resolutions 4 All statistics should converge at limit Distribution Sampling Isovalue 9
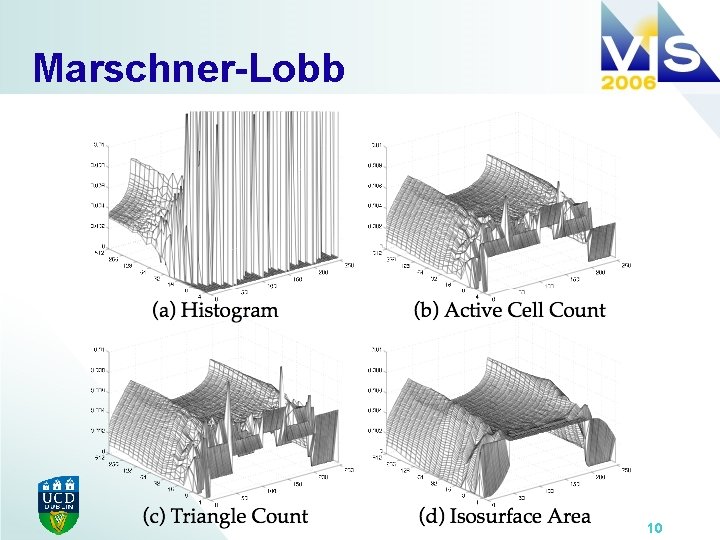
Marschner-Lobb 10
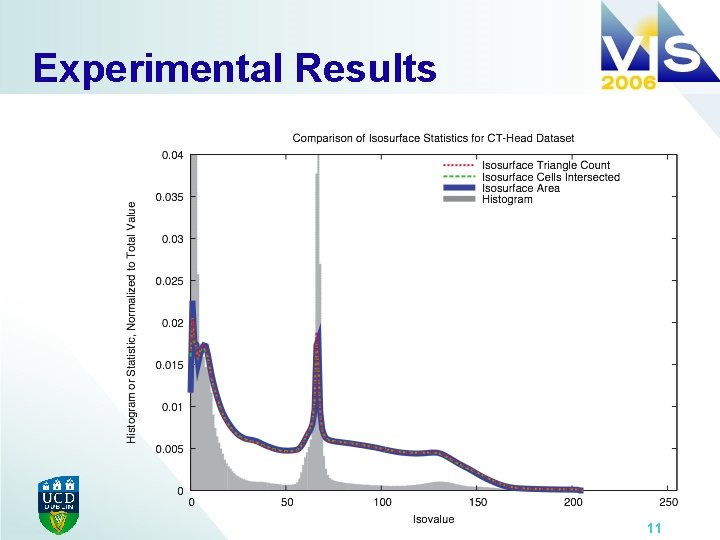
Experimental Results 11
Experimental Results 12
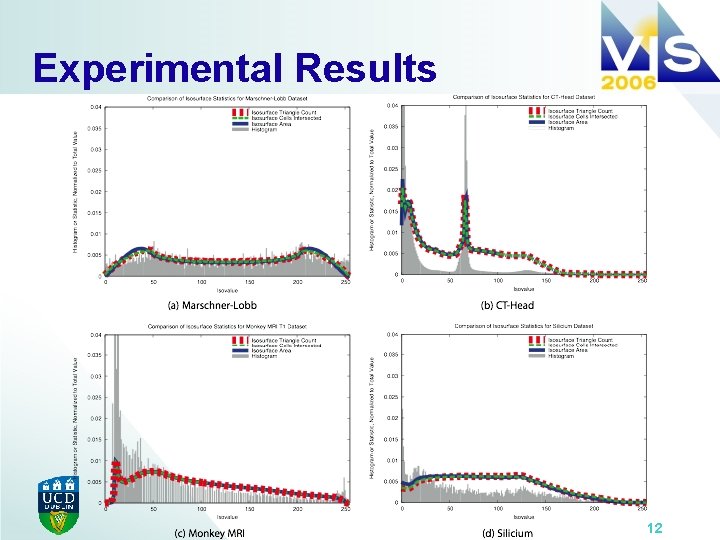
Experimental Results 494 Volumetric Data sets tested • various sources / types 4 Histograms systematically: • underestimate transitional regions • miss secondary peaks • display spurious peaks 4 Noisy data smoothes histogram 4 Area is the best distribution • but cell count & triangle count nearly as good 13
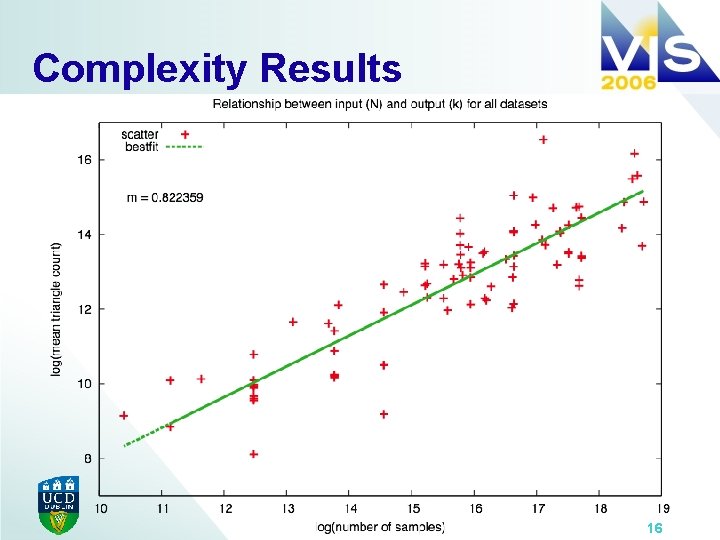
Isosurface Complexity 4 Isosurface acceleration relies on • N - number of point samples • k - number of active cells / triangles 4 What is the relationship? • Worst case: • k = Θ(N) • Typical case (estimate): • k = O(N 2/3) – Itoh & Koyamada, 1994 14
Experimental Relationship 4 For each data set • • normalize to 8 -bit compute triangle count for each isovalue average counts over all isovalues generates a single value (avg. triangle count) 4 For all data sets • • plot N (# of samples) vs. k (# of triangles) plot as log-log scatterplot find least squares line slope should be 2/3 15
Complexity Results 16
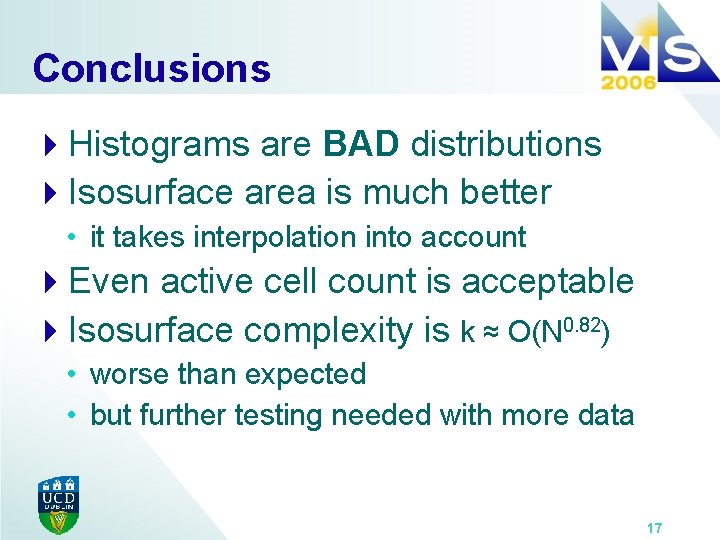
Conclusions 4 Histograms are BAD distributions 4 Isosurface area is much better • it takes interpolation into account 4 Even active cell count is acceptable 4 Isosurface complexity is k ≈ O(N 0. 82) • worse than expected • but further testing needed with more data 17
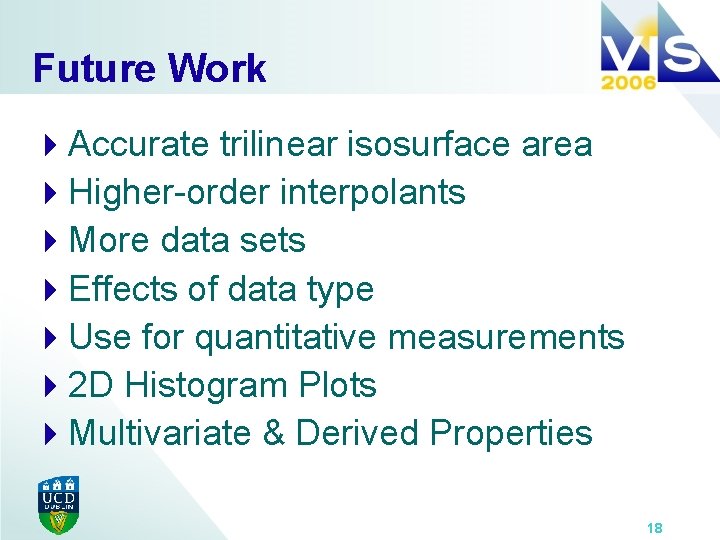
Future Work 4 Accurate trilinear isosurface area 4 Higher-order interpolants 4 More data sets 4 Effects of data type 4 Use for quantitative measurements 42 D Histogram Plots 4 Multivariate & Derived Properties 18

Acknowledgements 4 Science Foundation Ireland 4 University College Dublin 4 Anonymous reviewers 4 Sources of data (www. volvis. org &c. ) 19
- Slides: 19