Histograms Histograms A population histogram is a graph


 • Birth rate almost equals death rate. • The population")
 • When the birth rate is smaller than the death rate.")


 Fig. 9 -10 a, p. 179")
 Fig. 9 -10 b, p. 179")


- Slides: 17
Histograms
Histograms A population histogram is a graph that samples a population and shows a count of each characteristic of interest We can look at: Age structure Gender differences Growth patterns Baby booms
Histogram Features • Broken down by age. • You can see the birth rate, maturity rate and death rate of an entire population. • Usually broken down by country.
Histogram Three types of population growth that can be determined used histograms Expanding/Expansive/Rapid Stable (Zero Growth) Declining (Negative Growth)
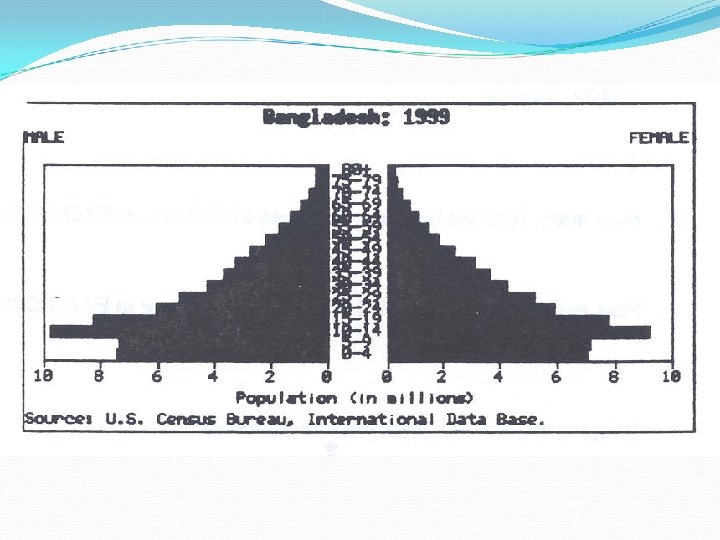
Expansive/rapid growth • Birth rate exceeds the death rate. Population is getting larger. • Pyramid (sometimes called pear) shaped histogram. Ex’s. Kenya, Nigeria and Saudi Arabia.
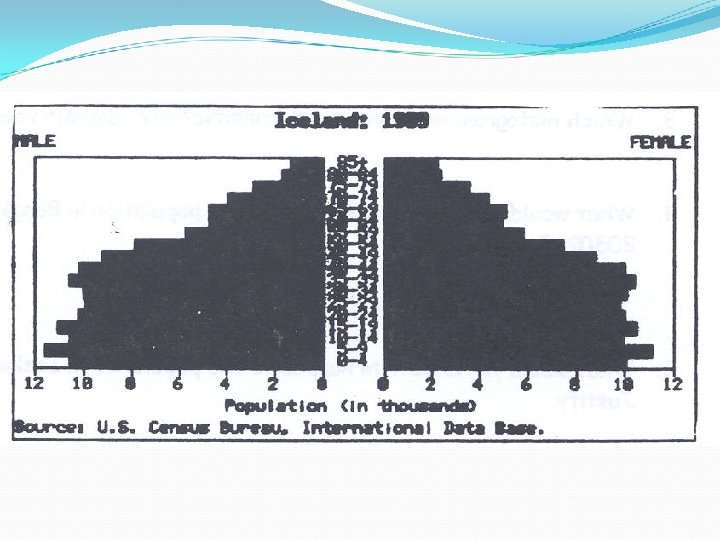
Stable/Slow Growth (Zero Growth) • Birth rate almost equals death rate. • The population is not getting any larger or is growing very slowly. • Histogram shape is straighter and more boxlike until about age 45 -85. Ex. US, Australia & Canada has slow Denmark, Austria and Italy has stable
Declining (negative growth) • When the birth rate is smaller than the death rate. • The pyramid bulges near the top or is inverted. Ex. Germany, Bulgaria & Hungary.
POPULATION AGE STRUCTURE Populations with a large proportion of its people in the preproductive ages 1 -14 have a large potential for rapid population growth. Figure 9 -9
Male Female Expanding Rapidly Guatemala Nigeria Saudi Arabia Prereproductive ages 0– 14 Male Female Expanding Slowly United States Australia Canada Reproductive ages 15– 44 Male Female Stable Spain Portugal Greece Female Male Declining Germany Bulgaria Italy Postreproductive ages 45– 85+ Fig. 9 -9, p. 179
POPULATION AGE STRUCTURE 32% of the people in developing countries were under 15 years old in 2006 versus only 17% in developed countries. Figure 9 -10
Developed Countries Female Age Male Population (millions) Fig. 9 -10 a, p. 179
Developing Countries Female Age Male Population (millions) Fig. 9 -10 b, p. 179
Baby Boom Histograms Today, baby boomers make up nearly half of all adult Americans and dominate the populations demand for goods and services. Figure 9 -11
Histogram and AIDS