Histograms Higher GCSE Questions AQA These questions are


- Slides: 15
Histograms – Higher – GCSE Questions – AQA These questions are the same format as previous GCSE exams. COPY means they use the exact same numbers as the original GCSE question. Otherwise, they are clone questions using different numbers. The worksheets are provided in 2 sizes.
Printing To print handouts from slides Select the slide from the left. Then click: File > Print > ‘Print Current Slide’ To print multiple slides Click on a section title to highlight all those slides, or press ‘Ctrl’ at the same time as selecting slides to highlight more than one. Then click: File > Print > ‘Print Selection’ To print double-sided handouts Highlight both slides before using ‘Print Selection’. Choose ‘Print on Both Sides’ and ‘Flip on Short Edge’.
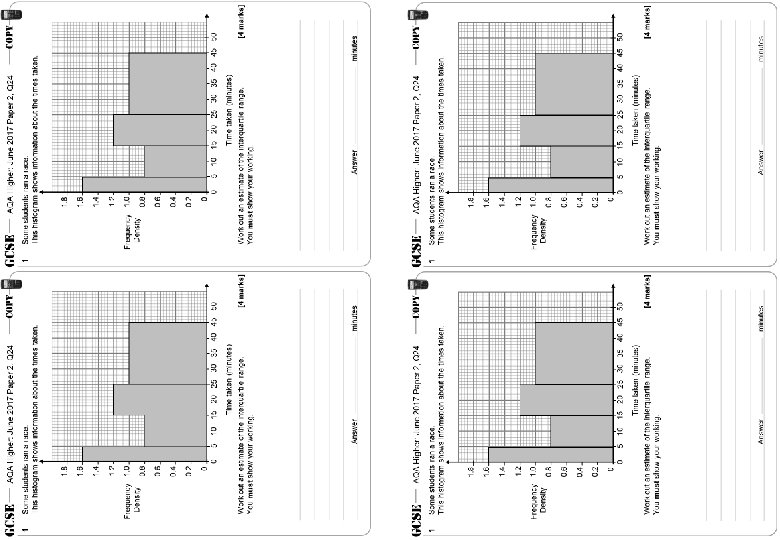
AQA Higher: June 2017 Paper 2, Q 24 1 AQA Higher: June 2017 Paper 2, Q 24 Some students ran a race. This histogram shows information about the times taken. 1. 8 1. 6 1. 4 1. 2 Frequency 1. 0 Density 0. 8 0. 6 0. 4 0. 2 0 0 0 5 10 15 20 25 30 35 40 45 50 Time taken (minutes) Work out an estimate of the interquartile range. You must show your working. Answer Time taken (minutes) [4 marks] minutes Work out an estimate of the interquartile range. You must show your working. Answer [4 marks] minutes
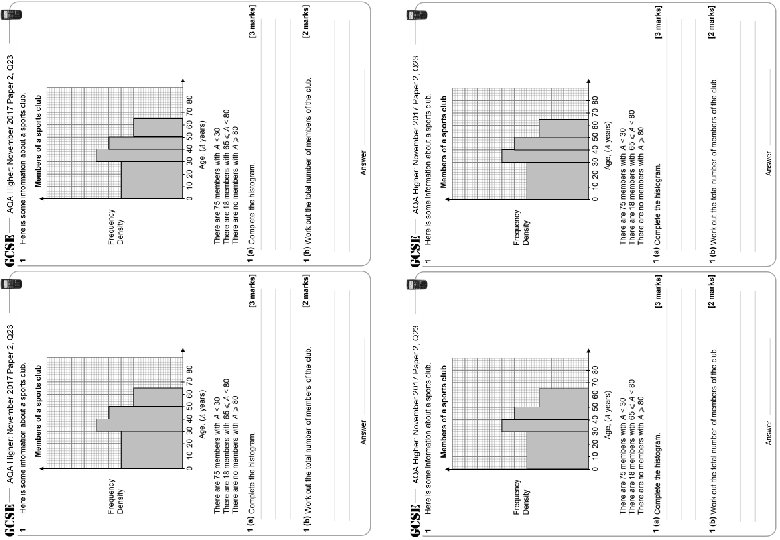
AQA Higher: November 2017 Paper 2, Q 23 1 AQA Higher: November 2017 Paper 2, Q 23 Here is some information about a sports club. 1 Here is some information about a sports club. Members of a sports club Frequency Density 0 10 20 30 40 50 60 70 80 There are 75 members with A < 30 There are 18 members with 65 �A < 80 There are no members with A � 80 1 (a) Complete the histogram. [3 marks] 1 (b) Work out the total number of members of the club. [2 marks] Answer
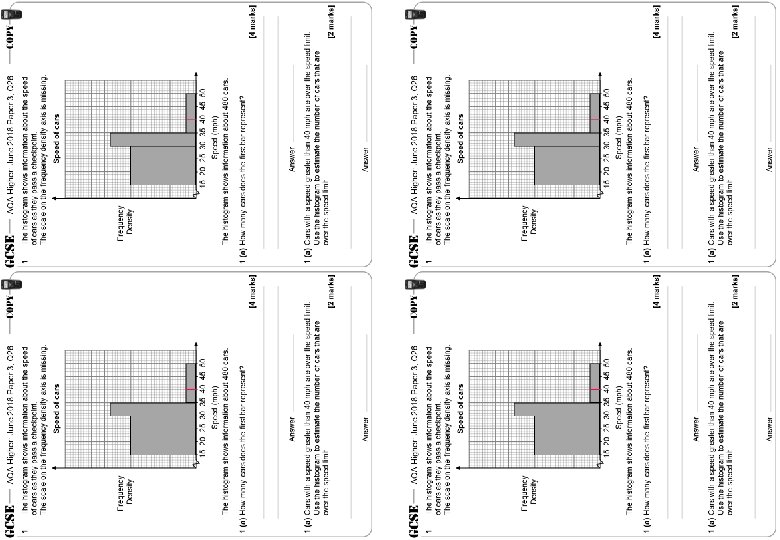
AQA Higher: June 2018 Paper 3, Q 26 1 AQA Higher: June 2018 Paper 3, Q 26 The histogram shows information about the speed of cars as they pass a checkpoint. The scale on the frequency density axis is missing. 1 The histogram shows information about the speed of cars as they pass a checkpoint. The scale on the frequency density axis is missing. Speed of cars Frequency Density 15 20 25 30 35 40 45 50 Speed (mph) The histogram shows information about 480 cars. 1 (a) How many cars does the first bar represent? [4 marks] Answer 1 (a) Cars with a speed greater than 40 mph are over the speed limit. Use the histogram to estimate the number of cars that are over the speed limit. [2 marks] Answer
AQA Higher: June 2017 Paper 2, Q 24 1 Some students ran a race. This histogram shows information about the times taken. 1. 8 1. 6 1. 4 1. 2 Frequency 1. 0 Density 0. 8 0. 6 0. 4 0. 2 0 0 5 10 15 20 25 30 35 40 45 50 Time taken (minutes) Work out an estimate of the interquartile range. You must show your working. Answer [4 marks] minutes
AQA Higher: November 2017 Paper 2, Q 23 1 Here is some information about a sports club. Members of a sports club Frequency Density 0 10 20 30 40 50 60 70 80 There are 75 members with A < 30 There are 18 members with 65 �A < 80 There are no members with A � 80 1 (a) Complete the histogram. [3 marks] 1 (b) Work out the total number of members of the club. [2 marks] Answer
AQA Higher: June 2018 Paper 3, Q 26 1 The histogram shows information about the speed of cars as they pass a checkpoint. The scale on the frequency density axis is missing. Speed of cars Frequency Density 15 20 25 30 35 40 45 50 Speed (mph) The histogram shows information about 480 cars. 1 (a) How many cars does the first bar represent? [4 marks] Answer 1 (a) Cars with a speed greater than 40 mph are over the speed limit. Use the histogram to estimate the number of cars that are over the speed limit. [2 marks] Answer
AQA Higher: June 2017 Paper 2, Q 24 1 Some students ran a race. This histogram shows information about the times taken. 1. 8 8 1. 6 1. 4 1. 2 Frequency 1. 0 Density 0. 8 12 8 0. 6 44 0. 2 20 8 12 0 0 5 10 15 20 25 30 35 40 45 50 Time taken (minutes) Work out an estimate of the interquartile range. You must show your working. [4 marks] 5 × 1. 6 = 8 students 10 × 0. 8 = 8 LQ = 12 th = 10 min 10 × 1. 2 = 12 UQ = 36 th = 33 min 20 × 1 = 20 = 48 33 – 10 = 23 minutes Answer minutes
AQA Higher: November 2017 Paper 2, Q 23 1 Here is some information about a sports club. Members of a sports club 10 × 3. 5 = 35 10 × 3 = 30 Frequency Density 2. 5 75 15 × 2 = 30 18 30 0 10 20 30 40 50 60 70 80 There are 75 members with A < 30 There are 18 members with 65 �A < 80 There are no members with A � 80 1 (a) Complete the histogram. [3 marks] 75 ÷ 30 = Freq. Density = 2. 5 65 to 80 years old: 18 ÷ 15 = 1. 2 1 (b) Work out the total number of members of the club. 75 + 30 + 18 = 188 Answer 188 [2 marks]
AQA Higher: June 2018 Paper 3, Q 26 1 The histogram shows information about the speed of cars as they pass a checkpoint. The scale on the frequency density axis is missing. Speed of cars 15 squares Frequency Density 2. 4 15 20 25 30 35 40 45 50 1. 6 Speed (mph) The histogram shows information about 480 cars. 1 (a) How many cars does the first bar represent? 20 + 6. 6 + 2. 4 = 24 480 ÷ 24 = 20 Answer [4 marks] 20 × 15 = 300 1 (a) Cars with a speed greater than 40 mph are over the speed limit. Use the histogram to estimate the number of cars that are over the speed limit. [2 marks] 20 × 1. 6 = 32 Answer
Questions? Comments? Suggestions? …or have you found a mistake!? Any feedback would be appreciated . Please feel free to email: tom@goteachmaths. co. uk