Histograms for observed WISCIII data from 50 ptt

Histograms for observed WISC-III data from 50 ptt

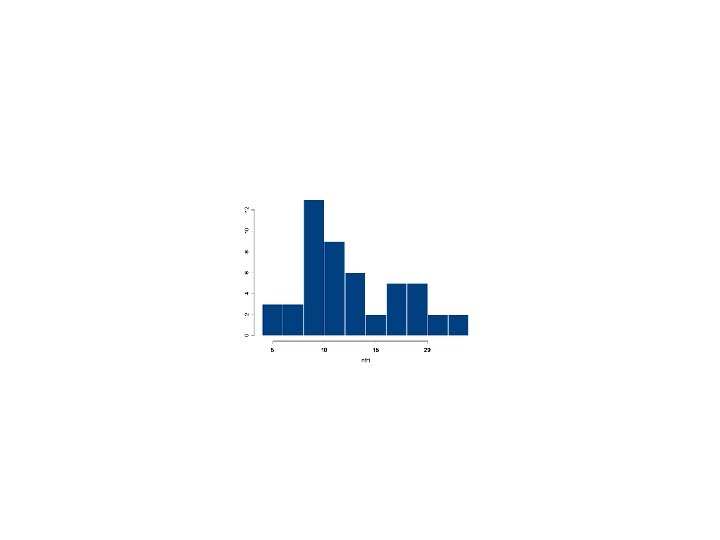
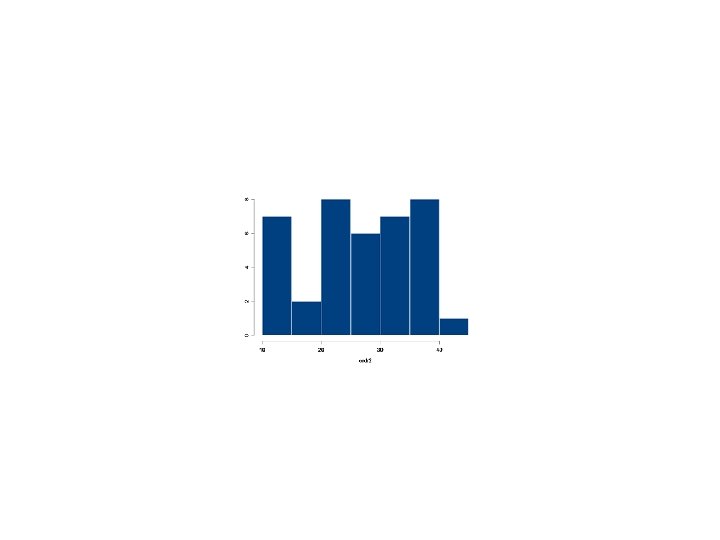
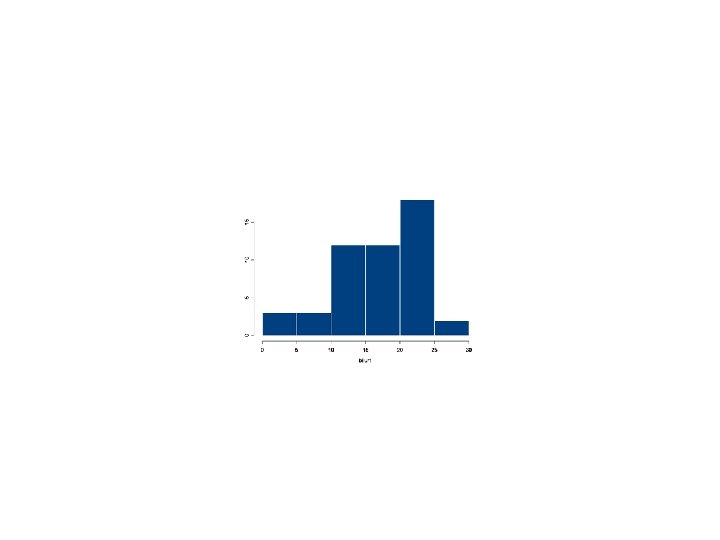
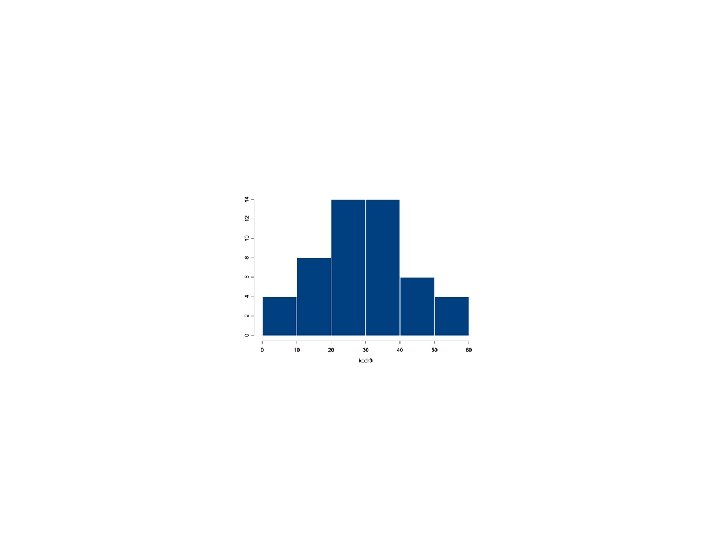
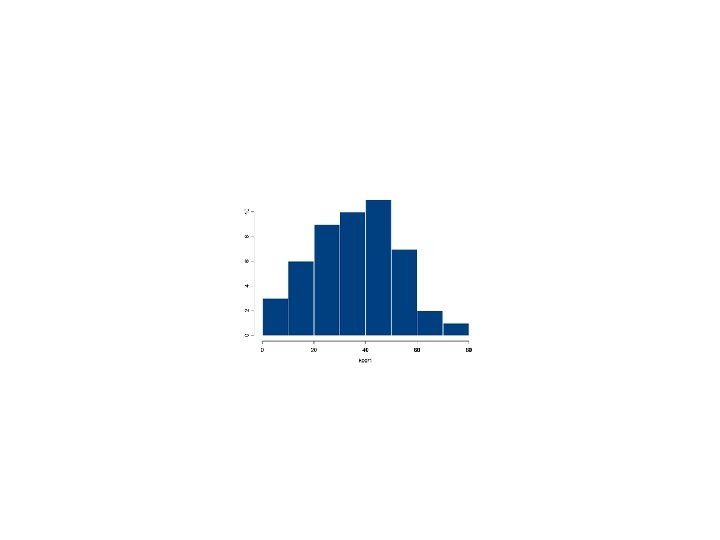
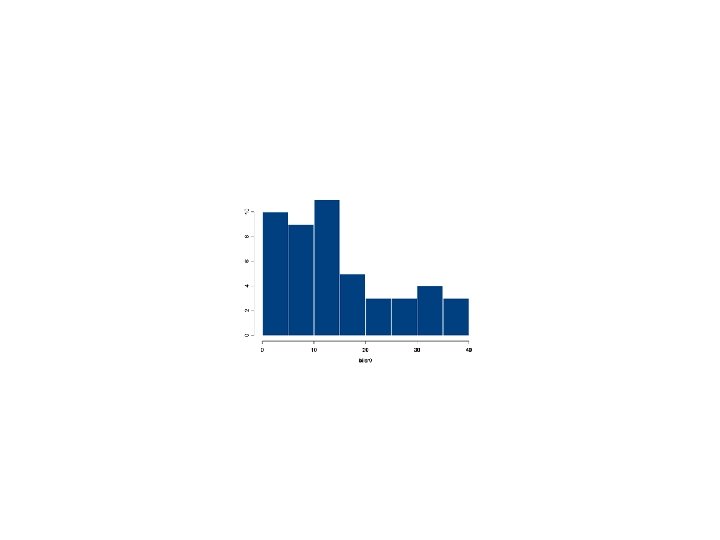
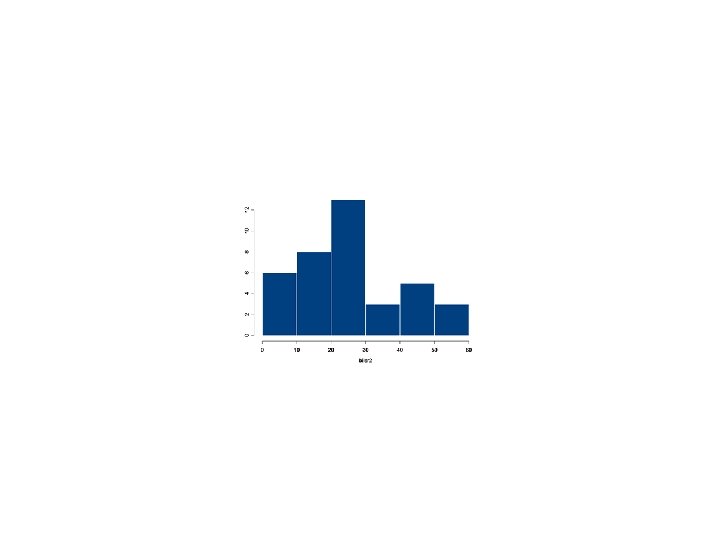
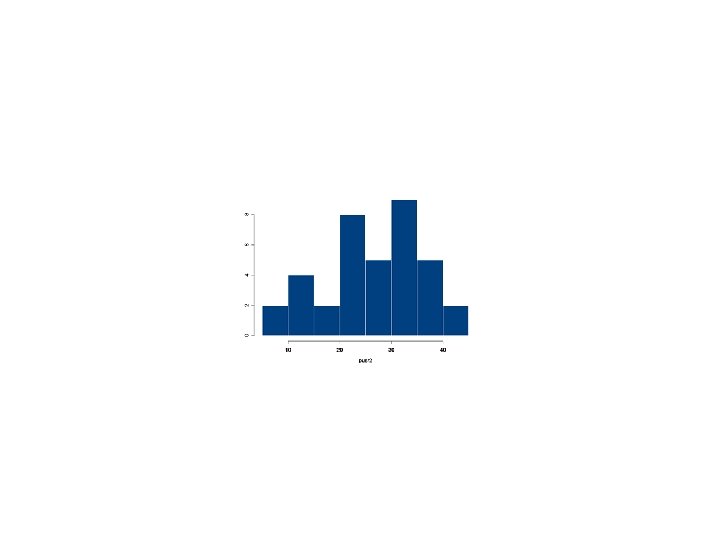
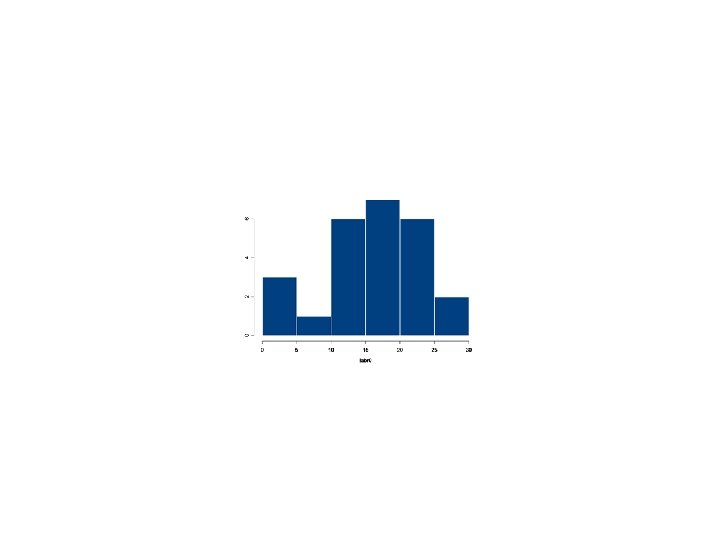
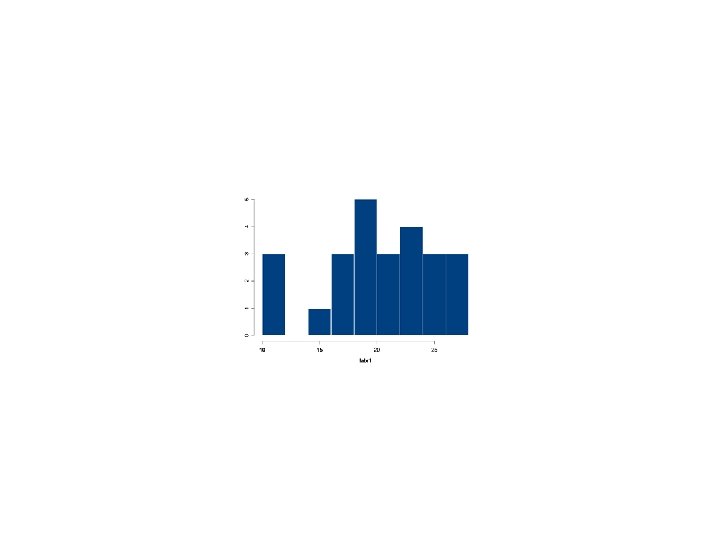
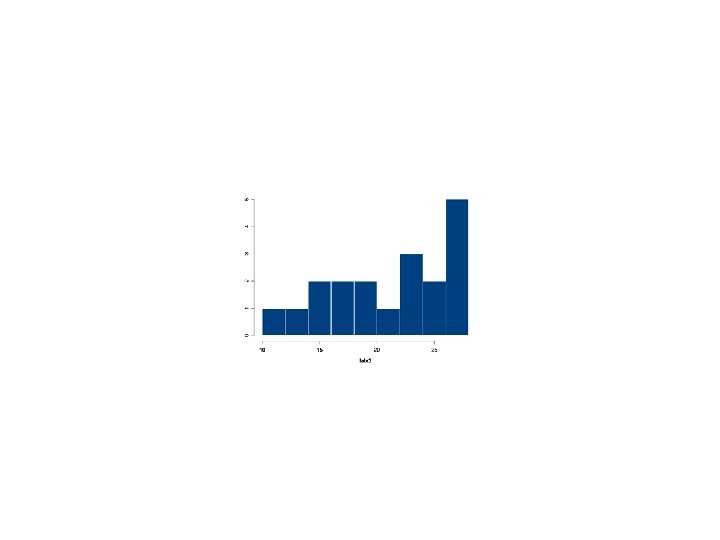
Histograms from observed data • Represented are indexes and sum scores from the sub scales of WISC-III • In this presentation are used data from patients whom were tested with WISC-III at least once • WISC-III was used for 50, and 38 of the patients in the three waves • Allthough the presentation is marked ”(n = 50)”, this is the maximum possible number of ptt, but different numbers of participants may be represented in each graph • The graphs are only for use as orientation about the distributions of the sample data
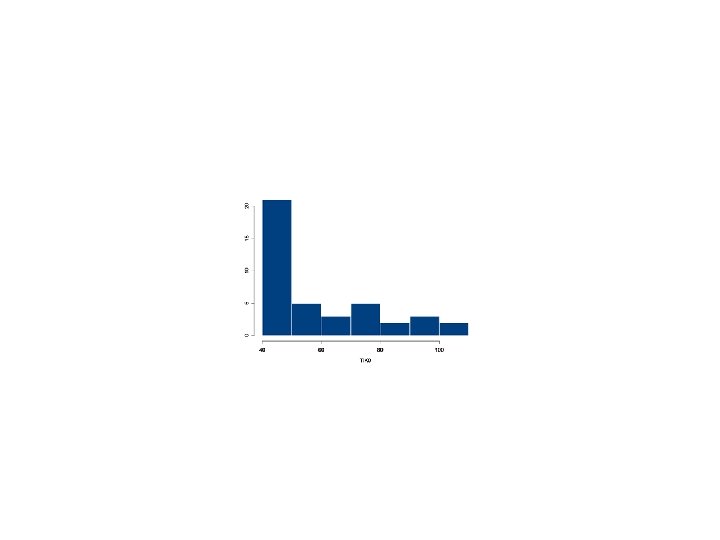
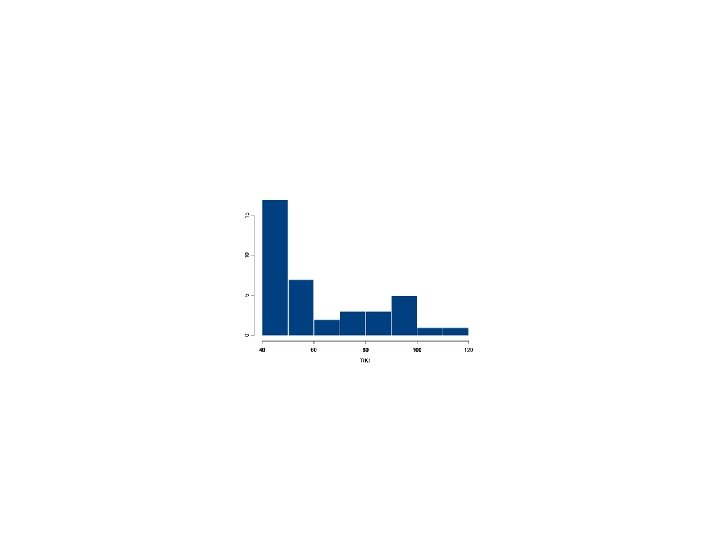
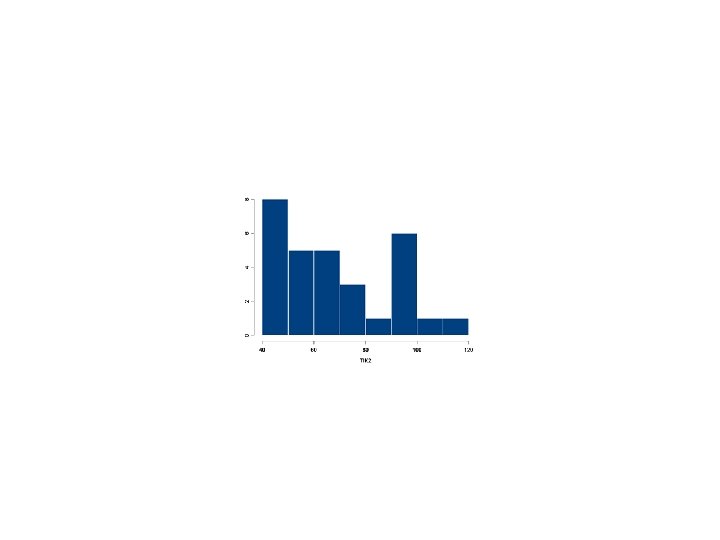
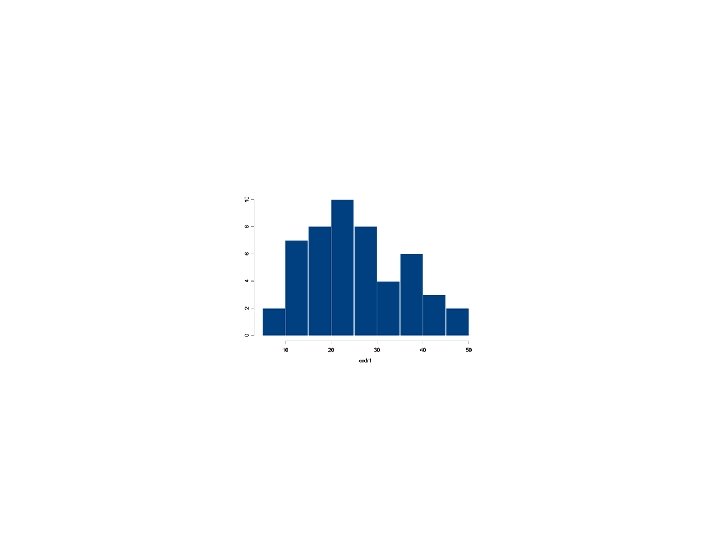
 TIK-indekses for the three waves as entered from the")
Histograms for WISC-III data (n=50) TIK-indekses for the three waves as entered from the paper tests
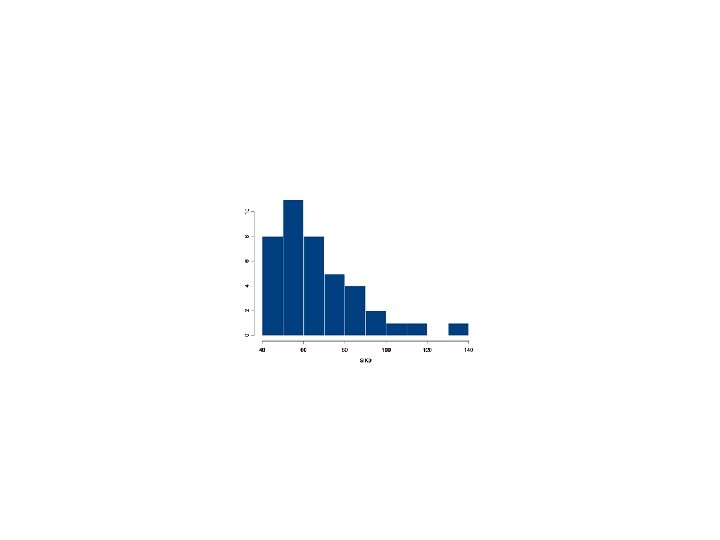
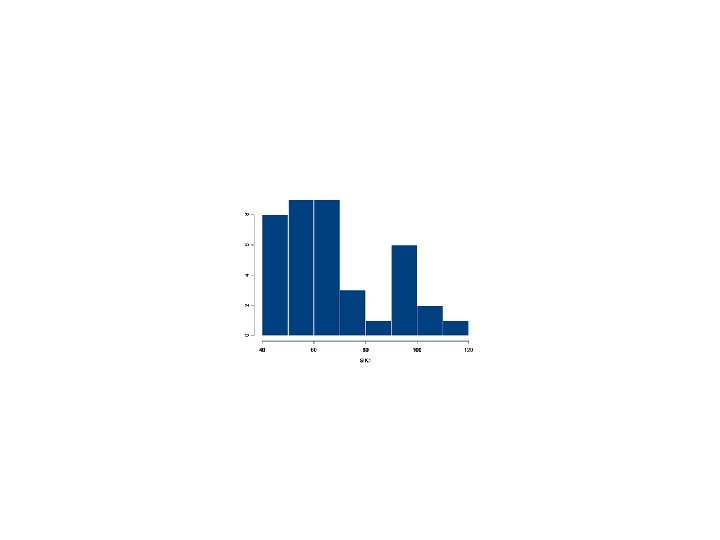
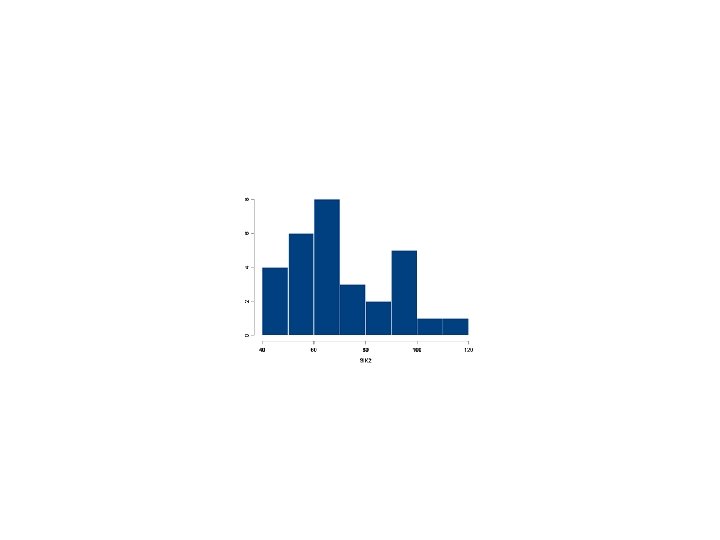
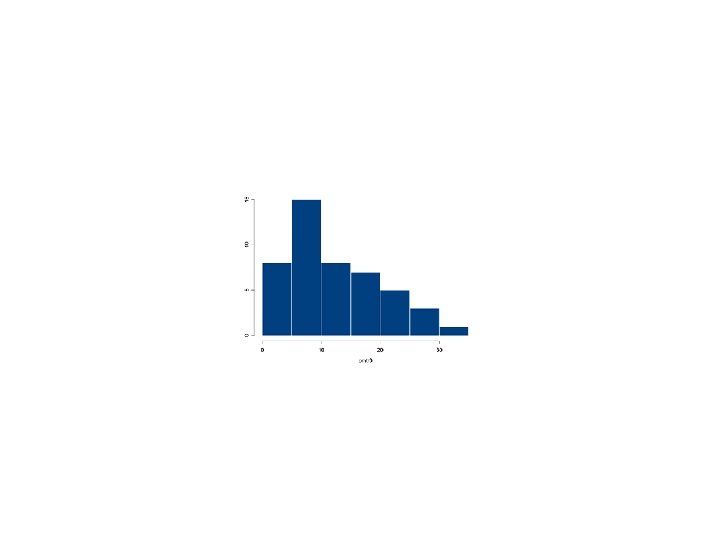
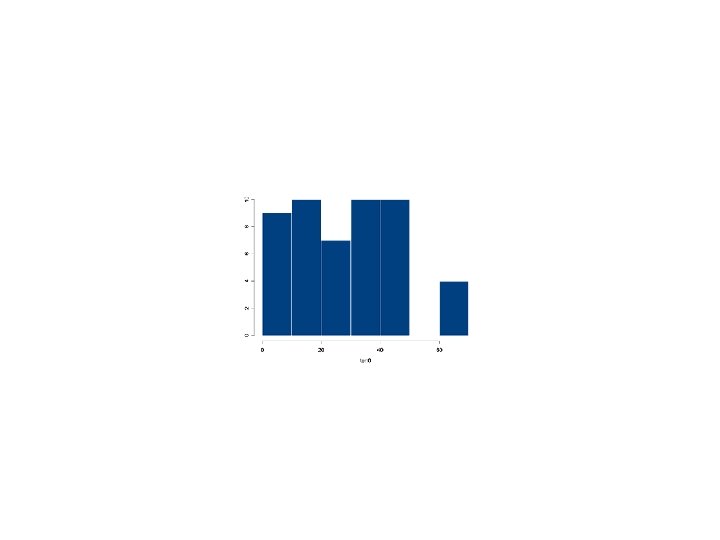
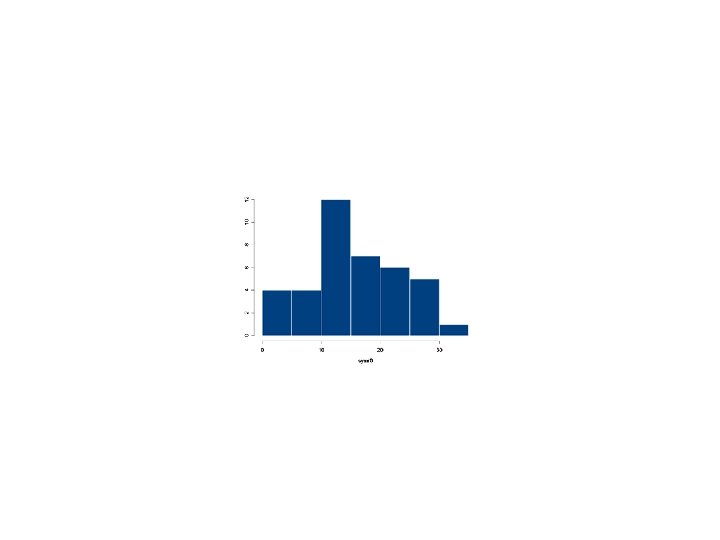
 SIK-indekses for the three waves as entered from the")
Histograms for WISC-III data (n=50) SIK-indekses for the three waves as entered from the paper tests
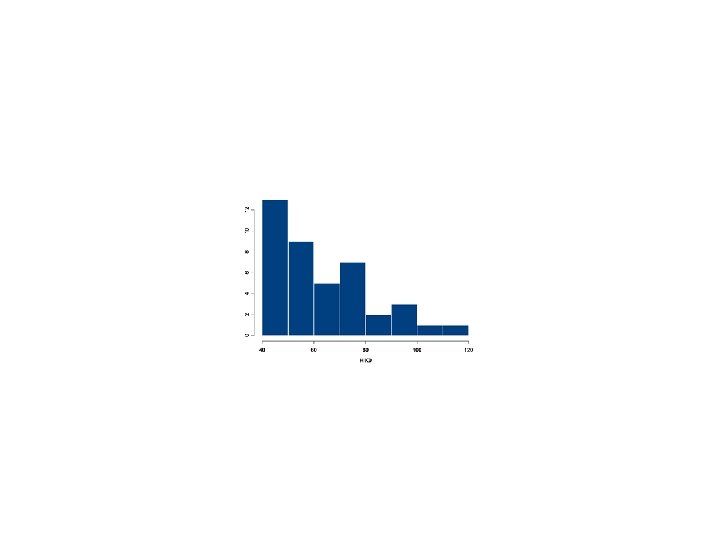
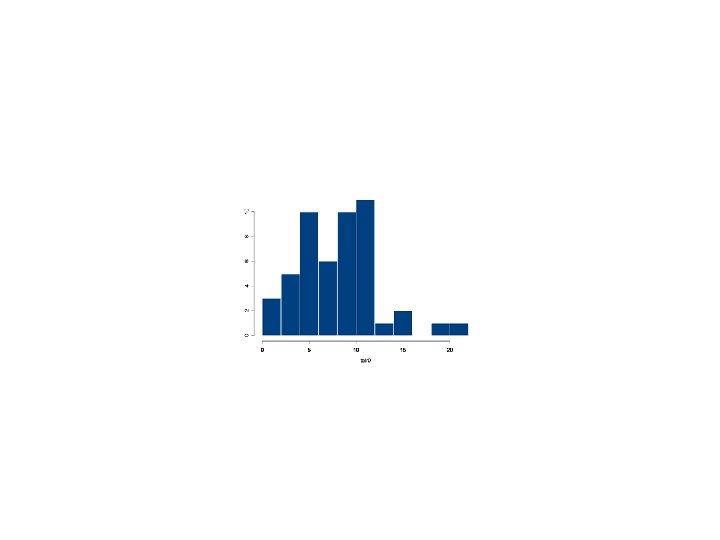
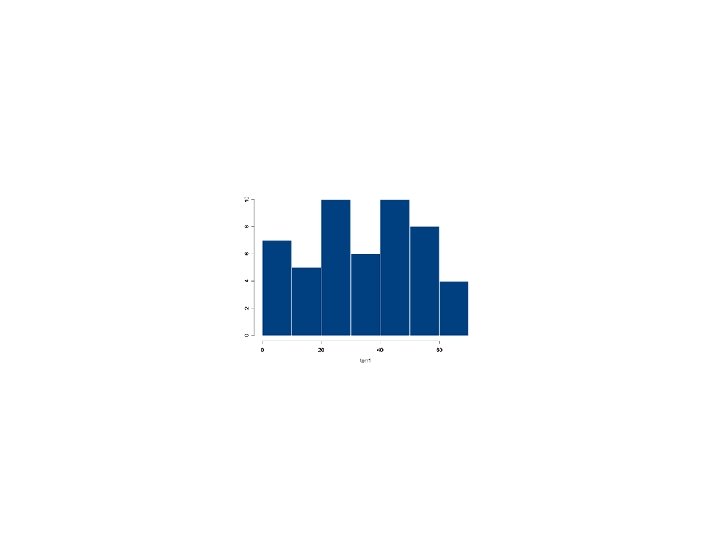
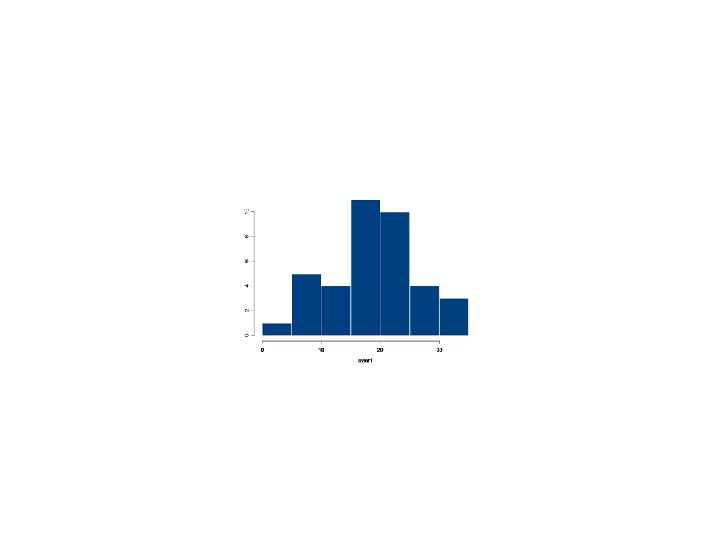
 HIK-indekses for the three waves as entered from the")
Histograms for WISC-III data (n=50) HIK-indekses for the three waves as entered from the paper tests


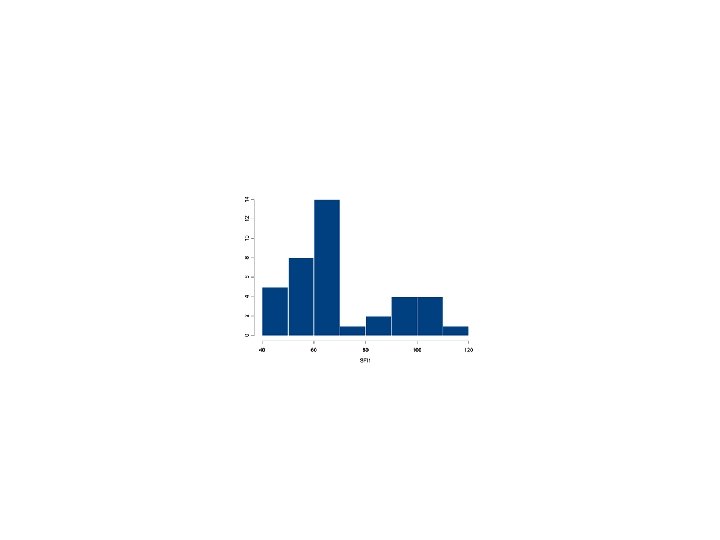
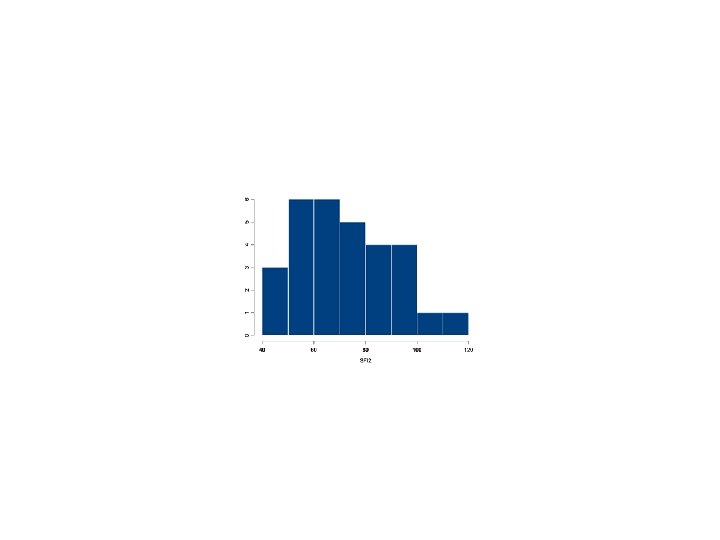
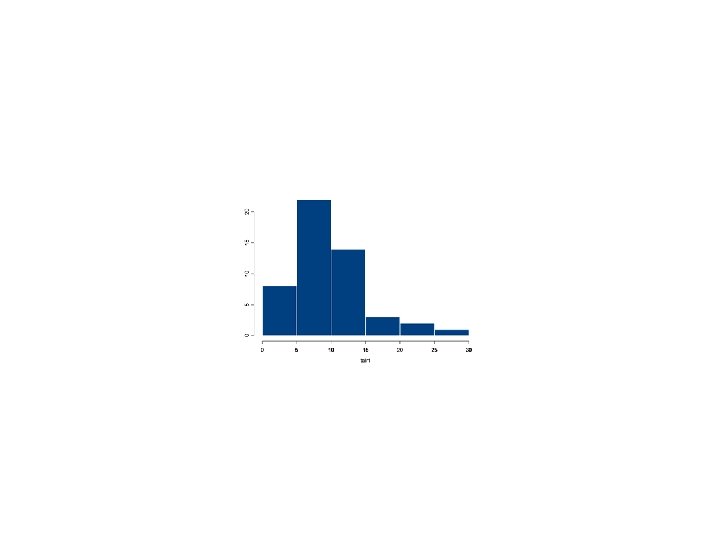
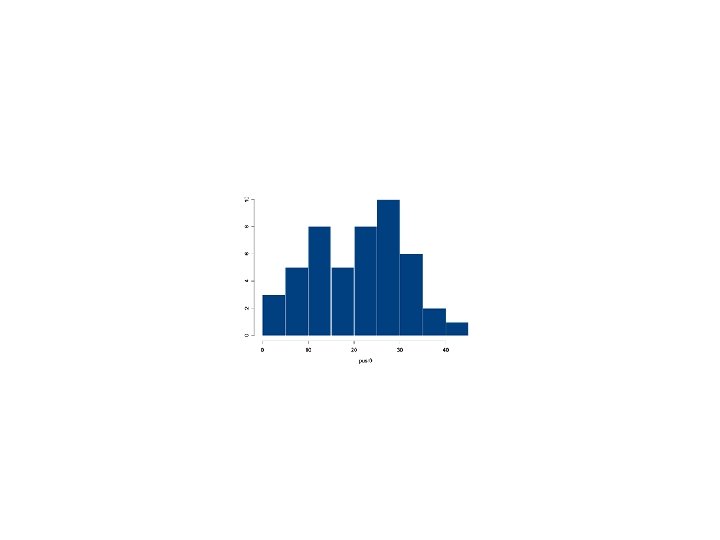
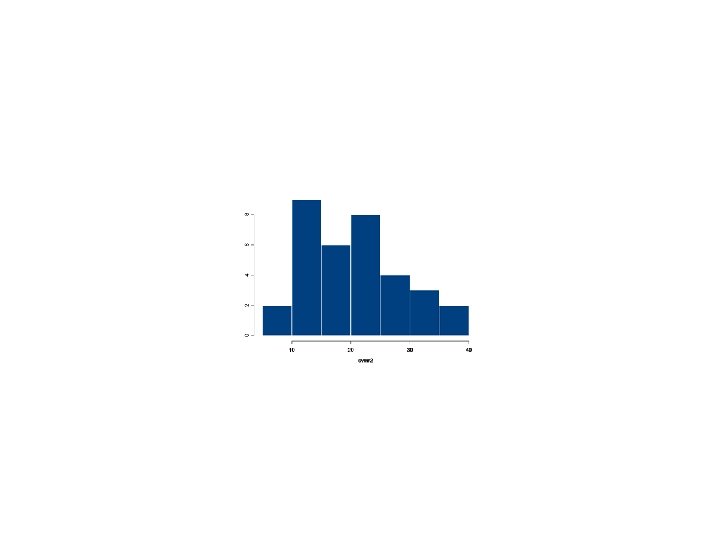
 SFI-indekses for the three waves as entered from the")
Histograms for WISC-III data (n=50) SFI-indekses for the three waves as entered from the paper tests

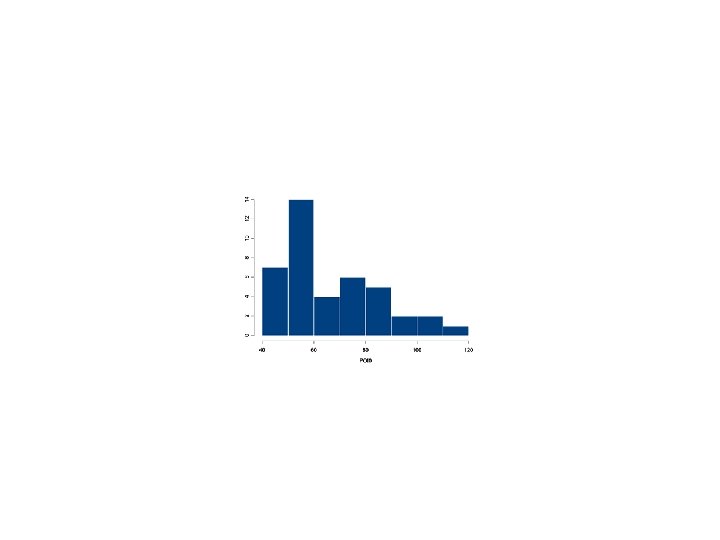
 POI-indekses for the three waves as entered from the")
Histograms for WISC-III data (n=50) POI-indekses for the three waves as entered from the paper tests

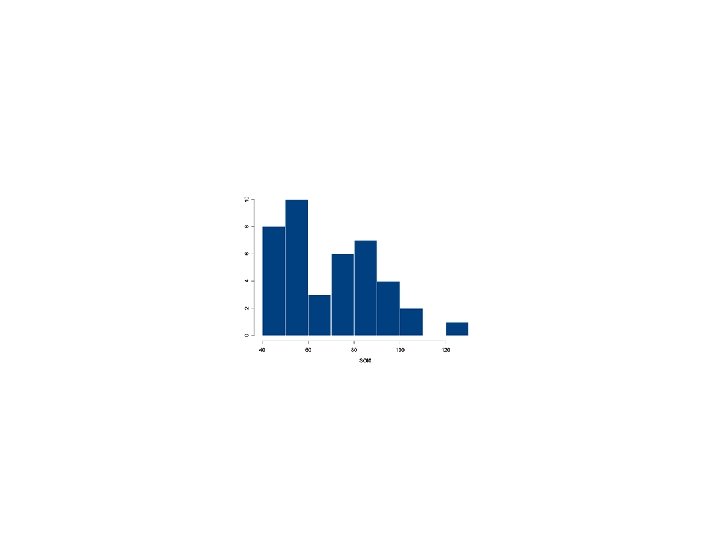
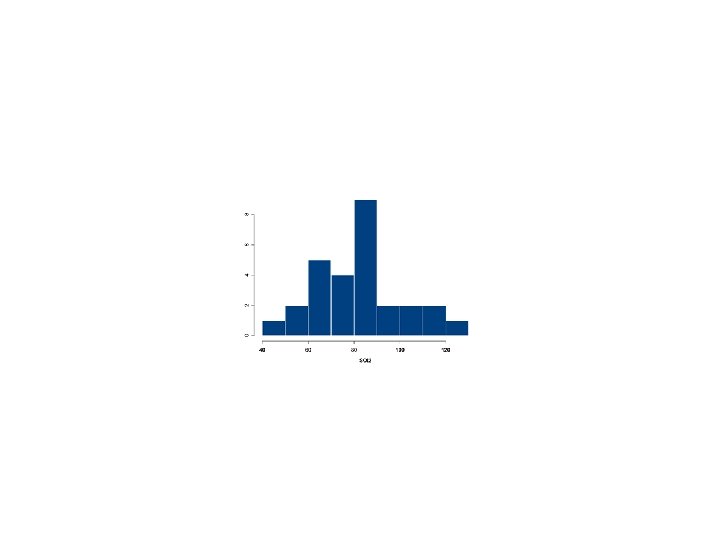
 SOI-indekses for the three waves as entered from the")
Histograms for WISC-III data (n=50) SOI-indekses for the three waves as entered from the paper tests

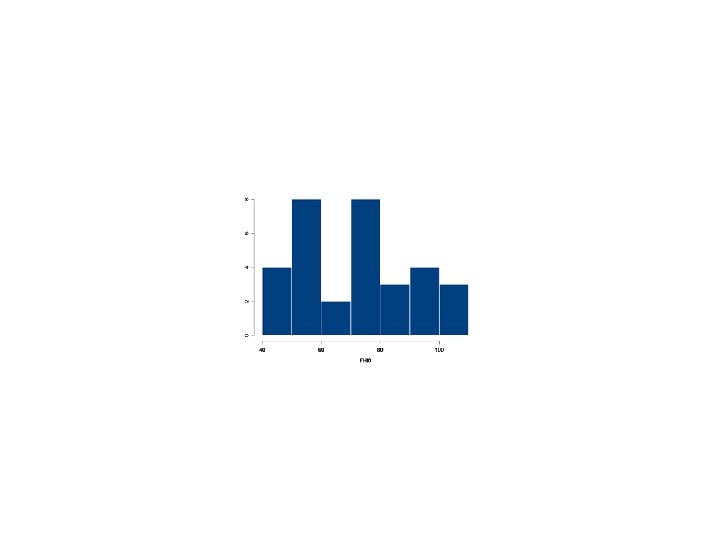
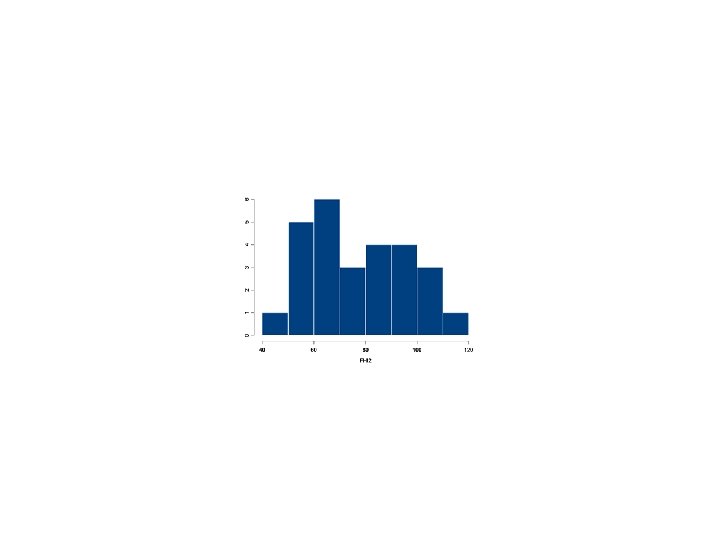
 FHI-indekses for the three waves as entered from the")
Histograms for WISC-III data (n=50) FHI-indekses for the three waves as entered from the paper tests

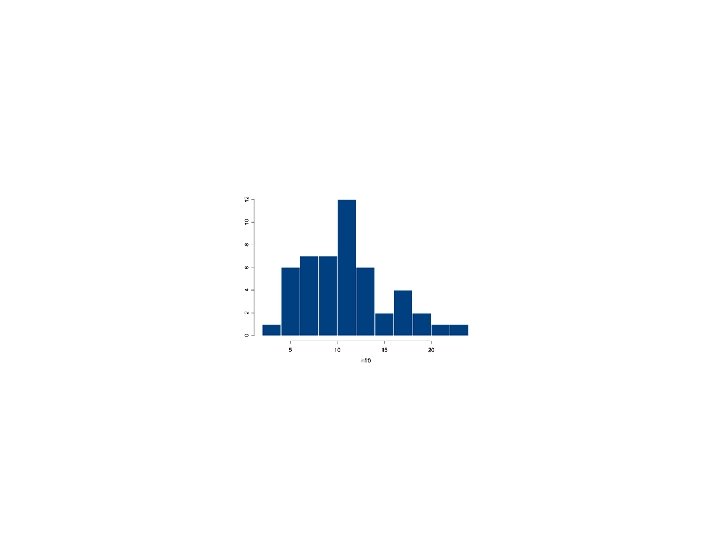
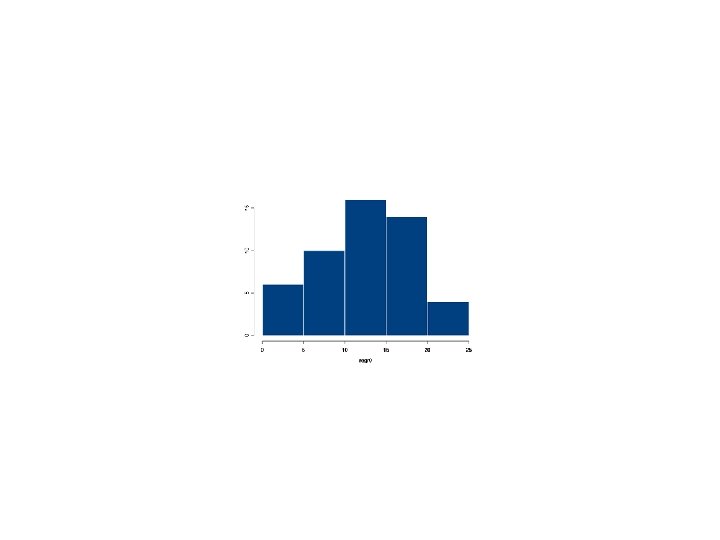
 Information scales for three waves as entered from the")
Histograms for WISC-III data (n=50) Information scales for three waves as entered from the paper tests
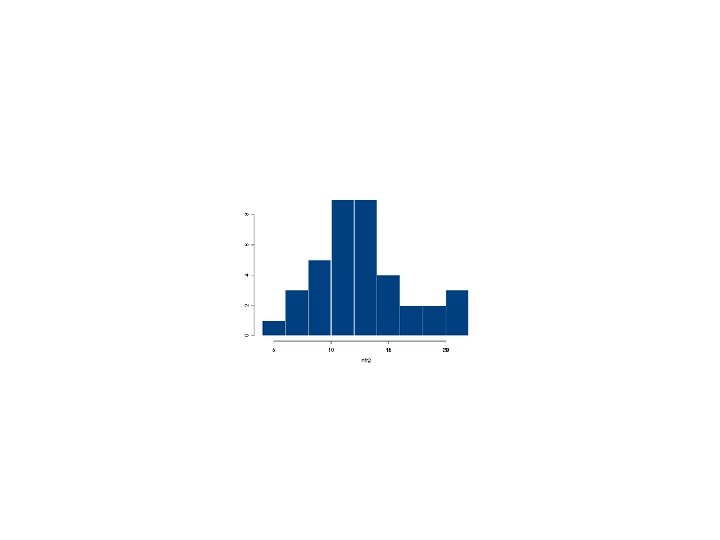
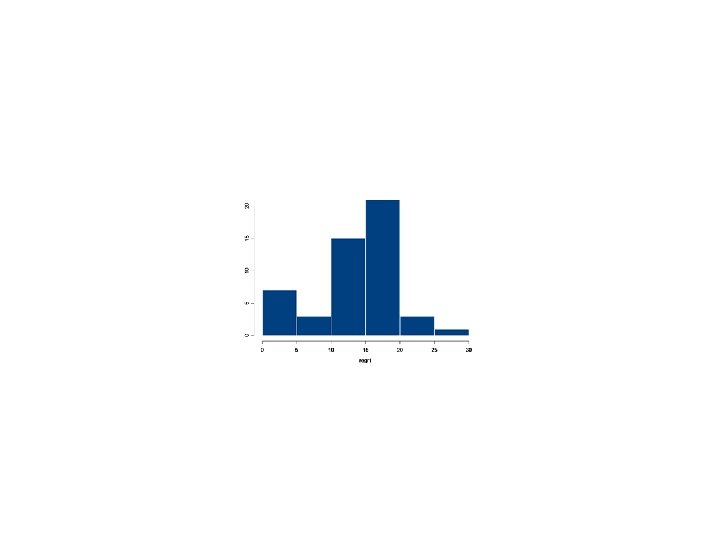
 Similarites scales for three waves as entered from the")
Histograms for WISC-III data (n=50) Similarites scales for three waves as entered from the paper tests
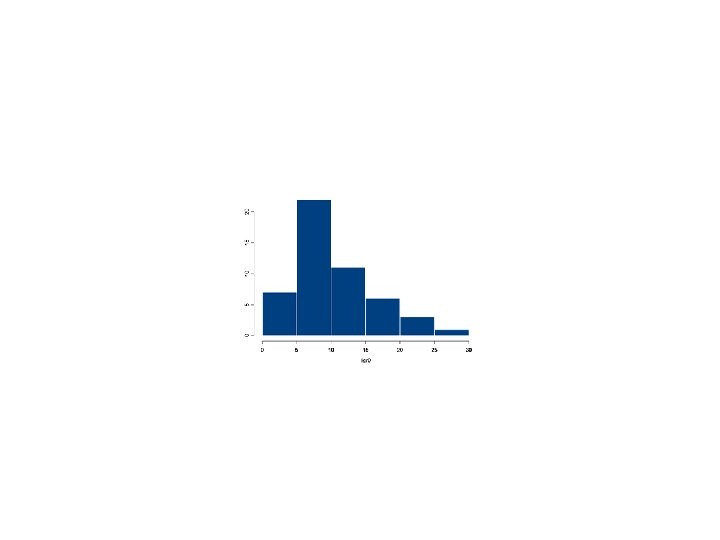

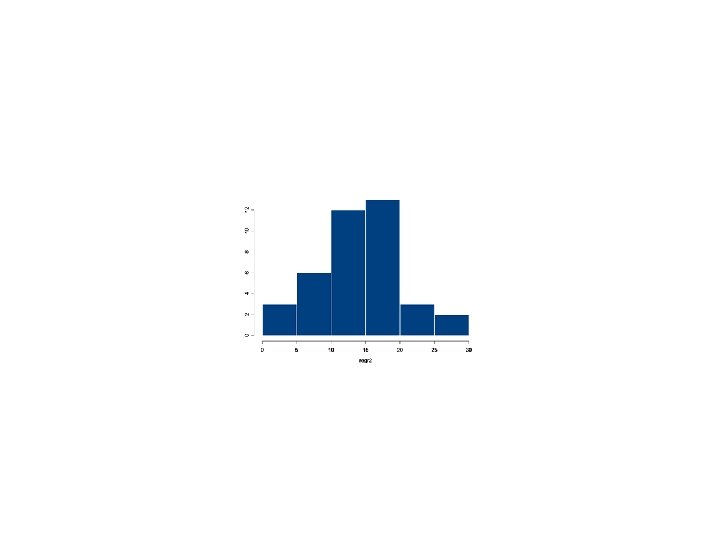
 Arithmetic scales for three waves as entered from the")
Histograms for WISC-III data (n=50) Arithmetic scales for three waves as entered from the paper tests
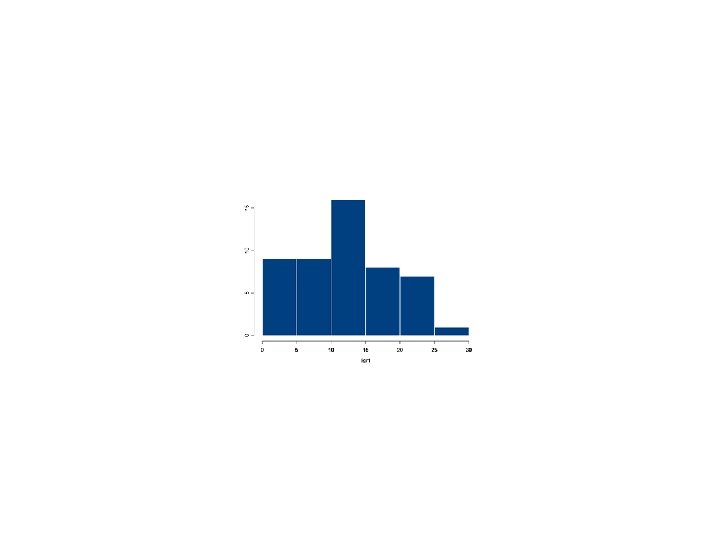
 Vocabulary scales for three waves as entered from the")
Histograms for WISC-III data (n=50) Vocabulary scales for three waves as entered from the paper tests

 Comprehension scales for three waves as entered from the")
Histograms for WISC-III data (n=50) Comprehension scales for three waves as entered from the paper tests


 Digit Span scales for three waves as entered from")
Histograms for WISC-III data (n=50) Digit Span scales for three waves as entered from the paper tests

 Picture Completion scales for three waves as entered from")
Histograms for WISC-III data (n=50) Picture Completion scales for three waves as entered from the paper tests


 Coding-Digit Symbol scales for three waves as entered from")
Histograms for WISC-III data (n=50) Coding-Digit Symbol scales for three waves as entered from the paper tests

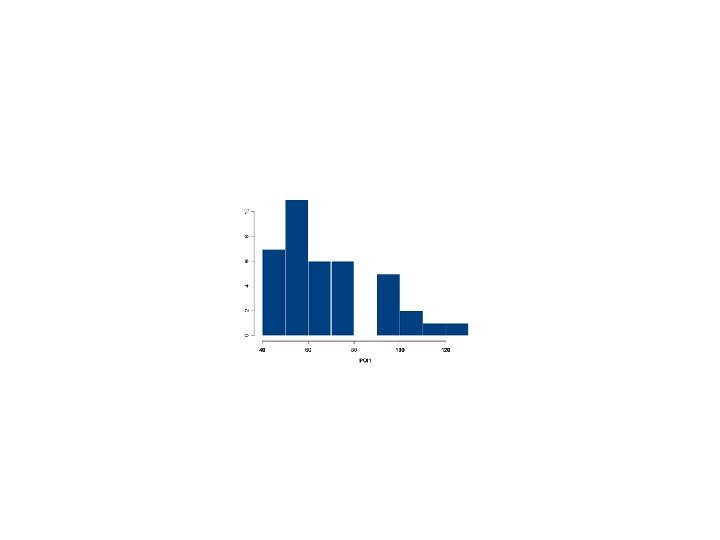
 Picture Arrangement scales for three waves as entered from")
Histograms for WISC-III data (n=50) Picture Arrangement scales for three waves as entered from the paper tests

 Block Design scales for three waves as entered from")
Histograms for WISC-III data (n=50) Block Design scales for three waves as entered from the paper tests

 Object Assembly scales for three waves as entered from")
Histograms for WISC-III data (n=50) Object Assembly scales for three waves as entered from the paper tests

 Symbol Search scales for three waves as entered from")
Histograms for WISC-III data (n=50) Symbol Search scales for three waves as entered from the paper tests
 Mazes scales for three waves as entered from the")
Histograms for WISC-III data (n=50) Mazes scales for three waves as entered from the paper tests
- Slides: 82