Histograms Demonstration This resource provides animated demonstrations of


 Frequency Density F÷W 50 50 1")
 Frequency Density F÷W 50 50 1")
 Frequency Density F÷W 50 50 1")
 Frequency Density F÷W 50 50 1")


 10 Cumulative Frequency 10 Group Width (W) 20 Frequency Density")
 Frequency (F) 20 Cumulative Frequency 20 Group Width (W) 4 Frequency")
 Frequency (F) 15 Cumulative Frequency 15 Group Width (W) 2 Frequency")

- Slides: 19
Histograms – Demonstration This resource provides animated demonstrations of the mathematical method. Check animations and delete slides not needed for your class.
Test results for Year 7. 1. 5 10 20 0. 5 Does the chart accurately represent the data? The groups are not the same size, so a bar-chart distorts the data. For example, 0 to 50 should have a high frequency because it is a much wider group. 40 30 20 10 0 0 Mark (m) 00 20 80 to 1 30 50 0 2 o 8 10 60 t 20 60 1 to 50 50 50 Year 7 Test Results 50 Frequency Density F÷W 0 t o Group Width (W) Frequency Mark, m Frequency (F) Bar Chart
Test results for Year 7. Group Width (W) Frequency Density F÷W 50 50 1 20 10 2 30 20 1. 5 10 20 0. 5 Does the chart accurately represent the data? This graph has the same problem: unequal group widths plotted with frequency distorts the data. We need to combine frequency and group size fairly. Year 7 Test Results 50 40 Frequency Mark, m Frequency (F) Histogram 30 20 10 0 0 20 40 60 Mark (m) 80 100
Test results for Year 7. Group Width (W) Frequency Density F÷W 50 50 1 20 10 2 30 20 1. 5 10 20 0. 5 We want to compare frequency with the group width. Is there relatively a lot of students in the group? Is the group packed (dense) with students? To do this, we divide the frequency by the class width to get the frequency density. Frequency Density = Frequency Class width Year 7 Test Results 2. 5 Frequency Density Mark, m Frequency (F) Histogram 2. 0 1. 5 1. 0 0. 5 0 0 20 40 60 Mark (m) 80 100
Test results for Year 7. Group Width (W) Frequency Density F÷W 50 50 1 20 10 2 30 20 1. 5 10 20 0. 5 We want to compare frequency with the group width. Is there relatively a lot of students in the group? Is the group packed (dense) with students? To do this, we divide the frequency by the class width to get the frequency density. Frequency Density = Frequency Class width 2. 5 Frequency Density Mark, m Frequency (F) Histogram How many students does Year 71 square represent? Test Results 2. 0 2. 5 1. 0 0. 5 0 2. 5 2. 5 0 20 40 60 Mark (m) 80 100
Test results for Year 7. Group Width (W) Frequency Density F÷W 50 50 1 20 10 2 30 20 1. 5 10 20 0. 5 By averaging each group, we can split the data into equal-sized bars. We can see where most students are in the distribution. Frequency Density of 1. For every 10 marks, there’s 10 people. Frequency Density of 2. Year 7 Test Results For every 10 marks, there’s 20 people. 2. 5 Frequency Density Mark, m Frequency (F) Histogram 2. 0 1. 5 1. 0 0. 5 0 0 20 40 60 Mark (m) 80 100
When might data have unequal class-sizes? A police officer records cars on a road, and whether they are speeding (above 30 mph). 0 -20 mph Legal 20 -30 mph Close to legal limit 30 -35 mph 35 -60 mph Just over Very illegal! How many hours do you play computer games every weekday? 0 -30 mins One game 30 mins to 1 hour Two games 1 -2 hours 2 -4 hours Includes probable maximum
Histograms 60 50 40 30 20 10 0 Equal Class Width 8 r ea Y 0 9 ar e Y r 1 a e Y Discrete data Frequency, or frequency density 60 50 40 30 20 10 0 140 Unequal Class Width Frequency Density Y r 7 a e Frequency Bar Chart 150 160 170 Height (cm) 2 1. 5 1 0. 5 0 140 150 160 170 Height (cm) Grouped continuous data
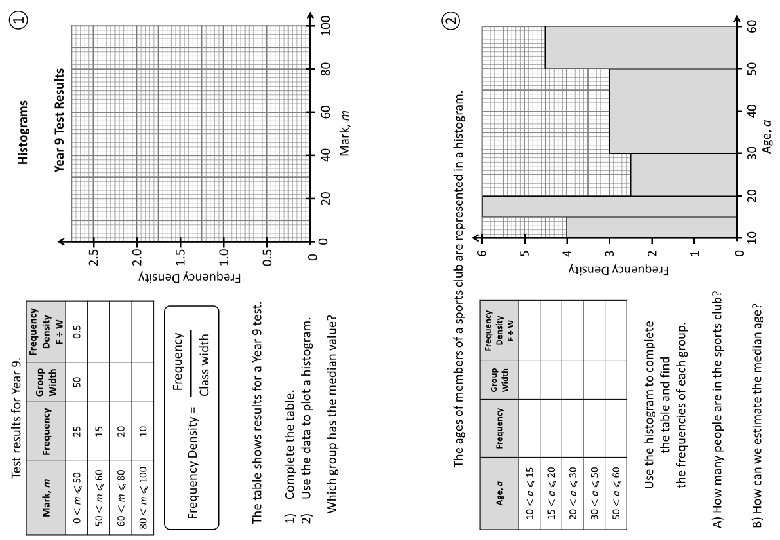
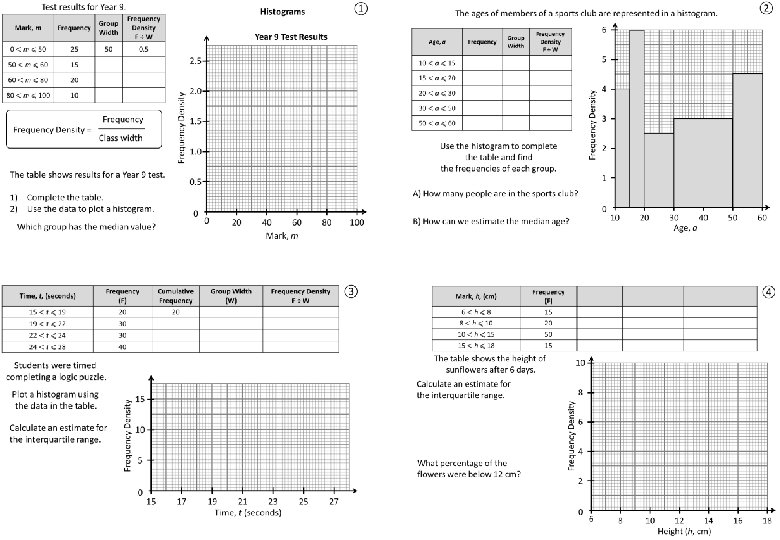
Test results for Year 9. Frequency Density F÷W 25 50 0. 5 15 10 1. 5 20 20 1 10 20 0. 5 Frequency Density = Frequency Class width The table shows results for a Year 9 test. 1) Complete the table. 2) Use the data to plot a histogram. Which group has the median value? Year 9 Test Results 2. 5 Frequency Density Mark, m Group Width ① Histograms 2. 0 1. 5 1. 0 0. 5 0 0 20 40 60 Mark, m 80 100
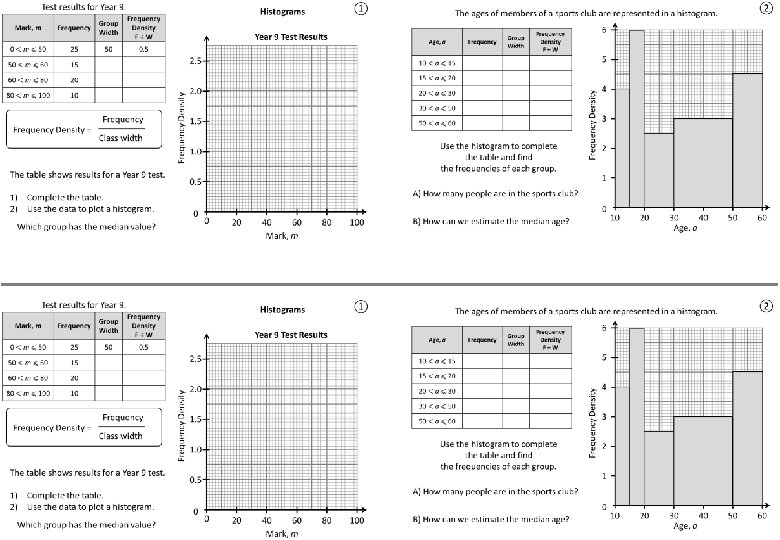
② The ages of members of a sports club are represented in a histogram. Frequency Group Width 20 5 4 30 5 6 25 10 2. 5 60 20 3 45 10 4. 5 6 5 Frequency Density Age, a Frequency Density F÷W Use the histogram to complete the table and find the frequencies of each group. 4 35 years old 3 2 1 A) How many people are in the sports club? 180 B) How can we estimate the median age? 0 10 20 30 40 Age, a 50 60
Mark, m Frequency (F) 10 Cumulative Frequency 10 Group Width (W) 20 Frequency Density F÷W 0. 5 20 30 40 0. 5 20 50 10 2 30 80 30 1 The table shows test results for Year 10 students. Calculate an estimate for… 65 …the median mark. 2. 0 = 65 marks …the interquartile range. Frequency Density Median = 80/2 = 40 th value 1. 5 80 1. 0 40 0. 5 0 80 – 40 = 40 marks 0 20 40 60 Mark, m 80 100
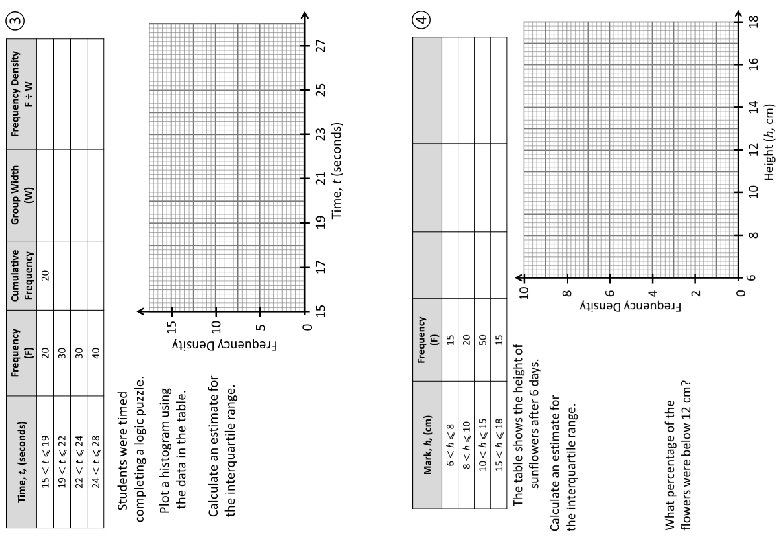
Time, t, (seconds) Frequency (F) 20 Cumulative Frequency 20 Group Width (W) 4 Frequency Density F÷W 5 30 50 3 10 30 80 2 15 40 120 4 10 Plot a histogram using the data in the table. Calculate an estimate for the interquartile range. Frequency Density Students were timed completing a logic puzzle. 15 10 25 – 20 = 5 seconds 25 5 0 20 15 17 19 21 23 Time, t (seconds) 25 27 ③
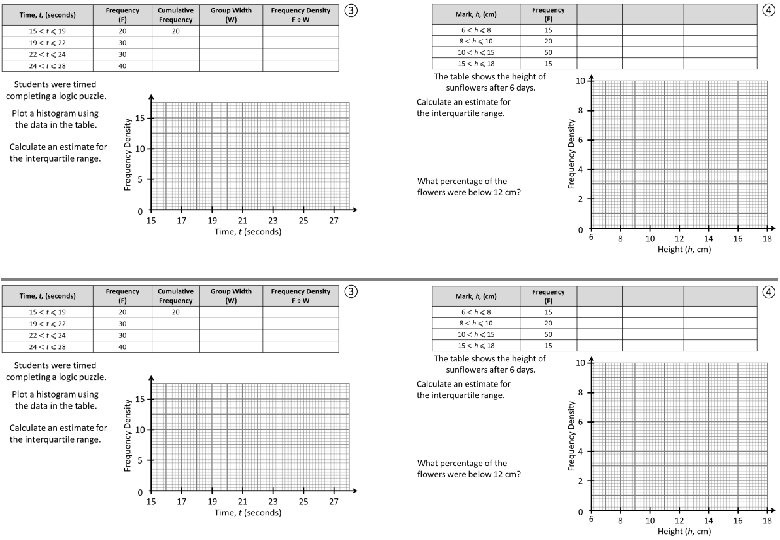
Mark, h, (cm) Frequency (F) 15 Cumulative Frequency 15 Group Width (W) 2 Frequency Density F÷W 7. 5 20 35 2 10 50 85 5 10 15 100 3 5 The table shows the height of sunflowers after 6 days. 14 – 9 = 5 cm What percentage of the flowers were below 12 cm? 14 8 Frequency Density Calculate an estimate for the interquartile range. 9 10 ④ Two-fifths of 50 = 20 15 + 20 = 55% 6 15 20 20 4 2 0 6 8 10 12 14 Height (h, cm) 16 18
Questions? Comments? Suggestions? …or have you found a mistake!? Any feedback would be appreciated . Please feel free to email: tom@goteachmaths. co. uk