Histograms Definition of a Histogram A Histogram displays


- Slides: 9
Histograms
Definition of a Histogram • A Histogram displays a range of values of a variable that have been broken into groups or intervals. • Histograms are useful if you are trying to graph a large set of quantitative data • To make a Histogram, you divide the range of data into intervals of equal length, count the number of observations in each interval, and represent each interval with a bar indicating the number of observations.
Disenfranchisement Rates for all 50 States 0 1. 5 2. 8 3. 1 8. 1 17. 1 1. 2 3 24. 9 3. 9 4. 6 10. 3 6. 6 14 2. 8 5 9. 2 11. 3 16. 1 17. 4 7. 2 14. 2 16 0. 7 2. 8 3. 7 4 8. 3 18. 9 3. 5 4. 2 9. 2 2. 4 4 5. 7 12. 9 2. 6 4. 2 7. 9 14. 3 2. 8 6. 2 8. 3 8. 4 24. 7 0 0. 8 1. 5 2. 6
Step 1: Sort the Data from Lowest to Highest 0 0 0. 7 0. 8 2. 6 2. 8 4 4 4. 2 7. 9 8. 1 8. 3 14 14. 2 14. 3 16 1. 2 1. 5 2. 4 2. 6 2. 8 3 3. 1 3. 5 3. 7 3. 9 4. 6 5 5. 7 6. 2 6. 6 7. 2 8. 4 9. 2 10. 3 11. 3 12. 9 16. 1 17. 4 18. 9 24. 7 24. 9
Step 2: Determine how many groups of data you want to have. For example, we’ll use 5 groups Step 3: Determine the approximate range of the set of data 0% through 24. 9% (approximately 25%) Step 4: From Steps 2 and 3, determine the range of each individual group I decided to have 5 groups. The range is from 0% - 25% divided by 5 is 5%. So each group should have a range of 5%.
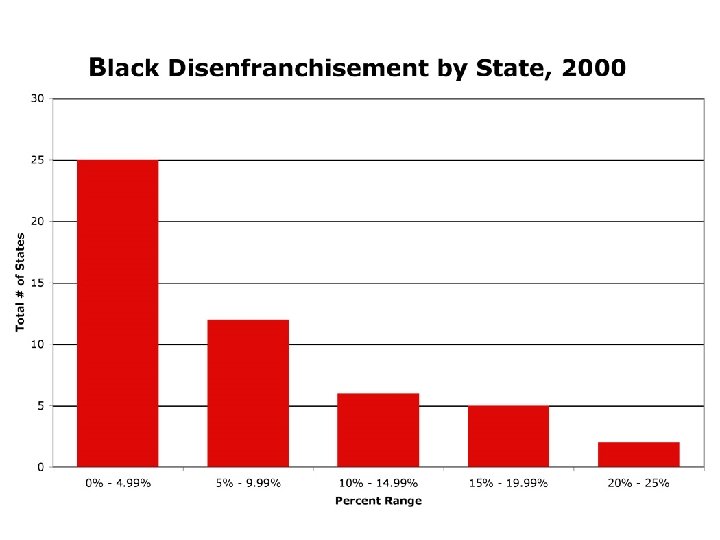
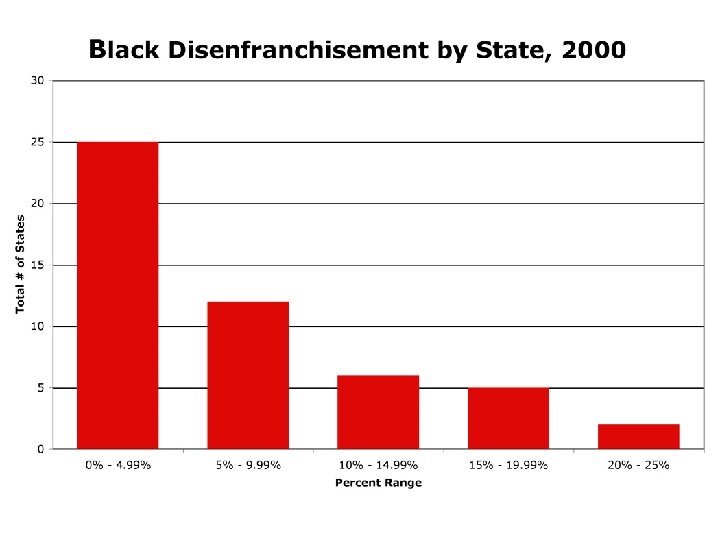
Step 5: Make a list of the groups you will be using. Group 1: 0% - 5% Group 2: 5% - 10% Group 3: 10% - 15% Group 4: 15% - 20% Group 5: 20% - 25% Step 6: Using your data, count how many numbers fall into each group Group 1: 0% - 4. 99% Group 2: 5% - 9. 99% Group 3: 10% - 14. 99% Group 4: 15% - 19. 99% Group 5: 20% - 25% 25 12 6 5 2
Step 7: graph each group 25 12 6 5 2