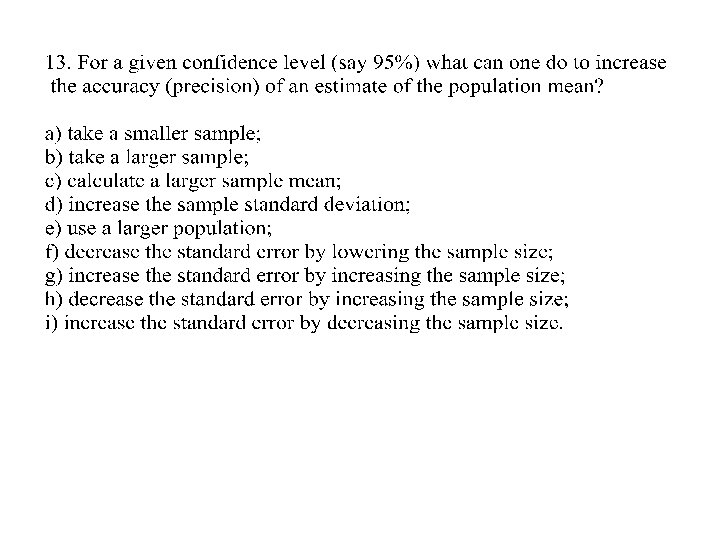
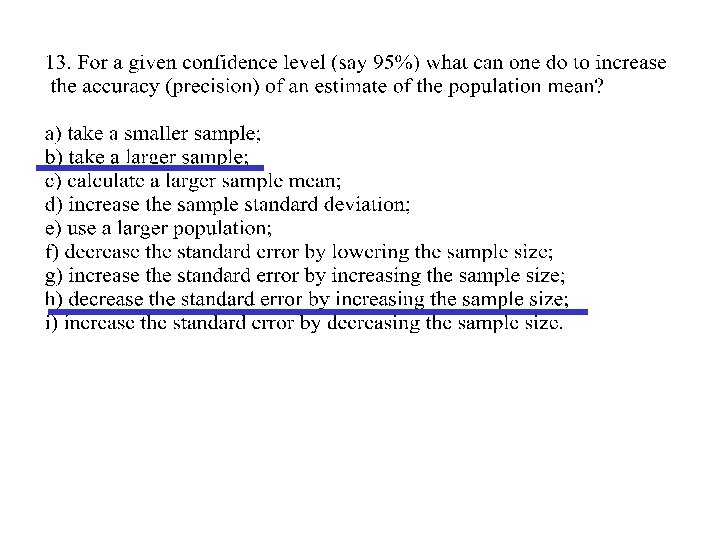
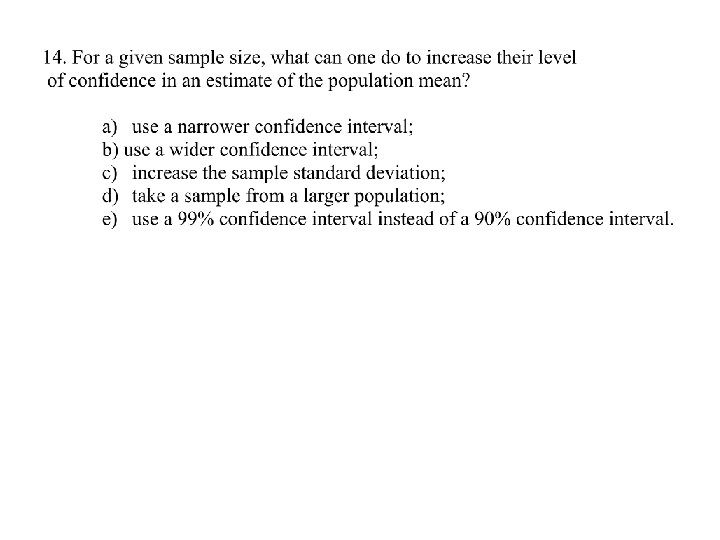
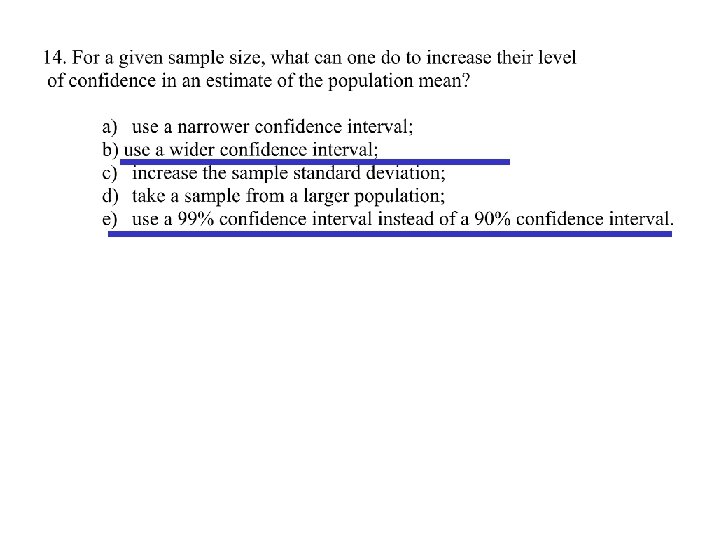
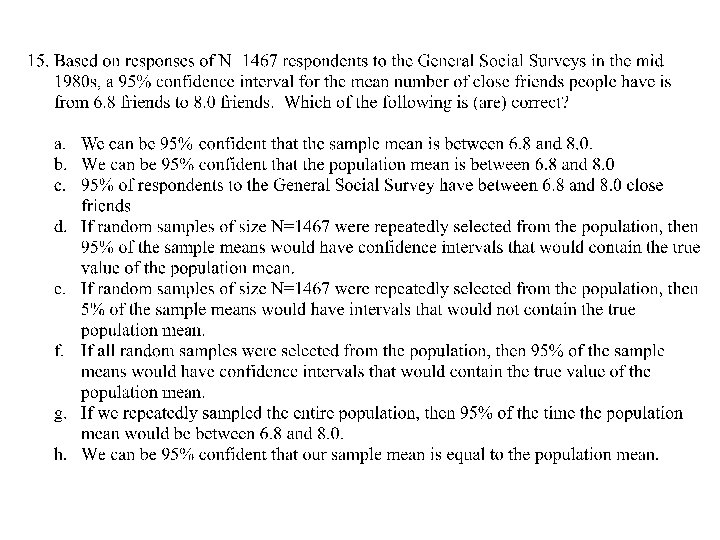
Hint 2 answers are correct 4 answers are


- Slides: 90
Hint, 2 answers are correct 4 answers are incorrect
Details • ********************* • Midterm #1 Tuesday February 3 • Bring: – – Scantron Form F-288 -ERI-L #2 pencil Calculator One page of notes (8 ½ x 11) • ********************* • Homework #1 Due Today in lecture – I will post answers tomorrow
Midterm #1 Review • Laura will do a review session • Friday 1/30 from 1: 00 -2: 00 pm • 4206 SSPB
LARC Tutor http: //www. larc. uci. edu/ Look under Soc Sci ANTHRO 10 B SOCIOL 10 B
Sampling Distribution of the Proportion • Sampling Distribution – Mean – Standard error – Shape • Confidence Intervals for proportion • Margin of error +/- ___% • Reading, Chapter 5, pages 131 -135
Confidence Interval for a Proportion Population proportion Is unknown Estimate the Standard Error
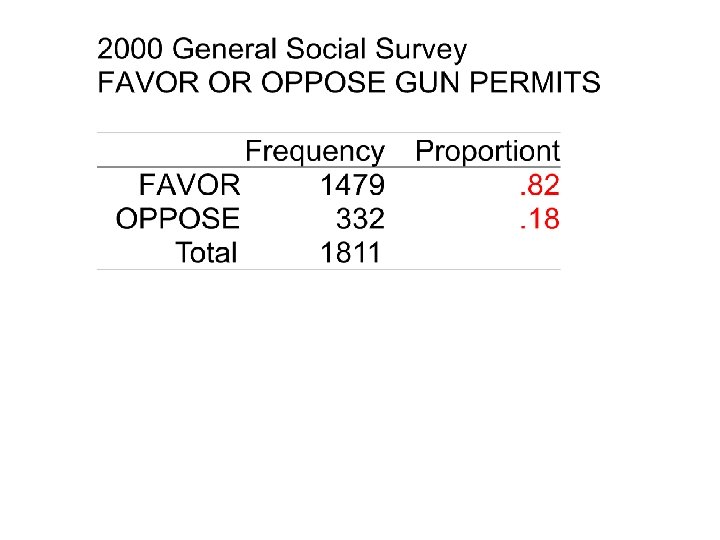
Find the 95% Confidence Interval For the proportion in favor
Find the 95% Confidence Interval For the proportion in favor
. 025 Z = +/ - 1. 96 Why. 025 ?
95% Confidence Interval
95% Confidence Interval
95% Confidence Interval
95% Confidence Interval We can be 95% confident that in the population between. 8004 and. 8396 favor gun permits
Confidence Interval for a Percent • Multiply the proportion by 100
82% favor gun permits
95% Confidence Interval We can be 95% confident that in the population between. 8004 and. 8396 favor gun permits
95% Confidence Interval for the percent in favor We can be 95% confident that in the population between 80. 04% and 83. 96% favor gun permits
95% Confidence Interval for the percent in favor 82% favor gun permits
95% Confidence Interval for the percent in favor We can be 95% confident that in the population 82% plus or minus 1. 96% favor gun permits
Stopped here on Tuesday 1/27
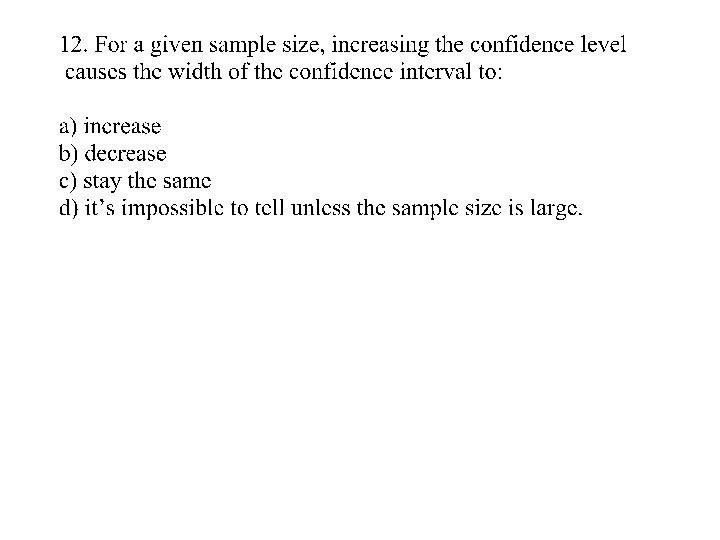
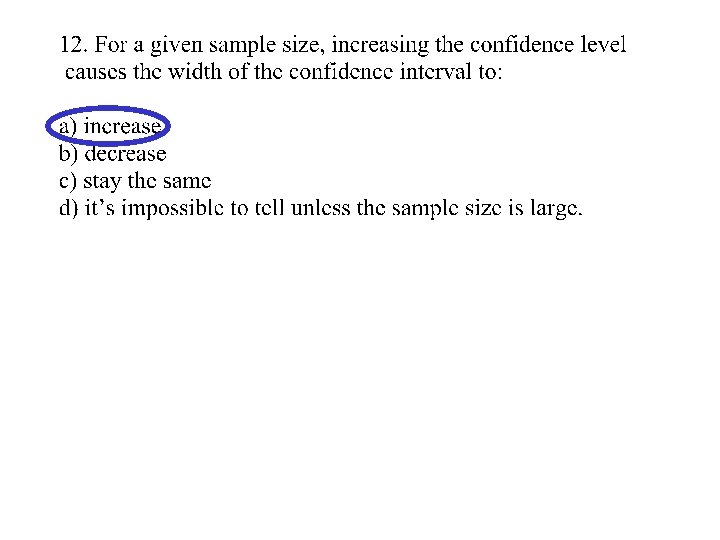
• Confidence interval and confidence level 90% confidence 95% confidence 99% confidence
90% Confidence Interval for the proportion in favor
90% Confidence Interval for the proportion in favor
90% Confidence Interval for the proportion in favor
90% Confidence Interval for the percent in favor 82% plus or minus 1. 65%
99% Confidence Interval for the proportion in favor
99% Confidence Interval for the proportion in favor
99% Confidence Interval for the proportion in favor
99% Confidence Interval for the percent in favor 82% plus or minus 2. 58%
People in the US are not in favor of gun permits I don’t think that’s correct
Do adults in the US oppose gun permits? In fact, I’m very confident people FAVOR gun permits
Margin of Error It seems like this is often plus or minus 3% Why is that?
http: //www. pollingreport. com/race. htm#Immigration
Margin of Error • • Plus or minus some % Around the sample statistic Includes the population parameter With a given level of confidence
A Problem …. . Margin of Error • For N = 1000 • With confidence level = 95% • How wide is the margin of error? +/- ______% • Assume population proportion =. 5
Sampling Distribution of the Proportion
Sampling Distribution of the Proportion 95%
Sampling Distribution of the Proportion 95%
Sampling Distribution of the Percent 95%
Sampling Distribution of the Percent 95%
http: //www. pollingreport. com/race. htm#Immigration
Another Confidence Interval Example • Do a majority of adults in the US like classical music? • How confident can you be of that conclusion?
General Social Survey 1993
General Social Survey 1993
General Social Survey 1993
Can we be confident that a majority of people like classical music? General Social Survey 1993
80% Confidence Interval
80% Confidence Interval
80% Confidence Interval
80% Confidence Interval
80% Confidence Interval Z = +/ ? Where should I look?
80% Confidence Interval . 10 Z = +/- 1. 28 Where should I look?
80% Confidence Interval
80% Confidence Interval From. 4902 to. 5158 This interval includes the possibility that less than a majority like classical music
70% Confidence Interval Maybe if we are willing to be a little less confident, we can conclude that a majority like classical music
70% Confidence Interval
70% Confidence Interval . 15 Z = +/- 1. 04 Where should I look?
70% Confidence Interval
70% Confidence Interval From. 4926 to. 5134 Even this interval includes the possibility that less than a majority like classical music
60% Confidence Interval Maybe if we are willing to be even less confident, we can conclude that a majority like classical music
60% Confidence Interval
60% Confidence Interval Z = +/- 0. 84 . 20 Where should I look?
60% Confidence Interval
60% Confidence Interval From. 4946 to. 5114 Even this interval includes the possibility that less than a majority like classical music
Confidence Interval Example • Do a majority of adults in the US like classical music? • How confident can you be of that conclusion?
Confidence intervals for the proportion who like classical music 80% CI from. 4902 to. 5158 70% CI from. 4926 to. 5134 60% CI from. 4946 to. 5114 . 495 . 505 . 515
Ace that Midterm !!!
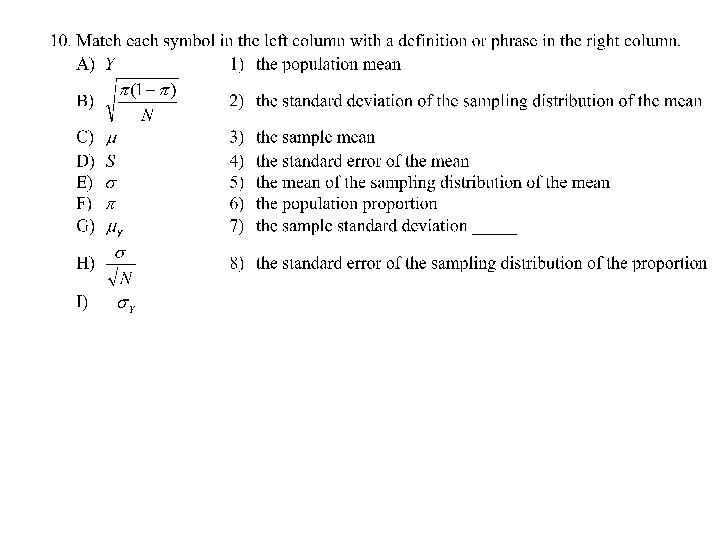
Population standard deviation
95%
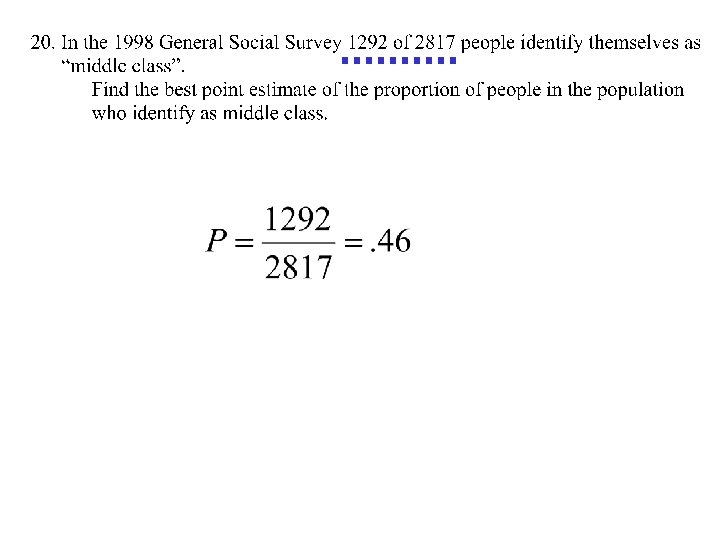
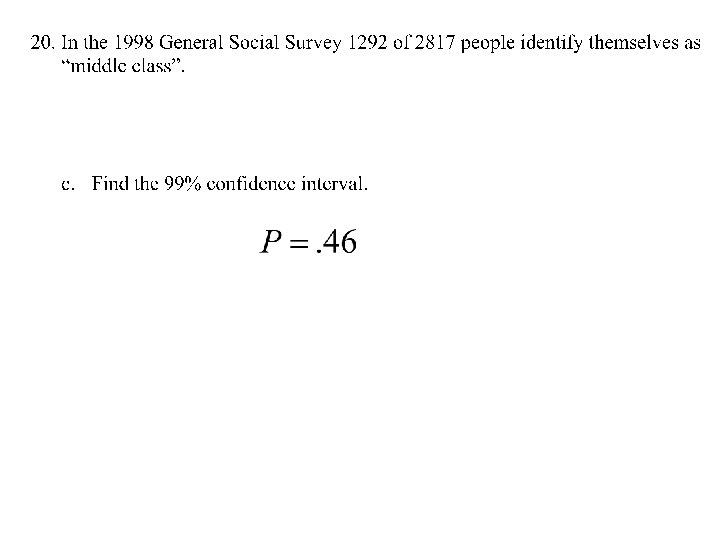
99% confidence interval is from. 43 to. 49 identifying as middle class
99% confidence interval is from. 43 to. 49 identifying as middle class
99% confidence interval is from. 43 to. 49 identifying as middle class I’m 99% confident ……
. 025 Z = +/ - 1. 96 Where should I look?
Another Confidence Interval Example • Do people favor or oppose sex education in the public schools?
General Social Survey 1993
General Social Survey 1993